


ABSTRACT
We present a high-resolution ultraviolet (UV) spectrum of the ultra-metal-poor (UMP) carbon-enhanced red giant HE 0557−4840 (T eff/log g/[Fe/H] = 4900/2.2/−4.8). Combining these data with earlier observations, the radial velocity is 212.0 ± 0.4 km s−1, with no evidence of variability during 2006 February to 2007 December. One-dimensional (1D) LTE model-atmosphere analysis of UV Fe and CH lines confirms the iron and carbon abundances obtained previously ([Fe/H] = −4.8 and [C/Fe]1D = +1.7), and places a more stringent limit on nitrogen abundance of [N/Fe]1D < +1.0. Analysis of the UV OH lines yields [O/Fe]1D = +2.3 ± 0.4. When corrections are made for three-dimensional (3D) effects we obtain [C/Fe]3D = +1.1, [N/Fe]3D < +0.1, and [O/Fe]3D = +1.4. Comparison of the abundances of HE 0557−4840 with those of supernova models of Nomoto et al. and Joggerst et al. suggests that none is able to explain fully the observed abundance pattern. For HE 0557−4840, the Frebel et al. transition discriminant Dtrans(= log(10[C/H] + 0.3 × 10[O/H]) = −3.4 ± 0.2, consistent with fine-structure transitions of C ii and O i being a major cooling mechanism of star-forming regions at the earliest times. Of the four stars known to have [Fe/H] ≲ −4.3, three are strongly carbon and oxygen enhanced. If the suggestion by Caffau et al. that SDSS J102915+172927 ([Fe/H] = −4.7) does not belong to the class of C-rich, O-rich, UMP stars is supported by future similar discoveries, one will need to consider multiple channels for the production of stars having [Fe/H] ≲ −4.3.
Export citation and abstract BibTeX RIS
1. INTRODUCTION
The most metal-poor stars of the halo of the Milky Way provide information on the earliest phases of chemical enrichment of the Galaxy, and properties of the first generations of stars. It was therefore one of the aims of the Hamburg/ESO objective-prism survey (Wisotzki et al. 1996) to enlarge the sample of stars at the lowest metallicities (Christlieb et al. 2008). During the survey, HE 0557−4840 was identified as a metal-poor candidate and found to be extremely metal deficient with follow-up intermediate-resolution (i.e., R = λ/Δλ = 2000) spectroscopy at the Siding Spring Observatory 2.3 m telescope. A subsequent abundance analysis was carried out by Norris et al. (2007, hereafter Paper I), based on high-resolution (R = 40,000) spectra obtained with the Ultraviolet-Visual Echelle Spectrograph (UVES) mounted at the Unit Telescope 2 (UT2) of the Very Large Telescope (VLT).
HE 0557−4840 is a red giant with effective temperature T eff = 4900 K, surface gravity log g = 2.2, and iron abundance [Fe/H] = −4.8.5 It is one of the four stars currently known that have an iron abundance clearly below [Fe/H] = −4.0 (hereafter ultra-metal-poor (UMP) stars)—the other three being the red giant HE 0107−5240 ([Fe/H] = −5.3; Christlieb et al. 2002, 2004), the subgiant HE 1327−2326 ([Fe/H] = −5.4; Frebel et al. 2005, 2008; Aoki et al. 2006; Korn et al. 2009), and the dwarf SDSS J102915+172927 ([Fe/H] = −4.7; Caffau et al. 2011).
The ratio of the carbon abundance relative to that of iron in HE 0557−4840 is enhanced compared with the ratio of these elements in the Sun. Norris et al. (2007) found that [C/Fe] 3D = +0.7, where "3D" refers to determinations employing three-dimensional hydrodynamical model atmospheres, in this case those of Collet et al. (2006). Carbon enhancement is a property shared by two of the other three currently known UMP stars, HE 0107−5240 and HE 1327−2326, in which the carbon enhancement is larger by 2–3 orders of magnitude, namely [C/Fe] 3D = +2.6 (Collet et al. 2006) and [C/Fe] 3D = +3.8 (Frebel et al. 2008), respectively, suggesting similar origins of their abundance patterns. In the fourth UMP star, SDSS J102915+172927, with [C/Fe] 3D ⩽ +0.7 (Caffau et al. 2011), there appears to be no large carbon enhancement.
In HE 0107−5240 and HE 1327−2326, very large enhancements of oxygen are also observed: [O/Fe] 3D = +2.0 (Bessell et al. 2004) and [O/Fe] 3D = +3.4 (Frebel et al. 2008), respectively. The available data for C, N, and O in these three stars, together with the abundances of the other elements, have played a critical role in attempts to constrain the nature of the type of object(s) that might have either enriched the gas clouds from which the UMP stars formed (see, e.g., Umeda & Nomoto 2003; Limongi et al. 2003; Iwamoto et al. 2005; Meynet et al. 2006; Tominaga et al. 2007; Nomoto et al. 2008; Joggerst et al. 2010) or which might have contaminated the surfaces of these stars (e.g., Shigeyama et al. 2003; Suda et al. 2004).
A basic aim of the present investigation is to ascertain the relative oxygen abundance, [O/Fe], of HE 0557−4840 in order to further constrain the efforts of Nomoto et al. (2008) and Joggerst et al. (2010) to better understand its origin.
That said, oxygen is an important element not only for constraining the origin of the peculiar abundances of the UMP stars. It also plays a potentially crucial role in understanding the physics of star formation processes at the earliest times when the Galaxy contained only a small amount of metals that could serve as cooling agents, enabling gas clouds to fragment and form low-mass stars (which have main-sequence lifetimes comparable to the age of the Galaxy). Following Bromm & Loeb (2003), Frebel et al. (2007a) introduced the transition discriminant Dtrans(= log(10[C/H] + 0.3 × 10[O/H])) to investigate the nature of the transition between the formation of massive Population III stars and low-mass Population II stars, based on the premise that cooling by fine-structure lines of C ii and O i leads to fragmentation of protoclouds, and the formation of long-lived low-mass stars in the early universe. They predict that no metal-poor stars should exist below the critical value D trans = −3.5 ± 0.2. The recent discovery by Caffau et al. (2011) of SDSS J102915+172927 with [Fe/H] = −4.7, [C/Fe] 3D ⩽ +0.7, and D trans ⩽ −4.2 suggests that the Frebel et al. (2007a) hypothesis may not provide the only explanation for the formation of low-mass, long-lived, UMP stars. For alternative theories we refer the reader to Clark et al. (2011), Greif et al. (2011), Schneider et al. (2012), and references therein. In the context of this new discovery, the question that now needs to be addressed is the fraction of carbon- and oxygen-enhanced stars at lowest [Fe/H].
It is clearly highly desirable to determine the oxygen abundance of HE 0557−4840. Unfortunately, the VLT/UVES spectra used in Paper I do not extend far enough into the ultraviolet (UV) wavelength region to allow a determination of the oxygen abundance of the star from OH lines at ∼3100–3200 Å. Additional spectra were therefore acquired with the same telescope/instrument combination during 2007 October and December, but with a wavelength setup including the UV OH lines. In the present paper we report the determination of the oxygen abundance of HE 0557−4840 based on these spectra, as well as an independent iron abundance derived from Fe i and Fe ii lines in the UV. We describe the observations and data reduction in Section 2, followed by the abundance analysis in Section 3. Our results and their implications are discussed in Section 4.
2. SPECTROGRAPHIC OBSERVATIONS AND DATA REDUCTION
HE 0557−4840 was observed with UVES in dichroic mode, using dichroic 2 and the BLUE346+RED760 standard setup. The projected slit width was 1'', yielding a nominal resolving power of R ∼ 40,000. The total exposure time of 4 hr was equally distributed over five exposures during 2007 October 15 and December 5 and 6 to facilitate the removal of cosmic ray hits. In the present work we shall discuss only the blue data, which cover the range 3050–3865 Å.
After determining the individual radial velocity shifts of the pipeline-reduced spectra by means of Gaussian profile fits to a carefully selected set of 13 unblended spectral absorption lines, the spectra were shifted to the rest frame. We note that HE 0557−4840 did not show any significant radial velocity variations during the observations in 2006 February and March (four nights; Paper I) or those in 2007 (three nights; this paper), or between the two investigations. The average barycentric radial velocity determined from the combined data set is 212.0 ± 0.4 km s−1.
The five spectra were coadded using an iterative procedure in which any residual traces of cosmic ray hits or CCD defects were removed by identifying them as outliers by means of κσ clipping. Zero weight was assigned to the affected CCD pixels of the relevant spectra in the last iteration of the computation of the weighted average of the individual exposures.
Since the scale of the UVES blue arm CCD is 0 215 pixel−1 and the slit width was 1'', the 1 × 1 binning of the CCD used during the observations yielded an oversampling with respect to the Nyquist criterion. The coadded spectra were therefore rebinned by a factor of two. The signal-to-noise ratio (S/N) of the coadded and rebinned spectra ranges from 5 pixel−1 at 3100 Å to about 80 at 3850 Å.
3. ANALYSIS
We have analyzed the ultraviolet spectrum of HE 0557−4840 to obtain abundances of C, N, O, and Fe, using the model-atmosphere techniques and atmospheric parameters described in Paper I, to which we refer the reader. We shall not repeat the details here, except for aspects relevant to the present investigation. Suffice it to say, we adopt the stellar atmosphere parameters T eff = 4900 K, log g = 2.2, and microturbulent velocity of ξmicr = 1.8 km s−1, together with the one-dimensional (1D), spherically symmetric MARCS model atmosphere employed in Paper I, and the assumption of local thermal equilibrium (LTE). For the analysis of individual Fe i and Fe ii lines, atomic data were taken from the Vienna Atomic Line Database (VALD6; Kupka et al. 1999, 2000), which was also the case for most of the atomic data for the spectrum synthesis line list we used in the analysis of CH, NH, and OH lines.
For CH and NH, we adopted line lists described in Paper I, from the work of B. Plez and A. Jorissen (2006, private communication) and Kurucz (2006), respectively. For OH, we used the line list of Bessell et al. (2004).
3.1. The Iron Abundance of HE 0557−4840
We measured the equivalent widths of 43 Fe i and 4 Fe ii lines in the UV spectrum of HE 0557−4840 and from them derived Fe abundances of  and
and  , respectively, where the quoted uncertainties refer to the standard error of the mean as estimated from the sets of abundance measurements.7 For the Fe ii lines we verified by spectrum synthesis calculations that the higher abundance is not due to blends. The results from Paper I, in comparison, are
  and
and  , respectively. The abundances of Fe i and Fe ii determined here thus differ by −0.06 ± 0.04 dex and +0.17 ± 0.24 dex, respectively, from the values published in Paper I (in the sense this work–Paper I). That is to say, the Fe abundances of the present work and Paper I essentially agree to within the measurement errors. We also note that in the Uppsala line formation code bsyn, version 7.05,8 that we used, the contribution of scattering to the source function is accurately taken into account. If, instead, scattering had been treated as absorption, the present abundances of Fe i and Fe ii would be higher by 0.1 dex and 0.13 dex, respectively. Given the higher quality (i.e., S/N) of the spectra in Paper I, in what follows we shall adopt the value of log
  (Fe) = 2.70 presented there, based on the Fe ii lines. We prefer this value rather than that determined from the Fe i lines because of its lower sensitivity to non-LTE effects (e.g., Asplund 2005; Mashonkina et al. 2010). We note that for the stellar parameters of HE 0557−4840, the non-LTE abundance corrections for Fe i lines with excitation potential greater than 2.5 eV are 0.3 dex, with lower excitation lines being more affected (Bergemann et al. 2011; Lind et al. 2012).
3.2. The Carbon, Nitrogen, and Oxygen Abundances of HE 0557−4840
3.2.1. Carbon
Since the S/N of our UV spectrum of HE 0557−4840 is too low to permit accurate analysis of individual CH lines, we employed the technique of multiple line coaddition, following the procedure described by Frebel et al. (2007b), for the determination of the oxygen abundance of HE 1300+0157 and HE 1327−2326. First, the continuum was determined around 13 weak CH lines in relatively unblended regions of synthetic spectra, chosen to have line strengths of ∼20–50 mÅ, in the wavelength range 3104–3190 Å. Spectral windows having a width of 0.5 Å around these lines were shifted to zero wavelength, and coadded. The resulting feature was then compared with similarly coadded synthetic spectra for a series of adopted carbon abundances. The best fit was achieved for log (C) = 5.3 ± 0.2 (internal fitting error), in excellent agreement with the result published in Paper I. In addition, we determined the carbon abundance of HE 0557−4840 by fitting the band head of the C2Σ+–X2Π system of CH at ∼3144 Å from which we determine log (C) = 5.5 ± 0.2. We average the two estimates to obtain log (C) = 5.4 ± 0.1 as the result of the present UV-based analysis.
As noted above, we adopt the Fe ii abundance of Paper I (i.e.,  ) as the iron abundance ([Fe/H]) for HE 0557−4840. The above C abundance, together with the solar photospheric abundances of Asplund et al. (2009), then leads to
 ![$\mathrm{[C/Fe]_{\rm 1D}}=+1.77\pm 0.1$](https://content.cld.iop.org/journals/0004-637X/753/2/150/revision1/apj431866ieqn6.gif) (internal error). For comparison, the analysis of Paper I, based on CH features at ∼4300 Å, together with the same solar abundance, yields
(internal error). For comparison, the analysis of Paper I, based on CH features at ∼4300 Å, together with the same solar abundance, yields ![$\mathrm{[C/Fe]_{\rm 1D}}=+1.66$](https://content.cld.iop.org/journals/0004-637X/753/2/150/revision1/apj431866ieqn7.gif) . We average these two values to obtain our adopted C abundance of
. We average these two values to obtain our adopted C abundance of ![$\mathrm{[C/Fe]_{\rm 1D}}=+1.7\pm 0.1$](https://content.cld.iop.org/journals/0004-637X/753/2/150/revision1/apj431866ieqn8.gif) (internal error).
(internal error).
3.2.2. Nitrogen
In Paper I we reported an upper limit for the nitrogen abundance of HE 0557−4840 of log (N) < 4.5, based on the absence of the A3Πi–X3Σ− system of NH at ∼3360 Å in the VLT/UVES spectrum obtained in 2006, which had S/N = 20 pixel−1 at 3360 Å. We combined the results obtained from that spectrum with the data obtained in the present work, which increased the S/N to ∼60. In spite of the considerably increased S/N, we still do not detect the NH band head, as may be seen in Figure 1, where we compare the observed spectrum with synthetic spectra for a range in nitrogen abundances. We adopt an improved upper limit for the N abundance of log (N) < 4.0 ± 0.2, corresponding to ![$\mathrm{[N/Fe]_{\rm 1D}<+1.0}\pm 0.2$](https://content.cld.iop.org/journals/0004-637X/753/2/150/revision1/apj431866ieqn9.gif) (internal error).
(internal error).

Figure 1. Comparison of the combined VLT/UVES spectra observed in 2006 and 2007 with synthetic spectra for nitrogen abundances of log (N) = −9.99 (i.e., no nitrogen), 3.5, 4.0, and 4.5. We conservatively adopt log (N) < 4.0 as the upper limit for the nitrogen abundance of HE 0557−4840.
Download figure:
Standard image High-resolution image3.2.3. Oxygen
We now address the thrust of the present work—to determine the abundance of oxygen in HE 0557−4840. Figure 2 presents spectra of HE 0557−4840 and CD−38° 245 (for comparison purposes) in the wavelength range 3120–3150 Å. For the latter, the spectrum is that presented by Bessell et al. (2004). We also recall the parameters of CD−38° 245 from that work: T eff = 4900 K, log g = 2.0, [Fe/H] = −4.0, and [O/Fe] = +0.9, and note that these values of T eff and log g are similar to those of HE 0557−4840. From analysis of CH features near 4300 Å, Spite et al. (2005) report [C/Fe] < −0.33 for CD−38° 245, while from its UV CH features, M. Bessell et al. (2010, private communication) find [C/Fe] = −1.0. Also presented by the vertical lines in the figure are the positions of a number of the stronger OH lines. Comparison of the spectra of the two stars reveals the clear presence of OH in HE 0557−4840 in spite of its lower S/N. (In the spectrum of HE 0557−4840, the reader can also see the CH band head at ∼3144 Å discussed in Section 3.2.1.) To determine the oxygen abundance, we coadded 15 OH lines in the wavelength region 3107–3191 Å, carefully selected in the same manner as described above in Section 3.2.1 for the CH lines, to lie in relatively unblended regions, and having line strengths ∼20–50 mÅ on synthetic spectra. The comparison of this spectrum with similarly coadded 1D synthetic spectra is shown in Figure 3 and yields log (O) = 6.2 ± 0.3 (internal error) for the oxygen abundance of HE 0557−4840, corresponding to ![$\mathrm{[O/Fe]_{\rm 1D}}=+2.3\pm 0.3$](https://content.cld.iop.org/journals/0004-637X/753/2/150/revision1/apj431866ieqn10.gif) (internal error). Here the error estimate is based not only on Figure 3 but also on synthetic spectra to which noise was added, appropriate to the low S/N of the UV spectra. These demonstrated that one has to be concerned not only with the fitting of the line core but also of the "continuum" as well at the ∼0.04 level.
(internal error). Here the error estimate is based not only on Figure 3 but also on synthetic spectra to which noise was added, appropriate to the low S/N of the UV spectra. These demonstrated that one has to be concerned not only with the fitting of the line core but also of the "continuum" as well at the ∼0.04 level.
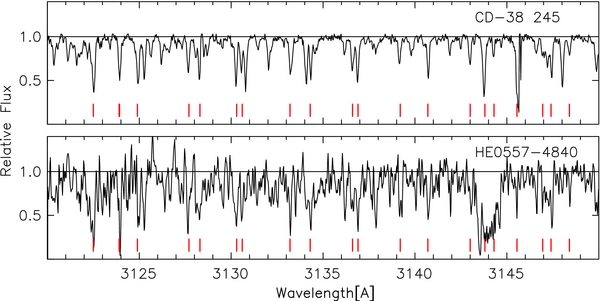
Figure 2. Ultraviolet spectra of HE 0557−4840 (from the present work) and CD−38° 245 (from Bessell et al. 2004), which have T eff/log g/[Fe/H]/[C/H] = 4900/2.2/−4.8/+1.7 and 4900/2.0/−4.0/−1.0, respectively (1D abundances). The vertical lines mark the positions of relatively strong OH lines, while the strong feature at ∼3144 Å in the spectrum of HE 0557−4840 is due to CH. See the text for discussion.
Download figure:
Standard image High-resolution image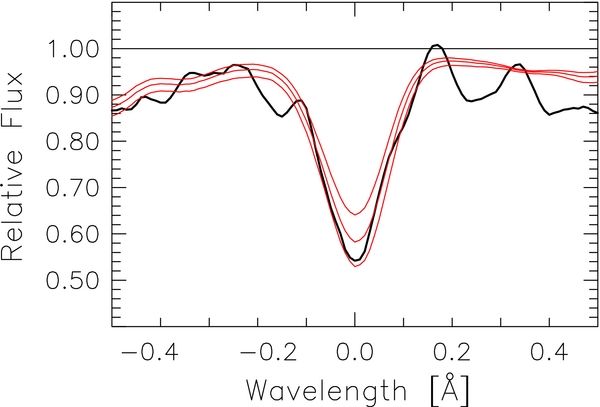
Figure 3. Fit of 15 coadded OH lines in the observed spectrum of HE 0557−4840 with synthetic spectra for oxygen abundances of log (O) = 5.8, 6.0, and 6.2 (best fit). See the text for discussion.
Download figure:
Standard image High-resolution imageOur UV-based 1D CNO abundances for HE 0557−4840 are summarized in Table 1. We note that each of the abundance ratios [C/Fe], [N/Fe], and [O/Fe] would be larger by ∼0.5 dex if the alternative set of stellar parameters discussed in Paper I (i.e., T eff = 5100 K, log g = 2.2) had been adopted. If we allow for a systematic error in T eff of 100 K (the main source of error in the atmospheric parameters) we then have ![$\mathrm{[O/Fe]_{\rm 1D}}=+2.3\pm 0.4$](https://content.cld.iop.org/journals/0004-637X/753/2/150/revision1/apj431866ieqn11.gif) . Details of the UV-based 1D abundances are presented in Columns 1–3 of Table 1, together in Column 4 with the adopted solar abundances of Asplund et al. (2009). Our adopted 1D abundances, taking into account the results for [C/Fe] from Paper I, are shown in Column 5.
. Details of the UV-based 1D abundances are presented in Columns 1–3 of Table 1, together in Column 4 with the adopted solar abundances of Asplund et al. (2009). Our adopted 1D abundances, taking into account the results for [C/Fe] from Paper I, are shown in Column 5.
Table 1. CNO Abundances of HE 0557−4840
| Species | log (X)1D |
σlog 1Da |
log (X)☉b |
[X/Fe]1Dc | 3D Corr.d | [X/Fe]3De |
|---|---|---|---|---|---|---|
| (UV Based) | (UV Based) | |||||
| (1) | (2) | (3) | (4) | (5) | (6) | (7) |
| C(CH) | 5.4 | 0.1 | 8.43 | +1.7f | −0.5 | +1.1 |
| N(NH) | <4.0 | 0.2 | 7.83 | < + 1.0 | ∼ − 0.8 | <+0.1 |
| O(OH) | 6.2 | 0.3 | 8.69 | +2.3 | −0.8 | +1.4 |
Notes.
aInternal (fitting) error.
bFrom Asplund et al. (2009).
c1D, adopting an Fe abundance of log (Fe) = 2.70 (see Section 3.1 and Paper I).
d3D Correction = log (X)3D–log (X)1D.
eIncludes 3D correction of +0.1 dex for [Fe/H].
fBased on [C/Fe] = +1.66 and +1.77 from Paper I and the present work, respectively (see Section 3.2.1).
Download table as: ASCIITypeset image
We estimate similar errors for our carbon and nitrogen abundances: our adopted values are ![$\mathrm{[C/Fe]_{\rm 1D}}=+1.7\pm 0.3$](https://content.cld.iop.org/journals/0004-637X/753/2/150/revision1/apj431866ieqn12.gif) and
and ![$\mathrm{[N/Fe]_{\rm 1D}}<+1.0\pm 0.3$](https://content.cld.iop.org/journals/0004-637X/753/2/150/revision1/apj431866ieqn13.gif) .
.
3.3. Model-atmosphere Consistency Check
The reader will note that our derived oxygen abundance, ![$\mathrm{[O/Fe]_{\rm 1D}}=+2.3\pm 0.4$](https://content.cld.iop.org/journals/0004-637X/753/2/150/revision1/apj431866ieqn14.gif) , is considerably larger than the value of 0.4 dex assumed in computing the model atmosphere adopted in the analysis, and may be concerned that this might have an effect on the abundances we obtain. To address this issue we computed a model with T eff/log g/[Fe/H] = 4900/2.2/−4.8, but having [O/Fe] = 2.1 (from a preliminary estimate of [O/Fe]), rather than 0.4. We found essentially no difference between the temperature structures of the two models (temperature differences less than ∼60 K) which lead to small abundance differences, e.g., Δlog (O) = −0.06 dex,
, is considerably larger than the value of 0.4 dex assumed in computing the model atmosphere adopted in the analysis, and may be concerned that this might have an effect on the abundances we obtain. To address this issue we computed a model with T eff/log g/[Fe/H] = 4900/2.2/−4.8, but having [O/Fe] = 2.1 (from a preliminary estimate of [O/Fe]), rather than 0.4. We found essentially no difference between the temperature structures of the two models (temperature differences less than ∼60 K) which lead to small abundance differences, e.g., Δlog (O) = −0.06 dex,  , and
, and  , that have no significant effect on the above results.
3.4. 3D Non-LTE Model-atmosphere CNO Corrections
The appropriateness of 1D hydrostatic model atmospheres, as used in the above analysis, becomes increasingly questionable toward lower metallicities (Asplund et al. 1999; Asplund 2005). The temperature structures of metal-poor 3D hydrodynamical model atmospheres are much cooler in the higher atmospheric layers due to the reduced radiative heating with a shortage of spectral lines, which translates to significant 3D effects for temperature-sensitive species such as molecules, both for dwarfs (Asplund & García Pérez 2001) and giants (Collet et al. 2006). Collet et al. (2007) found typical 3D abundance corrections of −1.0 dex for CH, NH, and OH lines at [Fe/H] = −3.
We have carried out 3D LTE spectral line formation calculations of the same CH and OH lines as in the above 1D analysis, using the 3D model of Collet et al. (2007) with T eff = 4856 K, log g = 2.2, and [Fe/H] = −3.0. While not exactly the same stellar parameters as we adopt here for HE 0557−4840, the differential 3D abundance corrections estimated from a comparison with a 1D MARCS model atmosphere with identical parameters are not very sensitive to the exact adopted values. If anything, our estimated 3D corrections are underestimated (by small amounts we expect to be ≲ 0.1–0.2 dex) since they become even more negative toward lower [Fe/H] (Collet et al. 2007). In order to reproduce the same line strengths, we find that the 3D analysis requires C and O abundances lower by 0.52 ± 0.03 and 0.85 ± 0.13 dex, respectively, compared with the 1D case. The corrections correlate closely with the lower excitation potential of the lines, with a stronger dependence for OH due to their greater temperature sensitivity. We note that these 3D abundance corrections are slightly different from those of Collet et al. (2007) due to the different adopted 1D C and O abundances and excitation potentials, which shift the height of line formation and thus the sensitivity to the altered temperature structure in the 3D hydrodynamical model atmospheres.
Another potential source of systematic error is the assumption of LTE for the line formation. Asplund & García Pérez (2001) made exploratory 1D non-LTE calculations using a very simplistic two-level OH model molecule and found significant non-LTE effects (Δlog() ∼ −0.2). Unfortunately, no detailed calculations for CH and OH with realistic molecular models exist and we therefore refrain from passing judgment on the possible degree of departures from LTE for our lines, but note that significant effects are not implausible, which would likely lower the derived C and O abundances further compared with the 3D LTE results.
Column 6 of Table 1 contains the present 3D corrections for C and O. We also include a 3D correction of −0.8 dex for N based on the analyses of Collet et al. (2006) (who obtain a correction of ∼ − 1.0 dex for model parameters T eff/log g/[Fe/H] = 5130/2.2/−3.0 using [X/H] values for HE 0107−5240 ([Fe/H] = −5.4) from Christlieb et al. 2004 and Bessell et al. 2004) and the result of Collet et al. (2007) (who report a value of −0.7 dex for 4858/2.2/−3.0). We expect our adopted value to be accurate to ∼0.2 dex, which suffices for the purposes of the present discussion. Column 7 of the table contains our final, 3D-corrected, abundances.
4. DISCUSSION AND CONCLUSIONS
Our analysis of the UV spectrum of HE 0557−4840 confirms that it falls within the previously advocated "gap" of the metallicity distribution function between the two stars currently known at [Fe/H] ≲ −5.0 and the stars at [Fe/H] ≳ − 4.0. This conclusion holds regardless of whether an effective temperature of T eff = 4900 K or 5100 K is adopted for HE 0557−4840, whether Fe i or Fe ii lines are used, or whether the UV or the (higher quality) optical spectrum is used. All [Fe/H] determinations yield values in the range −4.4 to −4.8, with combined measurement and systematic uncertainties not exceeding ±0.2 dex. We also confirm that HE 0557−4840 is strongly carbon-enhanced (![$\mathrm{[C/Fe]_{\rm 3D}}=+1.1 \pm 0.3$](https://content.cld.iop.org/journals/0004-637X/753/2/150/revision1/apj431866ieqn17.gif) ), a property it shares with the two stars currently known to have [Fe/H] ≲ −5.0. We also find that
), a property it shares with the two stars currently known to have [Fe/H] ≲ −5.0. We also find that ![$\mathrm{[O/Fe]_{\rm 3D}}=+1.4 \pm 0.4$](https://content.cld.iop.org/journals/0004-637X/753/2/150/revision1/apj431866ieqn18.gif) .
.
4.1. The Transition Discriminant, Dtrans
Our abundances lead to a value of the transition discriminant, Dtrans, defined by Frebel et al. (2007a; see our Section 1) for the transition from Population III to Population II stars, and the formation of low-mass, long-lived stars at the earliest times, of Dtrans(= log(10[C/H] + 0.3 × 10[O/H]) = −3.4 ± 0.2. Frebel et al. (2007a) predicted that if fine-structure transitions of C ii and O i were the predominant cooling mechanism in the early universe, no stars should exist with Dtrans < −3.5 ± 0.2. We conclude that the present result for HE 0557−4840 is consistent with this prediction (albeit with the value for HE 0557−4840 being close to the proposed limit). Three of the four stars known to have [Fe/H] ≲ −4.3 (HE 0107−5240, HE 1327−2326, and HE 0557−4840) are thus not only C-rich, but also O-rich, and are consistent with the Frebel et al. (2007a) hypothesis. Available abundances for the fourth star, SDSS J102915+172927, show no evidence for large carbon enhancement, and there is no information for oxygen. More data are clearly needed for this star, not to mention discovery of a larger number of UMP stars, in order to address the issue more rigorously. Suffice it here to say that if the existence of a class of C-normal, O-normal, UMP stars is supported by future similar discoveries, one will need to consider multiple channels for the production of stars having [Fe/H] ≲ −4.3.
4.2. Comparison with Model Predictions
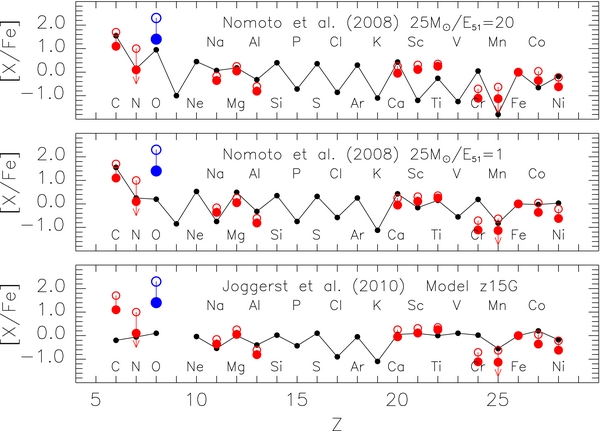
The oxygen abundance of HE 0557−4840 permits us to further test models that have been proposed for the objects that enriched the material from which this star formed. In Figure 4 we compare the predictions of supernova enrichment models of Nomoto et al. (2008, their Figure 5) and Joggerst et al. (2010, their Figure 9) with the observed relative abundances of HE 0557−4840. (Note that the oxygen abundance of HE 0557−4840 was unknown when these supernova models were developed.) In each of the three panels of the figure the open symbols present the 1D LTE abundances from Paper I, updated by the results for C, N, and O in Table 1 of the present work, while the filled symbols refer to the corresponding 3D LTE values. In the upper two panels the smallest, connected, points are the predictions of the "mixing and fallback" models of Nomoto et al. (2008) for high-energy (∼1052 erg) and low-energy (∼1051 erg) supernova explosions, as indicated in the two panels. The lowest panel presents the results of Joggerst et al. (2010) for their preferred z15G model (15 M☉, Z = 0 initial composition).
Figure 4. Comparison of the abundances of HE 0557−4840 with those of the ejecta of the models of Nomoto et al. (2008, their Figure 5) and Joggerst et al. (2010, their Figure 9). In each panel, the open circles refer to the 1D LTE abundances of HE 0557−4840 from Norris et al. (2007) and the present work, while the filled circles are the corresponding 3D LTE values. In the upper and middle panels the connected small symbols correspond to the Nomoto et al. models having 25 M☉, and explosion energies E51 = 20 and 1 (in units of 1051 erg), respectively. In the bottom panel, the line corresponds to the Joggerst et al. z15G model (15 M☉, with Z = 0 initial composition).
Download figure:
Standard image High-resolution image
Before proceeding, we note that we have made no correction to the abundances in Figure 4 for non-LTE effects. Sizeable 1D non-LTE corrections have been reported at low abundances (Fe/H] ∼−3) for some of the elements presented here: those relevant to the features observed in HE 0557−4840 are Na i (∼ − 0.4 dex, e.g., Lind et al. 2011), Al i (∼0.5 dex; Baumüller & Gehren 1997), and Mn i (∼0.6 dex; Bergemann & Gehren 2008). Concerning other species involved in the analysis of HE 0557−4840, we note for completeness that Bergemann & Cescutti (2010) determine non-LTE corrections of 0.3–0.5 dex from analysis of several Cr i lines, while Bergemann et al. (2010) report corrections as large as 0.6–0.8 dex for Co i. That said, in the context of HE 0557−4840, for which the spectral features are very weak, one should interpret these results with caution: for example, for Na i 5889.95 Å, which has an equivalent width of 15 mÅ, the non-LTE correction is in fact +0.05, rather than −0.4 dex as for saturated lines (Lind et al. 2011).
We first consider elements in Figure 4 with Z > 9. In general, the models perform well, except that all fail significantly to reproduce the abundance of Cr, with the model results being higher than that of HE 0557−4840 by ∼1.0 dex. Further, the Nomoto et al. 25 M☉, E51 = 20 (explosion energy in units of 1051 erg) model also fails to reproduce the abundances of Sc by 1.1 dex. In some contrast, the (low-energy) Nomoto et al. 25 M☉, E51 = 1 model and that of Joggerst et al. reproduce the observed Sc abundance well. (We note two points here for completeness. First, to our knowledge, no non-LTE corrections are available for Sc II at low [Fe/H]; and second, the results of Cayrel et al. (2004, their Figure 9) show that for metal-poor stars, [Sc/Fe] ∼0.0 for [Fe/H] ∼−4 to −2.) Considering then also the comparison of observation with theory for C, N, and O, one sees that the (high-energy) Nomoto et al. 25 M☉, E51 = 20 model reproduces the observations reasonably well, while neither of the others (i.e., the Nomoto et al. 25 M☉, E51 = 1, and the Joggerst et al. 2010 models) is consistent with the observed values: that is to say, there is a discrepancy of Δ[O/Fe] ∼ 1.5 dex in both of the lower two panels of Figure 4. We note that Joggerst et al. (2010) have reached a similar conclusion concerning carbon in HE 0557−4840: they state "the yield from one model, z15G, does fit the abundance pattern of ... HE 0557−4840 with the exception of carbon" (as may be seen in Figure 4 of this paper). We conclude that existing models fail to explain the current observations of HE 0557−4840, and suggest that further analysis is needed to explain this important object. Significant uncertainties still exist in the observational inference and the theoretical prediction of surface abundances of the most metal-poor stars. Efforts to lower the remaining uncertainties will undoubtedly sharpen our view of chemical evolution at the earliest times.
Studies at RSAA, ANU, of the most metal-poor stellar populations are supported by Australian Research Council grants DP0342613 and DP0663562, which J.E.N., M.S.B., and M.A. gratefully acknowledge. N.C. gratefully acknowledges financial support for this work through the Global Networks program of Universität Heidelberg and Sonderforschungsbereich SFB 881 "The Milky Way System" (subproject A4) of the German Research Foundation (DFG); A.J.K. from the Swedish National Space Board and the ESF EuroGENESIS network; and K.E. from the Swedish Research Council.
Facility: VLT:Kueyen (UVES) - Very Large Telescope (Kueyen)
Footnotes
- *
Based on observations collected at European Southern Observatory, Paranal, Chile (proposal 380.D-0040).
- 5
For element X, [X/H] = log(N(X)/N(H))⋆–log(N(X)/N(H))☉, log
(X) = log(N(X)/N(H))⋆ + 12.00. In this work, the cited [Fe/H] values refer to results from one-dimensional, LTE model-atmosphere analyses. - 6
- 7
For completeness, we recall from Norris et al. (2007) that systematic errors in the atmospheric parameters, most notably T eff, can result in systematic difference in the absolute abundance of 0.2 dex.
- 8
In Paper I we used bsyn, version 7.04. We note for completeness there are no differences in the abundances produced by the two versions.