


ABSTRACT
Oxygen charge states measured by in situ instrumentation have long been used as a powerful diagnostic of the solar corona and to discriminate between different solar wind regimes, both because they freeze in very close to the Sun, and because the oxygen element abundance is comparatively high, allowing for statistically relevant measures. Like oxygen, carbon is also rather abundant and freezes in very close to the Sun. Here, we show an analysis of carbon and oxygen ionic charge states. First, through auditory and Fourier analysis of in situ measurements of solar wind ion composition by ACE/SWICS we show that some carbon ion ratios are very sensitive to solar wind type, even more sensitive than the commonly used oxygen ion ratios. Then we study the evolution of the ionization states of carbon and oxygen by means of a freeze-in code, and find that carbon ions, commonly found in the solar wind, freeze in at comparable coronal distances, while oxygen ions evolve over a much larger range of coronal distances. Finally, we show that carbon and oxygen ion abundance ratios have similar sensitivity to the electron plasma temperature, but the carbon ratios are more robust against atomic physics uncertainties and a better indicator of the temperature of the solar wind source regions.
Export citation and abstract BibTeX RIS
1. INTRODUCTION
As solar wind plasma is accelerated from the solar atmosphere into the heliosphere, its density rapidly decreases, effectively shutting down ionization and recombination processes while it is still near the Sun. As a consequence, the plasma ionization state no longer adjusts to the thermal conditions of the expanding solar wind and freezes in. Thus, the solar wind ion composition retains important information about the physical properties of source plasmas in the near corona. These frozen-in ionic charge states have therefore become a very powerful tool for analyzing the physical properties of the solar wind in regions that are not yet accessible to in situ measurements or to remote sensing spectroscopy (Zurbuchen 2007 and references therein). Most importantly, these ionic charge data are powerful remote measures of the emerging solar wind in the corona, and its heating and acceleration processes.
For example, in situ measurements of ion abundances have been used to measure the temperature of coronal source regions of the wind (Bochsler et al. 1986; Geiss et al. 1995; Hefti et al. 2000; von Steiger et al. 2000; Gloeckler & Geiss 2007), as well as to discriminate between theoretical models of solar wind acceleration (Bürgi & Geiss 1986). More recently, Ko et al. (1997) combined Ulysses measurements of fast solar wind ion abundances with a theoretical model of ionization and recombination of solar wind plasma to infer the temperature profile of the lower solar corona; Chen et al. (2003) and Byhring et al. (2011) combined in situ measurements and solar wind models to study the presence of differential flows or abundance enhancements of heavy ions in the solar wind close to the Sun.
Since the freeze-in process takes place very close to the Sun, and the ion composition strongly depends on the solar wind regime (Geiss et al. 1995), ion abundance ratios are regularly used as proxies for different types of solar wind. In fact, a steady stream of fast solar wind, which is observed to emerge from coronal holes, gives rise to ionization states that are markedly cooler. On the other hand, ionization states in solar wind associated with closed magnetic field structures are both hotter and more variable. For example, Geiss et al. (1995) found that TO, determined from the O7 +/O6 + ratio under the assumption of local thermal equilibrium, was strongly anticorrelated with solar wind speed, suggesting that there are two very different solar wind regimes. These two solar wind types were also observed to exhibit important differences in Mg/O and other compositional parameters (von Steiger et al. 2000): coronal hole associated fast wind showed an elemental abundance that is nearly photospheric, whereas streamer associated slow wind showed elemental abundances that were observed to be fractionated according to their first ionization potential (FIP).
These compositional signatures have become important tools to link remote observations of the Sun to in situ solar wind measurements. In fact, high values of TO and Mg/O correspond to abundance ratios and larger temperatures, closer to streamer and quiet-Sun values determined spectroscopically and to slow wind velocities. Similarly, low values of TO and reduced Mg/O abundances, much closer to polar coronal hole spectroscopic measurements, are associated with fast wind velocities.
Oxygen is the most abundant element heavier than helium (von Steiger & Zurbuchen 2011), and its ionic charge states freeze in very close to the Sun. Thus, besides H+ and He2 +, oxygen is the most-used diagnostic for the composition of the solar wind. In particular, the O7 +/O6 + ratio was proposed as a tool to discriminate between solar wind types (Zurbuchen et al. 2000; Zurbuchen 2001) as well as theoretical models of solar wind acceleration (e.g., Bürgi & Geiss 1986); Zurbuchen et al. (2002) even proposed specific values of the O7 +/O6 + ratio to discriminate between fast wind (where O7 +/O6 + < 0.1), slow wind (0.1 < O7 +/O6 + < 1), and interplanetary coronal mass ejections (ICMEs; O7 +/O6 + > 1); such boundaries were further refined by Zhao et al. (2009).
Here we investigate the use of the carbon ion abundance ratios as proxies for solar wind type and as diagnostics of the temperature of the source regions of both slow and fast solar wind. As for oxygen, carbon ionization states freeze in very close to the Sun (Chen et al. 2003; Geiss et al. 1995), but unlike oxygen, carbon ions freeze in at distances that are comparable for all relevant C ions, providing a freeze-in point in a rather well-defined radial range. For example, Chen et al. (2003) predicted that C4 +, C5 +, and C6 + freeze in between 1.16 and 1.26 Rsun, compared with the 1.0–1.9 Rsun range predicted for O5 +, O6 +, and O7 +. Through a combination of auditory analysis of observed solar wind ion composition, atomic physics considerations, and theoretical modeling, we will show that carbon ion abundance ratios reproduce the values of the plasma where the wind accelerates with more fidelity, while retaining the same measurement accuracy and wind discriminating potential as the oxygen ions.
In Section 2 we discuss briefly the main features of carbon and oxygen in situ observations. We then describe auditory and Fourier analysis of the carbon and oxygen ion abundances in the solar wind measured by ACE/SWICS and Ulysses/SWICS in Section 3. The evolution of their ion composition in the solar wind predicted by a freeze-in code is described in Section 4, and the results are discussed in light of carbon and oxygen ionization and recombination rates in Section 5. Section 6 summarizes our results.
2. CARBON AND OXYGEN IN THE SOLAR WIND
Solar wind is composed predominately of protons and alpha particles, with very small additions of heavy elements. Oxygen is the most abundant heavy element with an approximate abundance of 1 part in 1900, compared to protons. The element abundance of carbon is approximately half that of oxygen (Grevesse & Sauval 1998; Grevesse et al. 2007). Furthermore, ions from these two elements are sufficiently well resolved from those of other elements in time-of-flight spectrometers such as SWICS on board Ulysses and ACE to provide reliable estimates under all solar wind conditions (Gloeckler et al. 1992). Figure 1 shows an example of measurements from the 2001 solar wind of carbon and oxygen ion charge states as a function of time of flight and energy from ACE/SWICS, for a specific energy per charge state channel (in logarithmic color scale): the peak and 1σ width of the distribution of each individual charge state (marked with a cross in the figure) can be easily identified and resolved from the nearby ions and elements. Thus, carbon ions can be measured with accuracy comparable to oxygen under virtually all conditions in the solar wind (see the Appendix of von Steiger & Zurbuchen 2011).

Figure 1. Ion charge state abundances measured by ACE/SWICS in 2001, as a function of time of flight and energy (the native measurement space for time-of-flight mass spectrometers), for a given energy per charge state channel. Colors are in log scale. Crosses indicate the expected positions and the 1σ width of each ion's distribution.
Download figure:
Standard image High-resolution imageThe most abundant observed carbon ions are C4 +, C5 + (He-like and H-like sequences), and C6 + (bare nucleus). The numerical abundances of these ions are comparable; for example, Ko et al. (1997) report fast wind abundances of 29%, 60%, and 11% for the three ions, respectively. Oxygen ions are, on the contrary, dominated by the He-like species, O6 +, which accounts for ≈90%–99% of the element under normal conditions (e.g., 97% in the fast wind according to Ko et al. 1997); the next-most-abundant ion, O7 +, is for example reported by Ko et al. (1997) to provide ≃ 3% of the total oxygen counts in fast solar wind.
This disparity in relative abundance of the ions of C and O, respectively, can be easily explained by inspecting the ion abundances as a function of log T predicted for these two elements under equilibrium conditions shown in Figure 2 (from Mazzotta et al. 1998). The two vertical red lines loosely mark the temperature range encompassed by solar plasmas of the upper solar atmosphere in coronal holes and quiet Sun where both fast and slow wind are expected to originate (Feldman & Landi 2008). The predicted abundances of all three carbon ions are comparable and exceed 10% in this entire range. On the contrary the He-like charge state O6 + is almost unity for most of the temperature range and O7 + reaches 10% only for log T ≃ 6.15. The predicted abundances of O5 + and O8 + are very low and thus sometimes difficult to detect in situ (Wimmer-Schweingruber et al. 1998).

Figure 2. Ion abundances as a function of temperature under ionization equilibrium, from Mazzotta et al. (1998). The range of typical temperatures in the inner solar corona are marked by the vertical dashed lines.
Download figure:
Standard image High-resolution imageFigure 2 leads to two important consequences. First, since both C and O freeze in very close to the Sun, even if their ion abundances evolve and depart from equilibrium before they freeze in, the plasma temperature of their source regions causes the initial ion distribution of these two elements to be approximately even for C4 +, 5 +, 6 +, and dominated by O6 + for oxygen. This explains qualitatively the observed in situ measurements discussed earlier. Second, the relative abundances of C6 + and C4 + are strongly affected by the electron temperature, so that the C6 +/C4 + ratio is very sensitive to the local electron temperature, in a similar way to the often used O7 +/O6 + ratio. However, the larger absolute values of the carbon ion abundances causes the C6 +/C4 + ratio predicted by equilibrium and non-equilibrium ion abundance calculations to be more accurate than the O7 +/O6 + ratio. In fact, Bryans et al. (2006) compared the ion fractions obtained under equilibrium assumptions using two different compilations of dielectronic and radiative recombination rates: they found a 10% agreement at the temperature of peak ion abundance, between 10% and 50% when the ion fractions were larger than 1%, and much worse than 50% below that threshold. As a consequence, under equilibrium ion abundance calculations are considered to be reliable when ion abundances exceed 1% of the peak abundance value. Thus, when ion abundance ratios are used to estimate the solar wind electron temperature, the low values of the predicted O5 + and O7 + ion abundances make the ratios involving these ions less reliable as temperature indicators than those involving the C ions.
3. MEASURED CARBON AND OXYGEN ION ABUNDANCES
3.1. Analysis over Several Solar Rotations
The C6 +/C4 + ratio was analyzed together with over 20 other ionic ratios using a novel audification process that identified C6 +/C4 + as the most promising measure for solar wind type. This audification process retrieves solar rotation signatures isomorphically mapping data into audio samples that are then available for acoustic analysis (for details, refer to Alexander et al. 2011). When the resulting sound file is played over speakers or headphones at a rate of 44,100 samples s−1, the original data are shifted into the range of human hearing. Upon repeated listening, pattern-recognition processes within the brain begin to enhance deeply embedded structural details within extremely noisy data (Kaernbach 1993).
C4 +, 5 +, 6 + data from ACE/SWICS were audified utilizing a simple algorithm in the programming language Max/MSP. While these audio files initially appeared to be quite noisy, close listening revealed an underlying "hum" with a frequency of 137.5 Hz in the data during times near the solar minimum of solar cycle 24. We compared this hum with the sound of a sinusoidal oscillator of adjustable frequency: modulating the frequency we found agreement for a frequency of 137.5 ± 1.0 Hz. Such a frequency translates to a 26.94 ± 0.20 day period within the original data, which corresponds to the synodic rotation period of the Sun, in excellent agreement with the mean equatorial synodic rotation rate estimated by Newton & Nunn (1951) using recurring sunspots. Auditory analysis quickly revealed overtones above this fundamental in the C6 +/C4 + ratio during solar minimum that were noticeably absent in C5 +. With a known fundamental of 26.9 days, the overtone series occurs with a periodicity of roughly 13.5, 9.0, and 6.7 days.
Figure 3 shows the power spectrum of three quantities routinely measured by ACE/SWICS as a function of time in the solar wind: solar wind velocity (measured as the bulk speed of He2 +), the C6 +/C4 + ratio, and the O7 +/O6 + ratio. The He2 + velocity, measured by SWICS, was compared with the H, C, and O velocities over the entire ACE lifetime and was found to be within a few percent of the velocity of the latter two elements. The period considered here extends from 2007 July to 2009 November, during a time when the monthly average sunspot number was not larger than 10 for any two months in a row. This time is well matched with the minimum of solar cycle 24. During this period of time, polar coronal holes were always present and rather stable, and thus the solar rotation determined the solar wind type observed by ACE, alternating it between fast and slow solar wind (see, Schwenn & Marsch 1990).
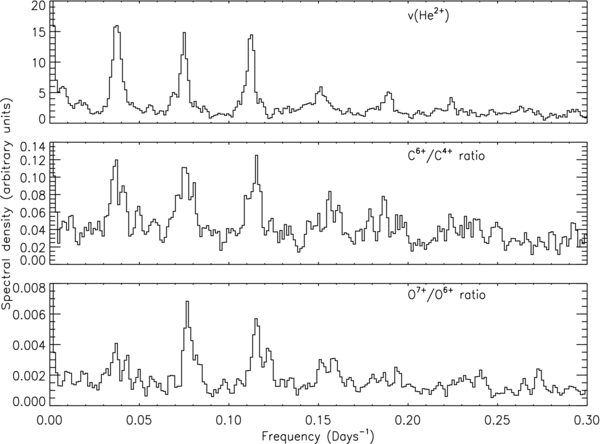
Figure 3. Fourier power spectrum of: the solar wind velocity (measured as the bulk speed of He2 +; top), the C6 +/C4 + ratio (middle), and the O7 +/O6 + ratio (bottom). Peaks correspond to the synodic solar rotation rate and its overtones.
Download figure:
Standard image High-resolution imageThe power spectrum of the He2 + speed clearly shows a few well-defined peaks consistent with the frequency of the solar rotation rate and its first five overtones, corresponding to a rotation rate of 27.5 ± 3.0 days. The uncertainty is taken as the FWHM of these peaks. After conversion to a sidereal rotation rate, this rotation can be compared to estimates made by Snodgrass & Ulrich (1990) and Newton & Nunn (1951). We found that it corresponds to the rotation rates of photospheric features rooted at latitudes lower than 45°. The middle and bottom panels show the power spectrum of the C6 +/C4 + and O7 +/O6 + ratio, respectively, and both show peaks corresponding to the same frequencies as He2 + speed, although they are somewhat broader; those corresponding to harmonics higher than 3 are buried in the noise. The C6 +/C4 + fundamental frequency indicates a slightly lower rotation rate (26.5 ± 4.1 days) than the O7 +/O6 + frequency (27.3 ± 5.2), but the differences are well within uncertainties; however, the frequencies of the O ratio overtones tend to be systematically larger than those of the C6 +/C4 + and He2 + speed. Also, the peak of the fundamental frequency is larger in the C6 +/C4 + power spectrum than in the O7 +/O6 + spectrum. If we interpret this periodicity as the effect of systematic changes in solar wind type and composition over the time period of many solar rotations, Figure 3 clearly indicates that the sensitivity of the C6 +/C4 + and O7 +/O6 + ratios is comparable, but that C6 +/C4 + is less noisy and better resolves rotation-dependent signatures.
3.2. Temperature Diagnostics
The temperature sensitivity of the C6 +/C4 + ratio under local thermal equilibrium conditions translates to a strong sensitivity to the solar wind type in a similar way to the O7 +/O6 + ratio, as previously discussed by Geiss et al. (1995), Neugebauer et al. (2002), and Gloeckler et al. (2003).
Figure 4 compares the variation of solar wind velocity with time during the minimum of solar cycle 24, for a six-month period starting in 2008 June (Figure 4), and the value of the freeze-in temperatures as measured from the O7 +/O6 + ratio (middle panel) and C6 +/C4 + ratio (bottom panel). The minimum phase of solar cycle 24 has been chosen to minimize the effect of solar activity such as CMEs, so that the differences between fast and slow solar wind streams are most obvious and clear. The freeze-in temperatures were determined assuming ionization equilibrium and comparing the ion abundance ratios measured by ACE/SWICS with the values provided by Mazzotta et al. (1998). For reference, the equatorial rotation rate by Snodgrass (converted to the synodic rate measured by ACE) is overplotted in vertical lines.
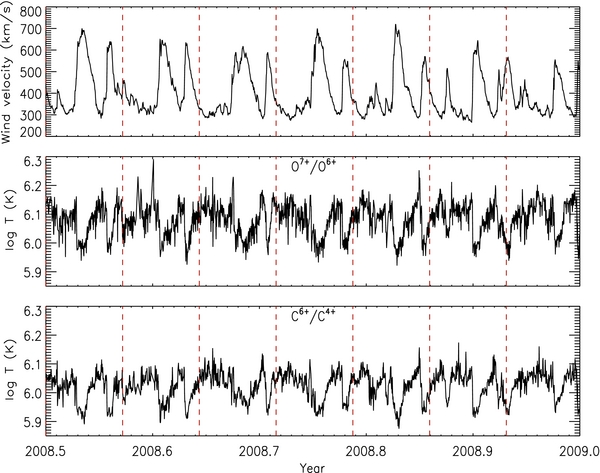
Figure 4. Velocity (top panel) and wind plasma temperature using the O7 +/O6 + ratio (middle panel) and C6 +/C4 + ratio (bottom panel) for the second half of 2008. The vertical dashed lines show the 26.23 days rotation period of the Sun.
Download figure:
Standard image High-resolution imageThe time series of solar wind velocities in Figure 4 show the presence of persistent coronal hole structures that generate periodic streams of fast wind with speeds exceeding 600 km s−1. Also, other small-duration streams presumably associated with isolated coronal holes at lower latitudes appear, whose speed rises sharply over the background values of ≃300 km s−1 but remains lower than fast wind values from coronal holes (e.g., at 2008.8). The fast streams correspond to a marked decrease in temperature from both ratios by about 0.15 dex. There are three things to be noticed in Figure 4. First, the temperatures of both ratios are strongly correlated with the wind velocity, and temperature changes are able to mark the presence even of rather small velocity enhancements, demonstrating the sensitivity of ion abundance ratios to solar wind types across a wide range of temperatures and scale size. This sensitivity is further demonstrated in Figure 5, where the normalized values of the wind velocity (black curve) and of the inverse of the temperature obtained with the C6 +/C4 + ratio (red curve) are shown. (It is to be noted that the 1/T curve was subtracted a constant amount before normalization, in order to better overlay it to the velocity curve: this explains why in a few places the resulting normalized curve is negative.) A similar behavior was already reported by Gloeckler et al. (2003) for O7 +/O6 +. Second, the C6 +/C4 + and O7 +/O6 + ratios result in different derived temperatures, the former being lower than the latter. As we will discuss later, this is due to the difference in the freeze-in history of these two elements as the wind plasma is accelerated outward. Third, the temperatures determined using the C6 +/C4 + ratio have a lower level of measurement noise than those obtained with the O7 +/O6 + ratio.
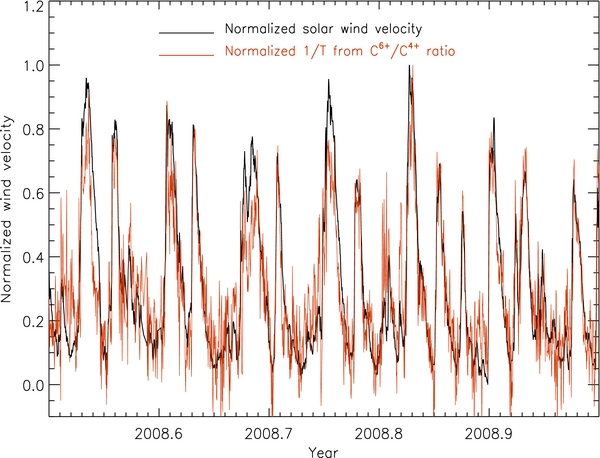
Figure 5. Comparison of the normalized wind velocity (black line) and normalized inverse temperature, calculated as 1/T, where T is the temperature determined from the C6 +/C4 + ratio assuming local thermal equilibrium. The 1/T curve was subtracted a constant arbitrary amount before normalization in order to better overlay it to the velocity curve—see the text for details.
Download figure:
Standard image High-resolution image4. PREDICTED CARBON AND OXYGEN ION ABUNDANCES
4.1. Ion Charge State Calculation
Ionic charge state observations at 1 AU can be predicted from local solar wind plasma parameters using a freeze-in code adapted from Gruesbeck et al. (2011). This code uses electron temperatures and densities, together with bulk velocities of the solar wind plasma and solves a continuity equation for all ions, taking into account ionization and recombination rates, as well as the solar wind expansion from the corona into the heliosphere. In Gruesbeck et al. (2011) this equation was solved in a Lagrangian formulation, but it is easily transferred into the nominal distance-dependent formulation used here.
The calculation is carried out using a fourth-order Runge–Kutta scheme, specifically suited to solve stiff sets of differential equations, characteristic of the wide range of variability of ionization and recombination rates for a given time step in the expansion. The numerical scheme uses an adaptive step size for improved computational efficiency. Ion-specific ionization and recombination rate coefficients are taken from Mazzotta et al. (1998), which are dependent on the local electron temperature. The code is used to predict the ionic charge states for all key elements measured by SWICS as a function of distance from the Sun to 1 AU, and allows direct comparison of them to observations from many solar wind composition experiments.
In the present work, we focus on the evolution of the ionic charge states of carbon (specifically C4 +, 5 +, 6 +) and oxygen (O5 +, 6 +, 7 +) in the solar wind. We use temperature, density, and velocity profiles from the solar wind model of Cranmer et al. (2007), as a self-consistent model of the photosphere, chromosphere, corona, and solar wind that is driven mainly by MHD turbulence, and provides the plasma properties along open magnetic flux tubes rooted in solar coronal holes, streamers, and active regions. The coronal hole density, temperature, and velocity profiles we use for our calculations are shown in Figure 6. However, the specific shape or assumptions of these profiles are only used to illustrate the behavior of the C and O ions and not to validate the Cranmer et al. (2007) model, since the former is much more generally valid than any specifically assumed solar wind model. All ionic charge states in question freeze in as the electron density decreases by approximately four orders of magnitude. Beyond this point, the solar wind can undergo tremendous dynamic evolution, but the ionic charge states do not change. Thus, our calculations were stopped at ≈15 Rsun, when all ionic species in the wind are frozen in.

Figure 6. Input theoretical model for the plasma temperature, density, and outflow speed of an open magnetic flux line in a coronal hole as a function of distance, from Cranmer et al. (2007).
Download figure:
Standard image High-resolution imageAt the base of this model the plasma is assumed to be in ionization equilibrium, at a temperature of T = 1.63 × 10⁵ K. Figure 2 shows that carbon is completely dominated by the He-like species (C4 +), while oxygen ion composition is a mixture of O2 +, 3 +, 4 +.
4.2. Results
First we focus on the freeze-in location of the most abundant carbon and oxygen charge states. The radial evolution of these ions is shown in Figure 7, which provides, as a function of distance, the ratio between the density of each ion to its frozen-in value SWICS would observe near Earth. Ratios of O5 +, 6 +, 7 + are shown by blue lines and those of C4 +, 5 +, 6 + are shown by red lines. The two horizontal black lines help indicate at what height each ratio is within 10% of the final frozen-in value; we will refer to this height as Rf. Figure 7 shows that the Rf values for carbon are closer to each other than those for oxygen: 1.24–1.62 Rsun for the former, 1.02–1.62 Rsun for the latter. Most notably, the dominant species of oxygen, O6 +, freezes in almost immediately, while the other two minor components reach 10% of the final value between 1.32 and 1.62 Rsun, in a substantially different thermal environment. This means that the final values of the charge states of oxygen will reflect the physical conditions of different regions along the path of the solar wind, while the carbon values experience a more similar evolution as the wind travels out of the Sun. In all cases, the final charge composition of C and O is set below two solar radii from the center of the Sun.
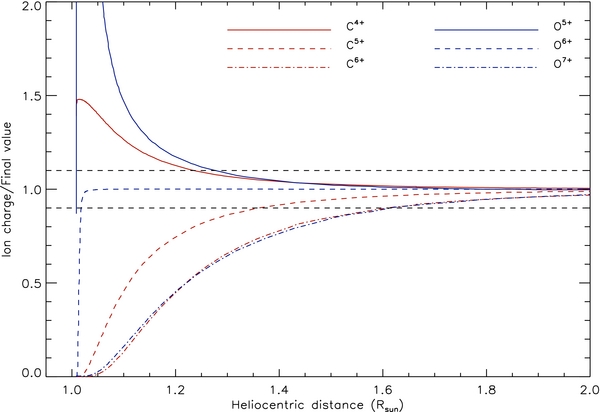
Figure 7. Ratio between the oxygen and carbon charge states predicted as a function of distance from the solar photosphere (at Rsun = 1.0) with their predicted frozen-in values.
Download figure:
Standard image High-resolution imageFigure 8 indicates the ratio of each ionic charge state to the value of its equilibrium condition at the local model temperature. This ratio indicates the extent to which a given ion is away from equilibrium and the responsiveness of each of the charge states to the local plasma conditions. First, Figure 8 shows that carbon ions are always out of equilibrium, departing immediately after the wind starts to accelerate. Also, it shows that carbon is too slow at ionizing to adjust to the hotter temperature, so that the abundance of C4 + is always larger than in equilibrium, while those of C5 +, 6 + never reach the equilibrium values.
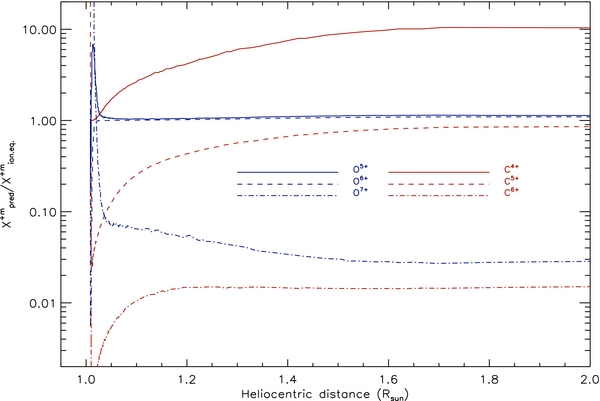
Figure 8. Ratio of the predicted oxygen and carbon charge states to their equilibrium values, calculated at the local temperature of the solar wind model.
Download figure:
Standard image High-resolution imageOn the contrary, O5 +, 6 + almost immediately reach equilibrium, and maintain it afterward. Such an equilibrium condition is, however, misleading. In fact, the O6 + ion abundance is predicted to be almost unity and nearly constant over a large range of electron temperatures (see Figure 2), which encompasses almost the entire temperature range of relevance for the coronal range of the model. In the case of O5 + the agreement is truly due to the greater sensitivity of the O5 + ion to the local plasma conditions, which will be discussed later. Third, the ion abundance of O7 + is always below the equilibrium value, for the same reason as C5 +, 6 +: the plasma speed is too large to let oxygen ionize fast enough to reach the equilibrium value for O7 +. Figure 8 shows that the reaction of the carbon ions to local plasma conditions is more homogeneous than that of the oxygen ions.
The ratios of the predicted ion abundances within each ion can be combined with values calculated under the assumption of ionization equilibrium, to determine the temperature at which each predicted charge state ratio is equal to the calculated equilibrium value. This method is commonly applied to determine temperature values from in situ measurements of ion abundance ratios. Here we apply it to the predicted ion abundance ratios at all heights. If the wind plasma was in equilibrium, all of these temperatures should be equal and identical to the electron temperature of the theoretical model. Figure 9 displays the values of the temperature obtained from all ratios within the same element, as a function of distance from the limb. It also displays the assumed model temperature for comparison purposes. In all cases, both carbon and oxygen yield lower temperatures than the local plasma temperature at any heights, with the exception of the O5 +/O6 + ratio, which is very similar to the temperature of the model until the freeze-in height. Figure 9 shows that despite being far from equilibrium, the temperatures provided by the carbon ions are very close to each other, as if this element was at equilibrium, though at a lower temperature than that of the local plasma. In contrast, oxygen charge states provide a much broader range of temperatures, depending on the particular ratio being used.

Figure 9. Temperatures measured comparing predicted ratios of oxygen and carbon charge states to their values at equilibrium, from Mazzotta et al. (1998).
Download figure:
Standard image High-resolution image5. IONIZATION AND RECOMBINATION RATES
The reasons for the different behavior of the carbon and oxygen ions can be understood if the ionization and recombination processes for these ions are considered. Figure 10 displays the inverse of ionization and recombination rates, defined as
where Ne is the electron density, here assumed to be 108 cm−3, typical of the innermost regions of the solar corona, and R indicates the ionization and recombination rate coefficients, taken from Mazzotta et al. (1998). O5 +, 6 +, 7 + and C4 +, 5 +, 6 + are displayed. The quantity τ can be taken as an indication of the time that occurs between two subsequent events whose rate coefficient is R; here we will refer to it as a recombination and ionization time. It is important to note that the curves displayed in Figure 10 scale inversely with the electron density, so that when the solar wind plasma leaves the Sun its electron density and values of τ change at the same rate.

Figure 10. Ionization and recombination times for carbon ions (left) and oxygen ions (right), calculated using the rates from Mazzotta et al. (1998) and assuming an electron density Ne = 108 cm−3.
Download figure:
Standard image High-resolution imageFigure 10 qualitatively explains the behavior of the C ions discussed above. First, in the log T = 5.9–6.2 range the values of τ for all carbon ions are approximately the same for both ionization and recombination. This means that as the plasma density decreases, the effectiveness of all the processes that alter the carbon ion composition decreases at approximately the same rate. As a consequence, all of these ions tend to freeze in close in time and radial distance in the corona. In contrast, oxygen ionization and recombination times are wildly different, so that it is expected that the ionization history of this ion will be less homogeneous.
The oxygen ion evolution is also heavily influenced by the fact that it is largely dominated by the O6 + charge state. In fact, by inspecting Figure 10 one would expect that O5 + freezes in later than O7 + since the O5 + ionization time is much shorter than the ionization or recombination times of O7 +. Still, Figure 7 shows the opposite. The reason for this is shown in Figures 11 and 12. These figures report the percent change to the population of a charge state given by each of the processes that influence it: ionization and recombination from that charge state, and into that charge state. The percent change P of the ion i can be calculated as
where Ri and Ci are the recombination and ionization from the charge state i, Ri + 1 and Ci − 1 are the recombination and ionization into charge state i, ne is the electron density, and ni − 1, ni, and ni + 1 are the number densities of the charge states i − 1, i, and i + 1. The red curves in Figures 11 and 12 are the cumulative percent changes for each charge state due to all of these processes combined.

Figure 11. Percent change of the population given by each ionization and recombination process for C4 +, 5 +, 6 +, as a function of distance from the Sun. The red line indicates the total percent change for the ion.
Download figure:
Standard image High-resolution image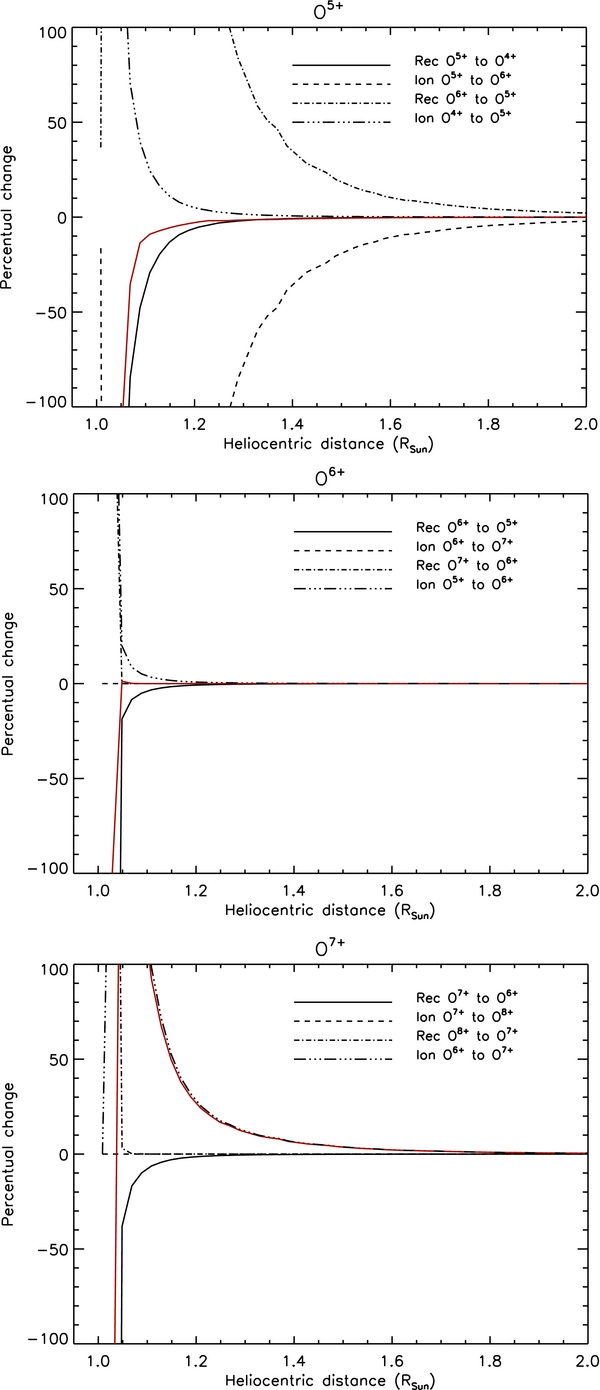
Figure 12. Percent change of the population given by each ionization and recombination process for O5 +, 6 +, 7 +, as a function of distance from the Sun. The red line indicates the total percent change for the ion.
Download figure:
Standard image High-resolution image
The processes affecting the carbon ionization states in Figure 11 are not a surprise: starting from an initial distribution of C4 + at the lower boundary, the evolution of C5 +, 6 + is largely dominated by ionization from the next-lowest charge state. Ionization dominates over recombination even if their times τ are approximately the same because the population of the ionizing charge state is much larger than the one being formed: there are far more ions ionizing into C5 + and C6 + than ions that recombine from them.
Figure 12 explains why O5 + and O7 + evolve in a different way from the one their rates suggest. In fact, ionization of O6 + into O7 + stops being an effective process almost half a solar radius earlier than O5 + ionization into O6 +, as expected from the τ values in Figure 10. However, recombination of O6 + into O5 + keeps replenishing O5 + at all heights, and counterbalances the former almost perfectly so that the density of O5 + stops changing sooner than O7 +. This is due to the fact that oxygen is completely dominated by the O6 + charge state, so that n(O6 +) ≫ n(O5 +) and compensates for the shorter ionization time of O5 +, as shown in Equation (2). This causes O5 + and O6 + to evolve as if they were in equilibrium with each other at the local electron temperature until at least 1.5–1.6 Rsun, even if O6 + is already at the final, frozen-in value at 1.02 Rsun. It is important to note that even if O6 + recombines enough to compensate for the ionization of O5 +, the change of its abundance is minimal already at 1.1 Rsun because the relative abundance of O6 + is so high that recombination only involves a tiny fraction of its ions. So, the apparent ionization equilibrium between O5 + and O6 + lasting up to 1.5–1.6 Rsun is actually misleading, as the latter ion is already frozen at 1.1 Rsun, while O5 + stops evolving only at around at least 1.8 Rsun, where each individual process affects its abundance by 5% or less. The evolution of O7 + is instead more similar to that of the carbon ions, being dominated by ionization, again because the population of O6 + is so large it more than compensates for the much longer time that ionization from O6 + to O7 + takes relative to the opposite recombination process.
Most importantly, the differences in the ionization and recombination times τ and the effectiveness of individual ionization and recombination processes cause oxygen ions to freeze in at different heights and to continue to evolve much longer than carbon ions, so that the oxygen relative abundances are altered from equilibrium values at the local temperature. Thus, the temperature provided by oxygen abundance ratios cannot be associated with any particular plasma.
6. SUMMARY
Carbon and oxygen ion abundances are an invaluable tool to study the physical properties of the regions in the corona where the solar wind accelerates, since their ionization and recombination times are just long enough to cause them to freeze in very close to the solar surface.
Also, the ions of these two elements can be measured easily and with accuracy with modern time-of-flight spectrometers. So far, the O7 +/O6 + ion abundance ratio has been suggested as a tool to discriminate between different solar wind types and as a diagnostic of the solar wind, under the assumption that the physical properties of the source regions vary sufficiently quickly that the acceleration profiles between fast and slow wind would be sufficiently different to make O7 +/O6 + a powerful diagnostic and discriminator for the different solar wind sources. While this power has been demonstrated in many ways and solar wind composition has become a standard tool for most plasma diagnostics relating solar wind to its coronal source, the present work suggests that the C6 +/C4 + ratio is a much more capable tool with significantly improved capabilities over the commonly used O charge ratios.
In particular, we have shown that carbon ions can also be excellent indicators of solar wind type, and that C6 +/C4 + has two significant advantages over the more commonly used oxygen ratio. First, carbon ions freeze much closer to each other in height and time than oxygen ions, so that their ratios provide temperature estimates more self-consistent and closer to the temperatures of coronal holes. Second, the carbon ion abundance values in typical fast and slow solar wind are close to unity, while those of O5 + and O7 + are usually less than 10% and often even less than 1% in typical solar wind. This means that the calculations of ion abundance under equilibrium normally used to estimate the plasma temperature from the in situ ion abundance measurements are significantly more accurate and statistically sound for the carbon ions than for the oxygen ions. Thus, the temperature measurements provided by carbon ion ratios, and particularly C6 +/C4 +, are more robust than those by oxygen ions. The C6 +/C4 + ratio also has the largest sensitivity to the electron temperatures, and auditory and Fourier transform analyses have shown that it has the same ability at discriminating solar wind type as the O7 +/O6 + ion abundance ratio. Since the total carbon element abundance is about half of the oxygen abundance, the advantages of using carbon ion ratios over oxygen ratios come at no expense to the accuracy of the measured ion abundance ratios.
The work of E.L. is supported by the NNX11AC20G and NNX10AM17G grants to the University of Michigan, and grant SV1-81002 to the Smithsonian Astrophysical Observatory. J.R.G. is supported by the GRSP program through grant NNX10AM41H. R.L.A. is supported by a grant from the University of Michigan Rackham Graduate School. J.A.G., T.H.Z., and S.T.L. are supported by NASA through contract NNX08AI11G and grants NNX07AB99G and NNX10AQ61G. The authors thank Deborah Eddy for improving the manuscript, Jonathan Thomas for his help with the ACE/SWICS data, and the anonymous referee for comments that helped improve and clarify the paper.