


ABSTRACT
Both grain surface and gas phase chemistry have been invoked to explain the disparate relative abundances of methyl formate and its structural isomers acetic acid and glycolaldehyde in the Sgr B2(N) star-forming region. While a network of grain surface chemistry involving radical–radical reactions during the warm-up phase of a hot core is the most chemically viable option proposed to date, neither qualitative nor quantitative agreement between modeling and observation has yet been obtained. In this study, we seek to test additional grain surface and gas phase processes to further investigate methyl formate-related chemistry by implementing several modifications to the Ohio State University gas/grain chemical network. We added two new gas phase chemical pathways leading to methyl formate, one involving an exothermic, barrierless reaction of protonated methanol with neutral formic acid; and one involving the reaction of protonated formic acid with neutral methanol to form both the cis and trans forms of protonated methyl formate. In addition to these gas phase processes, we have also investigated whether the relative product branching ratios for methanol photodissociation on grains influence the relative abundances of methyl formate and its structural isomers. We find that while the new gas phase formation pathways do not alter the relative abundances of methyl formate and its structural isomers, changes in the photodissociation branching ratios and adjustment of the overall timescale for warm-up can be used to explain their relative ratios in Sgr B2(N).
Export citation and abstract BibTeX RIS
1. INTRODUCTION
Interstellar grain surface chemistry was once thought to be limited to simple single-atom addition reactions in cold regions, and the dominant source of complex organic molecules (COMs)4 was assumed to be gas phase ion–molecule chemistry in warm regions (Herbst et al. 1977). Yet the highly abundant COM methyl formate (HCOOCH3) has posed several challenges to these basic assumptions. Gas phase reactions were shown to be inefficient at producing methyl formate under the conditions observed in star-forming regions (Horn et al. 2004). The disparate relative abundances of methyl formate and its C2H4O2 structural isomers in the Sgr B2(N) star-forming region (Snyder 2006) suggest more complex formation mechanisms than simple single-atom addition reactions on grain surfaces. Support for a grain surface formation mechanism is given by the detection of methyl formate in several cold regions where no significant gas phase chemical processing has occurred, including shocked regions in the Galactic Center (Requena-Torres et al. 2006), low-mass hot cores (Ceccarelli 2006), and cold envelopes around embedded protostars (Öberg et al. 2010).
Photolysis-driven grain surface chemistry was shown by Garrod et al. (2008, hereafter GWWH08) to efficiently form COMs such as methyl formate during the warm-up phase of a hot core. In this reaction network, cosmic-ray-induced photodissociation of simple molecules (i.e., CH3OH, H2CO, H2O, NH3) on grain surfaces produces a suite of small radicals. These radicals become mobile at temperatures >30 K and undergo combination reactions on the grain surface to form more complex species. Under this reaction scheme, the HCO, CH3, CH2OH, and CH3O radicals are the dominant sources of the organic functional groups that form oxygen-containing COMs. Reactions involving these organic radicals therefore ultimately lead to the structural isomerism observed in interstellar clouds.
All but one of these radicals (HCO) form primarily through the photodissociation of methanol on grain surfaces. Methanol photodissociation branching ratios therefore directly influence the production rates of COMs in interstellar clouds. The overall rate coefficient for methanol photodissociation used in GWWH08 is derived from gas phase laboratory measurements. However, the branching ratios that dictate the individual photodissociation channel reaction rates have not been directly measured in either the gas or condensed phases. Variations in the branching ratios could lead to significantly diverging grain surface chemistry. These branching ratios therefore might dictate the relative abundances of structural isomers such as methyl formate, acetic acid, and glycolaldehyde in interstellar clouds.
In addition to the proposed grain surface formation of methyl formate and its structural isomers, recent theoretical investigations of ion–molecule reactions involving methyl formate suggest that gas phase formation routes beyond those previously employed in astrochemical models may be plausible (J. Neill et al. 2011, in preparation). Methyl formate was long assumed to form from the Fischer esterification reaction involving protonated methanol (CH3OH+2) and neutral formic acid (HCOOH). Yet Freeman et al. (1978a) found that this reaction was not significant, and Horn et al. (2004) showed that other ion–molecule pathways leading to methyl formate have high barriers that lead to slow reaction rates in interstellar environments. However, both of these studies only investigated pathways leading to the cis stereoisomer of protonated methyl formate. While the cis conformer of neutral methyl formate is lower in energy than the trans conformer by 2880 K, the trans conformer of protonated methyl formate is lower in energy than the cis conformer by a similar value (J. Neill et al. 2011, in preparation). To date, the only conformers of methyl formate or protonated methyl formate (CH3OCOH+2) considered in astrochemical models are the cis stereoisomers. The energy barriers for interconversion between the cis and trans conformers of both species make conformer interconversion in interstellar environments unlikely. However, for the purpose of completeness in the chemical model, the viability of gas phase routes involving both stereoisomers should be examined.
Reinvestigation of the reactions considered by Horn et al. (2004) reveal that the Fischer esterification reaction involving protonated methanol (CH3OH+2) plus neutral formic acid (HCOOH) proceeds to trans-protonated methyl formate through an exothermic reaction with no barrier above the energy of the reactants (J. Neill et al. 2011, in preparation). The corresponding reaction leading to cis-protonated methyl formate has a barrier of 1320 K. In addition, the Fischer esterification reaction between protonated formic acid (HCOOH+2) and methanol (CH3OH) was discounted in the Horn et al. (2004) study because the proton-transfer reaction was more likely. Electronic structure calculations performed for this reaction indicate that it forms the cis conformer of protonated methyl formate with a reaction barrier of only 2810 K (J. Neill et al. 2011, in preparation). The corresponding reaction leading to trans-protonated methyl formate proceeds with a barrier of 3310 K. Despite these large barriers, and the fact that only a small percentage of protonated methyl formate is expected to form neutral methyl formate through electron recombination reactions, it is possible that the chemistry outlined above could still contribute to the interstellar formation of methyl formate.
It remains unclear whether grain surface chemistry governed by methanol photodissociation is the only viable mechanism for the formation of methyl formate and its structural isomers, or whether these other uninvestigated gas phase ion–molecule formation routes could also contribute significantly to their formation. The extent to which methanol photodissociation branching ratios influence the relative ratios of the structural isomers is also unexplored. We have therefore made several changes to the Ohio State University (OSU) gas/grain code used in GWWH08 to test the influence of these grain surface and gas phase routes on the production of methyl formate and its structural isomers. We have varied the methanol photodissociation branching ratios and tested their influence on the relative ratios of the structural isomers. We have also added trans-methyl formate and its associated reactions to the model. We then tested the relative contributions of the gas phase Fischer esterification reactions to the predicted abundance of methyl formate. Here we present the details of each of these changes to the chemical network and discuss their relative effects on COM chemistry, focusing our analysis on the predicted abundances of methyl formate and its structural isomers.
2. ASTROCHEMICAL MODEL
The gas/grain model used in GWWH08 was used for the present study, with a chemical network consisting of over 7500 reactions. A few minor corrections were made to the original reaction network used in GWWH08, and a test of these changes showed that their effects were negligible on all complex organic chemistry. The physical model employed was the same two-stage model used for the GWWH08 study. The first stage involves an isothermal collapse from a density of 3000 to 107 cm−3 at T = 10 K. The second stage is a gradual warm-up from T = 10 to 200 K following a second-order power law. Three warm-up timescales are used: low-mass star formation assuming t = 5 × 10⁴ yr, intermediate-mass star formation assuming t = 2 × 10⁵ yr, and high-mass star formation assuming t = 1 × 10⁶ yr. Using this model as our basis, we made each change to the chemical network separately, first testing the influence of methanol photodissociation branching ratios, then adding the new ion–molecule reactions to the gas phase network, and finally reinvestigating the effects of methanol photodissociation in light of the new gas phase chemistry. We outline each of these changes below.
2.1. Methanol Photodissociation Branching Ratios
In the GWWH08 study, the photodissociation pathways for methanol on grain surfaces include

In the GWWH08 study, the methanol photodissociation branching ratios for the above pathways were assumed to be 60:20:20 (1a:1b:1c) for all photodissociation processes; hereafter, we denote this set of branching ratios as the "standard" branching ratios.
In the current study, only the branching ratios for the cosmic-ray-induced photodissociation of methanol were altered, so that direct comparison could be made to the previous work. Four sets of methanol photodissociation branching ratios were used, and these trials are summarized in Table 1. The other sets of photodissociation branching ratios beyond the standard values were chosen to test the extreme cases for each specific product channel dominating the dissociation.
Table 1. Branching Ratios of Reaction 1 Used for Different Modeling Trials
| Percent Branching Ratios | Label Suffix |
|---|---|
| 1:2:3 (%) | |
| 60:20:20 | Standard |
| 90:5:5 | Methyl |
| 5:90:5 | Hydroxymethyl |
| 5:5:90 | Methoxy |
Download table as: ASCIITypeset image
Each entry in Table 1 was used for a corresponding set of gas phase reactions, grain surface reactions, or both. The labeling scheme used hereafter is as follows: label = prefix_ suffix_timescale, where prefixes are B (both grain surface and gas phase methanol photodissociation channels), S (grain surface methanol photodissociation channels only), G (gas phase methanol photodissociation channels only). Suffixes are listed in Table 1, and the timescale is either S (1 × 10⁶ yr), M (2 × 10⁵ yr), or F (5 × 10⁴ yr). In the cases where the sets contained altered methanol photodissociation branching ratios only for the grain surface or gas phase reaction sets, the default values for the unaltered reactions were set to the "standard" values. For example, the trial with methanol photodissociation branching ratios emphasizing the hydroxymethyl channel set to 90% on the grain surface (1a:1b:1c = 5:90:5) and tested at a medium warm-up timescale is labeled as "S_hydroxymethyl_M," and the gas phase methanol photodissociation branching ratios were set to 1a:1b:1c = 60:20:20.
2.2. Fischer Esterification Reactions Leading to trans-Methyl Formate
Pate and coworkers (J. Neill et al. 2011, in preparation) have suggested that Fischer esterification reactions between formic acid and methanol may be feasible gas phase formation routes for methyl formate. For this study, we tested two Fischer esterification mechanisms: the standard esterification mechanism with formic acid as the protonated reactant and a second esterification reaction with methanol as the protonated reactant. These two mechanisms and the steps taken to incorporate them into the model are described below.
2.2.1. Route 1: Protonated Formic Acid + Methanol
The Fischer esterification reaction between protonated formic acid and methanol (hereafter referred to as Route 1) leads to protonated methyl formate:

This reaction was added to the reaction network and classified as a gas phase ion–molecule reaction with the standard rate expression. Additional related reactions, including the proton transfer between methanol and formic acid, and a set of ion–neutral reactions involving formic acid, were also added to the network. The list of new reactions added to the network for Route 1 and the associated information for their rate coefficients are given in Table 2.
Table 2. Changes to the Reaction Network Based on Route 1
| Reactants | Products | Rate Coefficient Termsa | Reference | ||
|---|---|---|---|---|---|
| α | β | γ | |||
| HCOOH+2 + CH3OH | CH3OCOH+2 + H2O | 2.00 × 10⁻⁹ b | −0.5 | 2810 | 1 |
| CH3OH+2 + HCOOH | CH3OH + HCOOH+2 | 3.63 × 10⁻⁹ | −0.5 | 685 | 2 |
| HCOOH+2 + CH3OH | CH3OH+2 + HCOOH | 2.29 × 10⁻⁹ | −0.5 | 0 | 3 |
| CH+5 + HCOOH | HCOOH+2 + CH4 | 3.00 × 10⁻⁹ | −0.5 | 0 | 2 |
| H+3 + HCOOH | HCO+ + H2O + H2 | 3.90 × 10⁻⁹ | −0.5 | 0 | 2, 4 |
| He+ + HCOOH | HCO+ + OH + He | 9.00 × 10⁻¹⁰ | −0.5 | 0 | 4 |
| C+ + HCOOH | HCO+ + OH + C | 8.00 × 10⁻¹⁰ | −0.5 | 0 | 4 |
| N2H+ + HCOOH | HCOOH+2 + N2 | 1.70 × 10⁻⁹ | −0.5 | 0 | 2 |
| H2CN+ + HCOOH | HCOOH+2 + HCN | 1.40 × 10⁻⁹ | −0.5 | 0 | 2 |
| H3S+ + HCOOH | HCOOH+2 + H2S | 2.00 × 10⁻⁹ | −0.5 | 0 | 2 |
| H2COH+ + HCOOH | HCOOH+2 + H2CO | 2.00 × 10⁻⁹ | −0.5 | 0 | 2 |
Notes. ak(T) = α(T/300)βexp(−γ/T) cm3 s−1. bThe rate coefficient used here is identical with an estimate based on the Su-Chesnavich theory for reactions between ions and polar neutrals (Woon & Herbst 2009) in the temperature range 10–300 K. References. (1) J. Neill et al. 2011, in preparation; (2) Freeman et al. 1978a; (3) Feng & Lifshitz 1994; (4) Freeman et al. 1978b.
Download table as: ASCIITypeset image
In addition to the new gas phase formation reactions, additional modifications were made to the network for the dissociative recombination (DR) reactions of protonated formic acid. These changes were based on the recent DR study of protonated formic acid at CRYRING (Vigren et al. 2010). In the original network, the following DR reactions for protonated formic acid were present:


In the present study, Reaction 3 was replaced with

As is shown in Table 3, the DR reactions and their rate coefficients were changed to reflect the new CRYRING measurements.
Table 3. Protonated Formic Acid DR Reactions
| Reaction | Previous Rate Coefficient | New Rate Coefficient |
|---|---|---|
| (cm3 s−1) | (cm3 s−1) | |
| 3 | k(T) = 2.85 × 10⁻⁷(T/300)−0.5 | 0 |
| 4 | k(T) = 1.5 × 10⁻⁸(T/300)−0.5 | k(T) = 1.1 × 10⁻⁷(T/300)−0.78 |
| 5 | 0 | k(T) = 7.3 × 10⁻⁷(T/300)−0.78 |
Download table as: ASCIITypeset image
2.2.2. Route 2: Protonated Methanol + Formic Acid
A second esterification reaction leading to protonated methyl formate, this time involving protonated methanol and formic acid, was added to the network:

This pathway is hereafter referred to as Route 2. Here, the product can be either the cis or trans stereoisomer of protonated methyl formate. The pathway leading to the cis stereoisomer involves a 1320 K barrier, while the reaction leading to the trans stereoisomer does not have a barrier. These reactions were added to the network, where the α term in the rate coefficient expression was based on the experimental results of Freeman et al. (1978a), which gave a total rate coefficient of 3.7 × 10⁻¹⁰ cm3 s−1 at 300 K. In this study, the measurements focused on the proton-transfer reaction, rather than the formation of protonated methyl formate. The total rate coefficient determined for the proton-transfer reaction is higher than the values used in the model for other similar reactions. It is not clear from this study whether the protonated methyl formate channel could have contributed to the overall rate measured in this experiment, but it is possible if this value was determined by monitoring the reactants and the assumption was made that the proton-transfer reaction was the only reaction channel. Based on this fact, and the unusually high value for the proton-transfer reaction rate determined in this study, it is reasonable to assume that the protonated methyl formate formation channel may have contributed to the overall measured value of the rate coefficient. We therefore used the more typical value for the proton-transfer reaction rate coefficient of 1.9 × 10⁻¹⁰ cm3 s−1 and derived from this a total rate coefficient for Route 2 of 1.8 × 10⁻¹⁰ cm3 s−1. The rate coefficient information for the two esterification reactions leading to cis and trans protonated methyl formate via Route 2 is given in Table 4. An α value of 1.8 × 10⁻¹⁰ was used for both reactions involved in Route 2, based on the assumption that the two reactions would have equal α values. Here, the barrierless reaction leading to the trans conformer of protonated methyl formate dominates the total rate coefficient for this process.
Table 4. Changes to the Reaction Network Based on Route 2
| Reactants | Products | Rate Coefficient Termsa | ||
|---|---|---|---|---|
| α | β | γ | ||
| CH3OH+2 + HCOOH | cis-CH3OCOH+2 + H2O | 1.8 × 10⁻¹⁰ | −0.5 | 1320 |
| CH3OH+2 + HCOOH | trans-CH3OCOH+2 + H2O | 1.8 × 10⁻¹⁰ | −0.5 | 0 |
Note. ak(T) = α(T/300)βexp(−γ/T) cm3 s−1.
Download table as: ASCIITypeset image
2.3. Methyl Formate Stereoisomers
In addition to the new reactions outlined above, the reaction network was modified so that a distinction was made between the cis and trans stereoisomers of methyl formate and its protonated counterpart. The reaction energies of the stereoisomers are quite different in each case and can therefore lead to different chemical pathways. Structurally, the two stereoisomers of methyl formate differ in the orientation of the –CH3O group relative to the –CHO group, with the trans species being 2880 K higher in energy than the cis species (J. Neill et al. 2011, in preparation). The protonated versions of the cis and trans stereoisomers have similar structures to their neutral counterparts, but in this case the trans species is lower in energy by 2880 K. In the reaction network, the stereoisomers of both neutral and protonated methyl formate are distinguished as separate species, differing only in their label and their respective reaction rates. The overall chemistry was assumed to be the same for the two stereoisomers in each case. All reactions involving the neutral and protonated forms of methyl formate were duplicated so that a complete set of reactions was included for each stereoisomer. The gas phase reactions of each stereoisomer are shown in Table 5. Here, the α term in the rate coefficient expression for the cis conformer was used for the trans conformer. DR reactions leading to neutral methyl formate from protonated methyl formate were assumed to proceed with no conformational change (i.e., the structure of the ion is retained in the neutral product).
Table 5. Gas Phase Reactions Involving Methyl Formate or Protonated Methyl Formate
| Reactants | Products | Rate Coefficient Termsa | Reference | ||
|---|---|---|---|---|---|
| α | β | γ | |||
| CH3OH+2 + HCOOH | cis-CH3OCOH+2 + H2O | 1.8 × 10⁻¹⁰ | −0.5 | 1320 | 1 |
| CH3OH+2 + HCOOH | trans-CH3OCOH+2 + H2O | 1.8 × 10⁻¹⁰ | −0.5 | 0 | 1 |
| CH+3 + HCOOH | cis-CH3OCOH+2 | 1.0 × 10⁻¹¹ | −1.5 | 0 | 2 |
| CH+3 + HCOOH | trans-CH3OCOH+2 | 1.0 × 10⁻¹¹ | −1.5 | 0 | |
| cis-CH3OCOH+2 + e− | CH3OH + HCO | 1.43 × 10⁻⁷ | −0.5 | 0 | 3 |
| trans-CH3OCOH+2 + e− | CH3OH + HCO | 1.43 × 10⁻⁷ | −0.5 | 0 | |
| cis-CH3OCOH+2 + e− | cis-HCOOCH3 + H | 7.50 × 10⁻⁹ | −0.5 | 0 | 3 |
| trans-CH3OCOH+2 + e− | trans-HCOOCH3 + H | 7.50 × 10⁻⁹ | −0.5 | 0 | |
| HCOOH+2 + CH3OH | cis-CH3OCOH+2 + H2O | 2.00 × 10⁻⁹ | −0.5 | 2810 | 1 |
| HCOOH+2 + CH3OH | trans-CH3OCOH+2 + H2O | 2.00 × 10⁻⁹ | −0.5 | 3310 | 1 |
| cis-HCOOCH3 | HCO + CH3O | 5.00 × 10² | 0 | 0 | 3 |
| trans-HCOOCH3 | HCO + CH3O | 5.00 × 10² | 0 | 0 | |
| C+ + cis-HCOOCH3 | cis-HCOOCH+3 + C | 2.17 × 10⁻⁹ | −0.5 | 0 | 4 |
| C+ + trans-HCOOCH3 | trans-HCOOCH+3 + C | 2.17 × 10⁻⁹ | −0.5 | 0 | |
| H+ + cis-HCOOCH3 | cis-HCOOCH+3 + H | 6.90 × 10⁻⁹ | −0.5 | 0 | 4 |
| H+ + trans-HCOOCH3 | trans-HCOOCH+3 + H | 6.90 × 10⁻⁹ | −0.5 | 0 | |
| He+ + cis-HCOOCH3 | HCO+2 + CH3 + He | 3.54 × 10⁻⁹ | −0.5 | 0 | 4 |
| He+ + trans-HCOOCH3 | HCO+2 + CH3 + He | 3.54 × 10⁻⁹ | −0.5 | 0 | |
| H2COHOCH+2 + e− | cis-HCOOCH3 + H | 1.50 × 10⁻⁹ | −0.5 | 0 | 2 |
| H2COHOCH+2 + e− | trans-HCOOCH3 + H | 1.50 × 10⁻⁹ | −0.5 | 0 | |
| CH3OH2OCH+2 + e− | cis-HCOOCH3 + H2 + H | 1.50 × 10⁻⁹ | −0.5 | 0 | 2 |
| CH3OH2OCH+2 + e− | trans-HCOOCH3 + H2 + H | 1.50 × 10⁻⁹ | −0.5 | 0 | |
| cis-HCOOCH3 | CH3OCHO+ + e− | 2.00 × 10⁻¹⁰ | 0 | 2.5 | 3 |
| trans-HCOOCH3 | CH3OCHO+ + e− | 2.00 × 10⁻¹⁰ | 0 | 2.5 | |
| cis-HCOOCH3 | HCO + CH3O | 5.00 × 10⁻¹⁰ | 0 | 1.7 | 3 |
| trans-HCOOCH3 | HCO + CH3O | 5.00 × 10⁻¹⁰ | 0 | 1.7 | |
| H+3 + cis-HCOOCH3 | cis-CH3OCOH+2 + H2 | 4.05 × 10⁻⁹ | −0.5 | 0 | 4 |
| H+3 + trans-HCOOCH3 | trans-CH3OCOH+2 + H2 | 4.05 × 10⁻⁹ | −0.5 | 0 | |
| H3O+ + cis-HCOOCH3 | cis-CH3OCOH+2 + H2O | 1.81 × 10⁻⁹ | −0.5 | 0 | 4 |
| H3O+ + trans-HCOOCH3 | trans-CH3OCOH+2 + H2O | 1.81 × 10⁻⁹ | −0.5 | 0 | |
| HCO+ + cis-HCOOCH3 | cis-CH3OCOH+2 + CO | 1.55 × 10⁻⁹ | −0.5 | 0 | 4 |
| HCO+ + trans-HCOOCH3 | trans-CH3OCOH+2 + CO | 1.55 × 10⁻⁹ | −0.5 | 0 | |
Notes. aFor ion–molecule reactions, k(T) = α(T/300)βexp(−γ/T) cm3 s−1. For cosmic-ray-induced photodissociation reactions, k = αζ s−1, where ζ is the cosmic-ray ionization rate. For direct photodissociation reactions, k = α exp(−γAv) s−1. References. (1) J. Neill et al. 2011, in preparation; (2) Garrod & Herbst 2006; (3) Garrod et al. 2008; (4) taken from the OSU gas phase network.
Download table as: ASCIITypeset image
Only one form of methyl formate was included in the list of grain surface species, and this molecule was not distinguished as either cis or trans. However, for reactions on surfaces that produce gas phase methyl formate, the reaction was duplicated in the same manner as the gas phase reactions so that both stereoisomers could be included. The rates for those reactions involving the trans stereoisomer were scaled using a Boltzmann factor based on the energy difference between the two stereoisomers and assuming a temperature of 50 K. This temperature was selected because GWWH08 showed that the heavy radicals involved in these reactions become mobile on the grain surface and react in the 30–70 K temperature range. As is shown in Table 6, the values of the α term in the rate coefficient expression for the grain surface reactions involving the gas phase trans species were therefore scaled by 10−25 (i.e., e−(2880 K/50 K)) with respect to the reactions involving the gas phase cis species. Only grain surface reactions that involved one gas phase molecule were included in the model, following the convention used in previous modeling studies (Garrod et al. 2007).
Table 6. Grain Surface Reactions Producing Gas Phase Methyl Formatea
| Reactants | Products | Scaling for the Rate Coefficient Term α |
|---|---|---|
| JH + JCH3OCO | cis-HCOOCH3 | 1.00 |
| JH + JCH3OCO | trans-HCOOCH3 | 10−25 |
| JHCO + JCH3O | cis-HCOOCH3 | 1.00 |
| JHCO + JCH3O | trans-HCOOCH3 | 10−25 |
| JHCOOCH3 | cis-HCOOCH3 | 1.00 |
| JHCOOCH3 | trans-HCOOCH3 | 10−25 |
| cis-HCOOCH3 | JHCOOCH3 | 1.00 |
| trans-HCOOCH3 | JHCOOCH3 | 10−25 |
Note. aThe label J denotes a grain surface species.
Download table as: ASCIITypeset image
3. RESULTS AND DISCUSSION
3.1. Influence of Methanol Photodissociation Branching Ratios
The results of the trials where only methanol photodissociation branching ratios were modified are shown in Figures 1–3. For the sake of simplification, only molecules that have been identified in the Sgr B2(N-LMH) hot core source have been included. Figure 1 compares the peak abundances determined using the standard branching ratios from GWWH08 and those predicted using grain surface branching ratios that emphasize the methoxy (CH3O) channel. The slow warm-up timescale is shown for comparison in Figure 1, as this is the appropriate timescale for a high-mass hot core such as Sgr B2(N). Examination of Figure 1 reveals that the S_Methoxy_S trial gives a peak methyl formate abundance that is in better agreement with the observed abundance than the standard methanol photodissociation branching ratios used in GWWH08.
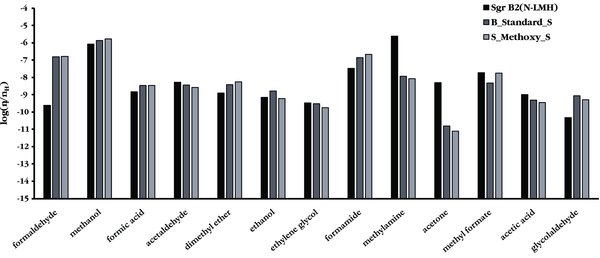
Figure 1. Peak abundances for a variety of interstellar species, comparing the observationally determined values for Sgr B2(N-LMH) (as referenced in GWWH08), the standard branching ratio values from the GWWH08 study (i.e., B_Standard_S), and the S_Methoxy_S branching ratios used in this work.
Download figure:
Standard image High-resolution image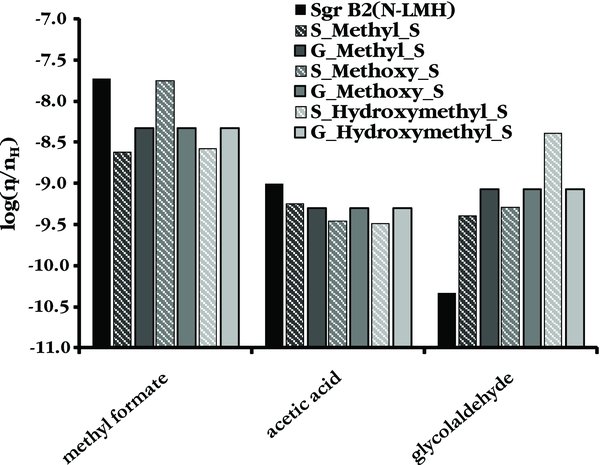
Figure 2. Peak abundances of methyl formate and its structural isomers for a warm-up time of 1 × 10⁶ yr.
Download figure:
Standard image High-resolution image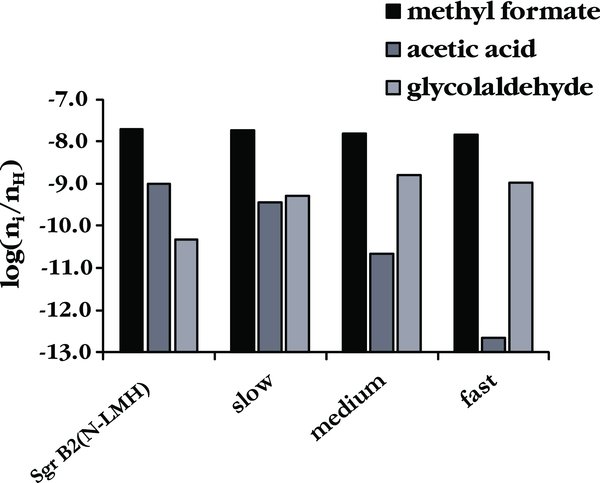
Figure 3. Peak abundances of methyl formate and its structural isomers, showing the timescale dependence predicted using the S_Methoxy branching ratios.
Download figure:
Standard image High-resolution imageAs is shown in more detail in Figure 2, the "Methoxy" branching ratios give the best match between observations and peak abundances for methyl formate, but both the acetic acid and glycolaldehyde peak abundances better match observations when the "Methyl" branching ratios are used. It should be noted here that the differences between these two trials for these two molecules are of the same magnitude as the estimated 20% uncertainty in the observational numbers. It is unclear from these results which set of branching ratios gives the best overall match to the relative abundances observed in Sgr B2(N). The set of branching ratios favoring the methoxy channel agrees qualitatively with gas phase laboratory measurements, which determined the overall branching fraction for the combined CH3O and CH2OH channels to be ∼0.75 (Hagege et al. 1968). To our knowledge, no gas phase or condensed phase laboratory measurements have yet distinguished between these two channels through direct measurements of the products. In contrast, neither set of branching ratios that gives a reasonable match to the Sgr B2(N) abundances agrees with the results of a recent laboratory study of methanol ice photodissociation, where the CH2OH channel was found to dominate the other two pathways (Öberg et al. 2009). Regardless, it is clear that an increase in the methanol photodissociation branching fraction that leads to the methoxy channel is required to explain the methyl formate abundance observed in Sgr B2(N).
Despite the agreement observed in the S_Methoxy_S trial for methyl formate, and reasonable agreement in this trial for acetic acid, the predicted peak abundance for glycolaldehyde in all trials is more than an order of magnitude higher than that observed in Sgr B2(N-LMH). Glycolaldehyde is known to be cold (<50 K) and extended (>60'') in this source (Hollis et al. 2004), unlike its structural isomers methyl formate and acetic acid, which are both compact hot core molecules (Snyder 2006). The peak abundance for glycolaldehyde occurs at a long timescale and high temperature in the model. If shocks released significant quantities of glycolaldehyde into the cold gas in the outer shells of the Sgr B2(N) hot core, then it is unrealistic to compare the peak gas phase abundance for glycolaldehyde in the model to the observed abundance. Direct comparison with the grain surface peak abundance is also not reasonable, because not all of the grain surface species would necessarily be released into the gas by the shock. Even if all grain surface glycolaldehyde was released by shocks into the gas phase, some fraction of the released glycolaldehyde would accrete back onto the grain at the lower temperatures of the outer envelope. Therefore, the only reasonable point of comparison is the T = 80–120 K range where significant evaporation of grain surface glycolaldehyde is occurring. Indeed, the glycolaldehyde fractional abundance of (2–4)×10−11 predicted by the model at T ∼ 100 K matches the value of 4 × 10⁻¹¹ observed in Sgr B2(N-LMH).
Looking beyond the influence of the grain surface photodissociation branching ratios, these trials reveal two other interesting trends. As is shown in Figure 2, the gas phase branching ratios have no influence on the peak abundances of COMs. This is to be expected, as the dominant formation mechanisms for these species are grain surface pathways. Additional examination of the results reveals that a change in warm-up timescale in addition to changes in the grain surface branching ratios can have a large influence on the peak abundances for COMs, as is illustrated by Figure 3. Fast warm-up timescales allow less time for grain surface chemistry, and so the more complex species are not formed efficiently under these conditions. This is especially true for a species such as acetic acid that forms from secondary radicals, as is evident in Figure 3. The longest warm-up timescale corresponds to the formation of a high-mass hot core, and indeed this timescale gives the best match to the observed Sgr B2(N-LMH) abundances. Longer warm-up timescales should result in more chemical complexity, in agreement with the rich molecular complexity observed in high-mass hot cores such as Sgr B2 and Orion.
3.2. Influence of New Gas Phase Formation Routes for Methyl Formate
The results of the trials including the new gas phase routes to form methyl formate (i.e., Routes 1 and 2) are shown in Figures 4 and 5. Figure 4 shows the peak abundances for COMs using both the B_Standard_S and the S_Methoxy_S branching ratios, both with and without the new gas phase reactions, compared to the abundances observed in Sgr B2(N-LMH). The inclusion of the new gas phase formation routes for methyl formate yields no change in the model predictions for the peak abundances for any trials.
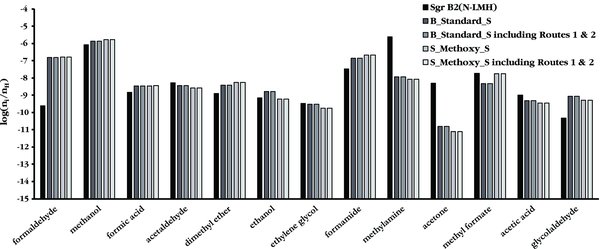
Figure 4. Peak abundances for a variety of interstellar species, comparing the observationally determined values for Sgr B2(N-LMH) (as referenced in GWWH08) to the B_Standard_S and S_Methoxy_S branching ratio trials both before and after the addition of Routes 1 and 2 to the network.
Download figure:
Standard image High-resolution image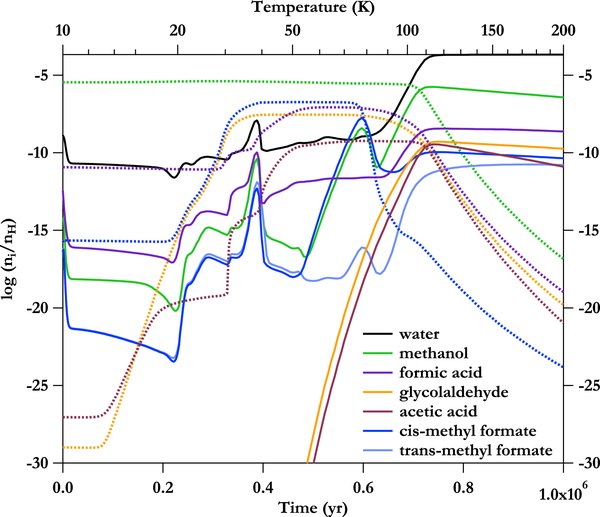
Figure 5. Time and temperature evolution of the C2H4O2 species and other highly abundant molecules for the S_Methoxy_S trial that incorporates Routes 1 and 2. The dotted lines show the evolution of the grain surface species, while the solid lines show the gas phase species.
Download figure:
Standard image High-resolution image
Detailed analysis indicates that no changes occur for the cis-methyl formate abundance when Routes 1 and 2 are included, regardless of temperature, although the results from trials including these new gas phase reactions do indicate that trans-methyl formate should be an abundant molecule in hot cores. The time evolution plot of Figure 5 reveals that at T < 55 K, gas phase trans-methyl formate is slightly higher in abundance than gas phase cis-methyl formate because it is formed in the gas via Route 2. In the range T = 55–100 K, cis-methyl formate is produced via grain surface chemistry, and this formation route dominates its formation over the new gas phase routes. The gas phase cis-methyl formate abundance peak occurs at T ∼ 80 K; at this temperature, the relative abundance ratio of cis/trans is 2.3 × 10⁸. Above T = 100 K, the grain surface production routes to methyl formate no longer contribute significantly to the cis-methyl formate gas phase abundance. The gas phase abundance of trans-methyl formate begins to rise dramatically at these higher temperatures because of its formation via Route 2, while the gas phase abundance of cis-methyl formate decreases gradually as it is destroyed through gas phase processes and is no longer replenished via grain surface chemistry. The two conformers begin to approach a similar gas phase abundance at higher temperatures and long timescales, and the relative abundance ratio of cis/trans is 2.67 at T = 200 K.
Although the peak abundances do not change when Routes 1 and 2 are included, small changes are observed in the time evolution plots for formic acid and acetic acid. These changes arise from the adjustment of the protonated formic acid DR rates reflected in Table 3. The formic acid abundance in the gas phase increases at temperatures below 100 K because the rate of its formation via Reaction 4 is increased over the rate used in GWWH08. This results in an increase in formic acid abundance on the grain (via accretion of the gas phase neutral) and acetic acid abundance in the gas (via its formation from formic acid in grain surface reactions and subsequent evaporation). No change is observed at T > 100 K between the two sets of trials (i.e., with and without Routes 1 and 2) for any species examined here other than trans-methyl formate.
The methyl formate stereoisomers can be used as a gauge of the validity of the gas phase chemistry examined in this model, as trans-methyl formate should be observable in the Sgr B2(N-LMH) source if it forms from the mechanisms included here. Its presence will also allow a test of the physical model assumed for comparison to Sgr B2, as the abundance ratios directly probe the temperature at which methyl formate is released from grains. The fractional abundance of cis-methyl formate in Sgr B2 is 1.9 × 10⁻⁸. The expected thermodynamic ratio between the two isomers is 10−25 (i.e., e−(2880 K/50 K)), but the model predicts the fractional abundance of trans-methyl formate to be 1 × 10⁻¹¹ at high temperatures (i.e., T > 100 K) and long timescales. The rotational spectrum of trans-methyl formate has now been recorded up to 26 GHz, and initial observational searches indicate its presence in Sgr B2 (J. Neill et al. 2011, in preparation). No quantitative information about its temperature or abundance is yet available. Additional higher frequency laboratory studies are required before its physical properties in a hot core can be probed.
In addition to using stereoisomers as probes of the chemistry and physics included in this model, the model now provides predictions for ion abundances that are based on a more realistic chemical network. Imaging observations that compare the distribution of these ions to their neutral counterparts could reveal their role in the chemical processing of material in hot cores. A direct spatial correlation between the ion and its neutral counterpart might indicate formation of the neutral species from the electron recombination reactions of its protonated counterpart. If an anti-correlation is observed, however, then the conclusion could be drawn that the neutral forms from grain chemistry, and is subsequently ionized in the gas phase after release from the grain. Regardless, these species hold great promise for unveiling the true chemical mechanisms leading to the formation and destruction of COMs in interstellar clouds. The peak abundances predicted for protonated methanol (2 × 10⁻¹¹) and protonated cis-methyl formate (8 × 10⁻¹¹) indicate that both of these ions should be observable in the Sgr B2 source. The predicted peak abundances for protonated formic acid (1 × 10⁻¹³) and protonated trans-methyl formate (6 × 10⁻¹⁴) indicate that detection of these ions will be observationally challenging.
4. CONCLUSIONS
Several modifications have been made to the gas/grain code of GWWH08 to explore the influence of additional grain surface and gas phase chemical pathways on methyl formate and its structural isomers acetic acid and glycolaldehyde. The following conclusions can be drawn from this study.
- 1.The methanol cosmic-ray-induced photodissociation branching ratios on grain surfaces do influence the peak abundances of the C2H4O2 isomers, but the gas phase methanol photodissociation branching ratios have no influence over the ultimate peak abundances for these species. The methanol photodissociation branching ratios that favor the methoxy radical channel most closely match observations for methyl formate. These branching ratios qualitatively agree with gas phase laboratory measurements. However, the branching ratios that favor the methyl channel give more reasonable matches to the observed acetic acid and glycolaldehyde abundances. Regardless, the set of branching ratios giving the worst agreement with the Sgr B2(N) abundances is that favoring the hydroxymethyl channel, which stands in contrast to the results from recent laboratory studies where this channel was shown to dominate methanol ice photodissociation. Additional laboratory studies that directly measure the branching ratios for each product are required to provide the quantitative information necessary for the modeling studies.
- 2.The warm-up timescale largely influences the chemistry of these species, and a combination of the grain surface methanol photodissociation branching ratios and warm-up timescale can be used to adjust the peak abundances to better match observations. However, it is difficult to accurately estimate the appropriate warm-up timescale and temperature evolution model to be used for any given source. Additionally, single-dish observations include the full source and probe everything from the warm, compact regions near the star to the cold, extended regions where little gas phase processing has occurred. It is therefore likely that the physical model assumed in this study is much too simple to allow more than single-temperature comparisons to observations. More sophisticated hydrodynamic models incorporating this chemistry are needed before more conclusions can be drawn as to the influence of the physics on the chemistry.
- 3.Addition of the Fischer esterification reactions and the trans stereoisomer of methyl formate does not change the predicted peak abundance for cis-methyl formate. From 55–100 K, cis-methyl formate is predominantly formed via grain surface chemistry. At higher temperatures, the reaction between protonated methanol and formic acid (Route 2) favors the production of trans-methyl formate. This indicates that trans- and cis-methyl formate may be spatially segregated and that the trans-conformer may be most abundant in the hot, compact region of the core. The gas phase reaction cycle leading to trans-methyl formate relies upon the dominant channel for the DR of protonated methyl formate to be the production of methanol, which leads to protonated methanol and drives the formation of trans-methyl formate via Route 2. Investigation of the DR process for protonated methyl formate would greatly aid in evaluating this proposed mechanism. Observational searches for trans-methyl formate would also be helpful in fully evaluating the accuracy of the chemical network used in the model.
- 4.Glycolaldehyde is overproduced by the model at high temperatures and long timescales when compared to its Sgr abundance. However, the abundance predicted by the model at T = 100 K more closely matches observations. Significant quantities of glycolaldehyde are being evaporated from the grain surface at this temperature in the model, and so this is a reasonable comparison point for the glycolaldehyde abundance in the outer envelope of the hot core, where shocks may have liberated it from the grains. Explicit, detailed models of shock chemistry are required to quantitatively explain extended shock-induced gas phase glycolaldehyde. Glycolaldehyde has only been detected in two sources, Sgr B2 (Hollis et al. 2000) and G31.41+0.31 (Beltrán et al. 2009), with the second detection offering no direct determination of its temperature or abundance. More observational studies of glycolaldehyde are required so that its chemistry can be fully investigated. If it is indeed a cold, extended molecule, then its observed abundance might be more directly tied to the grain surface abundance than its structural isomers, which are formed in or ejected into the hot gas. However, its absence from the warm hot core gas is puzzling, as it should be present in even higher abundance in these regions. Other gas phase destruction mechanisms may be required to explain glycolaldehyde's behavior in hot core sources.
- 5.These results point to a path forward for additional observational studies of methyl formate and its structural isomers. These three structural isomers must be observed in a variety of sources with varying physical conditions to allow direct comparison with the model predictions. If all three molecules indeed form primarily from grain surface chemistry, then acetic acid and glycolaldehyde should also be present in regions of grain mantle disruption where methyl formate has already been observed.
- 6.The predictions from this model indicate that the protonated forms of methanol and cis-methyl formate should be observable in high-mass hot cores. Observational studies that compare the spatial distributions of the ions to their neutral counterparts would offer clues to the dominant formation and destruction mechanisms for COMs in interstellar clouds. Laboratory and observational searches for these two ions are required before direct comparison with the model can be made.
Support for this work was provided in part by National Science Foundation Center for Chemical Innovation grant CHE-0847919. J.C.L. was also supported by S.L.W.W.'s startup funds, provided by Emory University. E.H. acknowledges the National Science Foundation for the support of his program in astrochemistry and NASA NAI for support of studies in the formation of pre-planetary matter. We thank Brooks Pate for his suggestions regarding the ion–molecule chemistry and fruitful discussions of interstellar COM chemistry in general. We thank George Hassel for his assistance with the gas/grain code. We also thank Karin Öberg for discussions concerning her experimental studies of methanol ice photodissociation.
Footnotes
- 4
Following the convention of Herbst & van Dishoeck (2009), we define a COM as one containing five or more atoms.