
ABSTRACT
AM CVn stars are the outcome of a fine-tuned binary star evolution pathway. They are helium-rich and their binary orbital periods are less than 65 minutes. They evolve through one or two common envelope (CE) events, which are difficult to model. Observations of AM CVn stars are important to understand the CE phase. Thanks to intensive observing campaigns, the number of AM CVn stars has increased from 5 to 25 during the last 15 yr. We have witnessed long photometric campaigns, time-resolved spectroscopy, UV and X-ray observations, and progress in modeling of the internal structure of donor and accretor stars, disk structure, disk atmosphere, and their evolution. Two possible new members of the AM CVn family have orbital periods of less than 10 minutes. For these, four different models have been proposed, including one without mass transfer, driven by electricity generated by the secondary star moving in the magnetic field of the primary. Short-period AM CVn stars are among the first possible detectable sources of low-frequency gravitational wave (GW) radiation. They are also possible progenitors of a Type Ia supernova (SN Ia) and subluminous explosions, and they can produce helium novae during their evolution. From systematic searches in the Sloan Digital Sky Survey, it has been possible to estimate population densities that can be tested against population synthesis models. One important question to investigate is the relative importance of the three proposed birth channels: a low-mass white dwarf donor, a helium-star donor, or a highly evolved cataclysmic variable (CV) as a donor. A review of the research on AM CVn stars covering the last 15 yr is given, and the outlook for future research is discussed.
Export citation and abstract BibTeX RIS
1. INTRODUCTION: AM CVNS ARE UNUSUAL STARS
The AM CVn stars are short-period binary stars in which a white dwarf accretes helium-rich material from a low-mass donor star. All, except two, do not show traces of hydrogen in their spectra. They have orbital periods ranging from 5 to 65 minutes and are also called ultra–short-period binaries, helium cataclysmic variables, or interacting binary white dwarfs. At optical wavelengths they appear as faint, blue, and variable objects. Several are found because of their helium-dominated emission-line spectra, but two possible members are found because of short-period X-ray variations. In this review, the designation of AM CVn stars will be used throughout.
A small fraction of binary systems experience one or two episodes of CE events, resulting in loss of angular momentum and spiraling into a closer orbit. The binary evolution toward ultrashort periods is driven by angular momentum loss due to GW radiation, as first proposed by Kraft et al. (1962). Initially, they are detached, but when the stars have evolved into semidetached contact by the GW emission, under certain conditions, as discussed in § 3, stable Roche lobe overflow (RLOF) is enabled and an AM CVn star is born. As long as GW emission dominates, the orbit will shrink, but when mass transfer dominates the evolution, the binary period will pass a minimum and then increase, while the mass transfer rate decreases.
During the later mass transfer stages an accretion disk typically develops, and the light from the disk dominates the optical spectrum. We observe many similar disk phenomena, as for ordinary hydrogen-rich CVs. When the accretion rate has become very small, the disk is reduced in size, and the white dwarf may be detected in the spectrum. The AM CVn star will end as a cold DB white dwarf with a substellar object as a planet or a brown dwarf in a close orbit.
There are three possible channels for donor evolution: The first is RLOF between two white dwarfs, where the donor star is the smallest and helium-rich (Paczyński 1967; Faulkner et al. 1972). The second possibility is accretion from a low-mass nondegenerate helium donor (Savonije et al. 1986; Iben & Tutukov 1987). In both cases the period decreases before period minimum and then increases. The time interval of decreasing period is short. The two stars with shortest periods (HM Cnc and V407 Vul), discussed in § 4.2, may be in this stage. Finally, the donor may be the remnant of a low-mass main-sequence star that has lost most of its hydrogen as an ordinary CV (Tutukov et al. 1985; Podsiadlowski et al. 2003). This channel is less probable.
At the moment, 25 stars are classified as AM CVn stars, 13 of which were found by systematic searches in the Sloan Digital Sky Survey, allowing for an assessment of selection effects and space density calculations. These can thus be compared with estimates from population studies.
The importance of the AM CVn population is that it represents the terminal phase of a finely tuned binary star evolution. This provides an opportunity to calibrate models for binary star evolution. Because of the compactness of the systems, and their deficiency of hydrogen, they represent a laboratory for the study of physics under extreme conditions. The mass transfer process gives information of the interior of the donor and its evolutionary history. AM CVn stars will be among the first objects to be detected by the Laser Interferometer Space Antenna (LISA) gravity wave detector, and the brightest will serve as calibrators for this experiment (Nelemans et al. 2004).
A possible outcome of the evolution of AM CVn stars is explosive events, either as a supernova of Type Ia, or as a less energetic type of supernova named SN .Ia (Bildsten et al. 2007). The first such subluminous explosion observed may be SN 2005E (Perets et al. 2010). Another possibility is an edge-lit detonation, which will destroy the outer parts of the accreting star or tear it apart (Livne & Glasner 1991; Woosley & Weaver 1994). During its evolution before period minimum, it may also show repeated nova events. The first observed helium nova (V445 Puppis) had an outburst between 2000 September and November. Observers are still waiting for the debris to clear to get a glimpse of the underlying binary, which may be related to AM CVn stars, or for it to explode as a SN Ia (Woudt et al. 2009).
In the following I shall attempt to provide a review of the status of the research on AM CVn stars, to supplement earlier short reviews by Ramsay et al. (2007a), Nelemans (2005), and Solheim (2003) and the more extensive review by Warner (1995). After starting with a presentation of basic data for the 25 investigated stars (§ 2), I will then move on to explain the three possible channels of evolution (§ 3). After discussing in more detail some recent observations and interpretations (§ 4), I shall arrive at some final conclusions and challenges for future research (§ 5).
2. GENERAL PROPERTIES: BASIC OBSERVATIONS
The variable star AM Canum Venaticorum was first recognized as a blue star (Malmquist 1936) and became HZ 29 in a survey of faint blue objects by Humason & Zwicky (1947). Its spectrum showed peculiar broad and shallow helium absorption lines, but no hydrogen (Greenstein & Mattews 1957), and it was classified as a DBp white dwarf. Smak (1967) discovered variability on a very low level (∼0.04 mag) displaying a double-humped light curve of period ∼18 minutes. Pioneering high-speed photometry by Ostriker & Hesser (1968) gave P = 1051.118 ± 0.015 s and an amplitude A = 0.01 mag. Paczyński (1967) interpreted this as an example of a binary whose evolution is governed by GW emission, and as a laboratory for testing the theory of general relativity. Faulkner et al. (1972) proposed a model with a degenerate helium white dwarf secondary of mass ∼0.041 M⊙. They also suggested the possibility of a helium-star donor. While binarity was assumed early on, it took 34 yr before the orbital period of 1028.7 s was finally confirmed by Nelemans et al. (2001b) (see § 4.5).
The number of AM CVn stars has increased very slowly. In 1993 only six were known (Warner 1995). Ten years later 12 were known, and by now 25 have been proposed as AM CVn stars. The increase of objects since 2005 is principally due to the Sloan Digital Sky Survey (SDSS), but the truth is that they are very difficult to find. One million spectra have been investigated in the SDSS (Anderson et al. 2008), so there is no doubt that this is a very exclusive family of stars.
Table 1 gives the basic data for the population, with references to the discovery papers, and the most recent determination of basic parameters. The distances are either from trigonometric parallax (with quoted errors) with the Hubble Fine Guidance Sensors (Roelofs et al. 2007b) or are ground-based (Thorstensen 2003; Thorstensen et al. 2008). Some distances are estimated based on secondary methods such as disk or accreting-star atmosphere models or on tertiary methods based on standard candles.
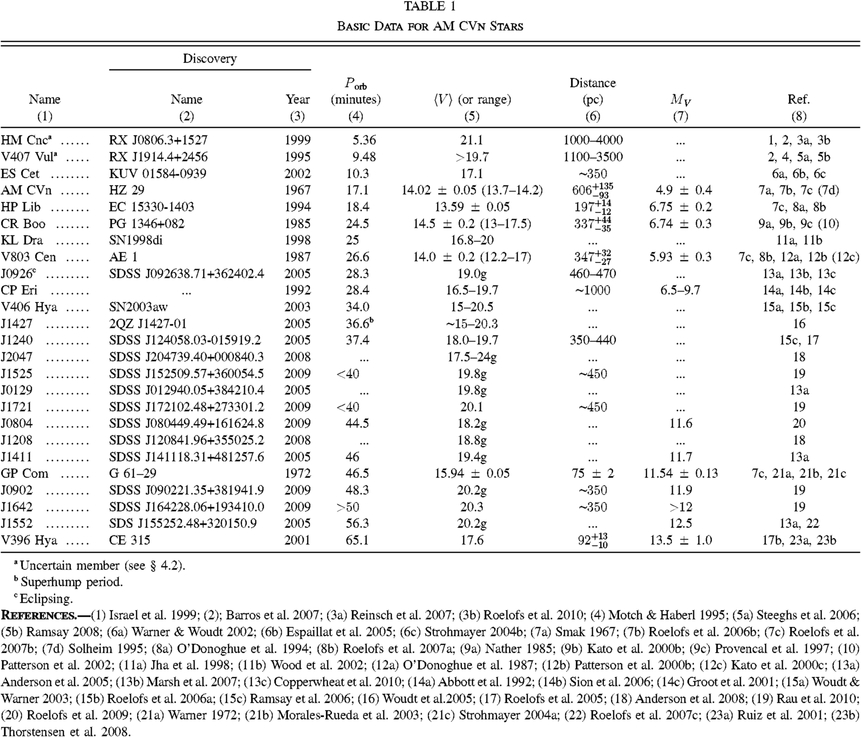 |
Column (1) in Table 1 gives the variable star name, or a short version of the catalog name, which will be used in the rest of this article. For two of the ultra–short-period stars, the membership in the AM CVn family is not settled, since HM Cnc has hydrogen and V407 Vul has no spectral features. This is discussed in more detail in § 4.2.
The AM CVn objects can be divided in four groups according to disk properties:
- 1.Ultrashort periods and no disk, P < 12 minutes.
- 2.Large stable disk in a superoutburst state, as for a novalike CV, 12 < P < 20 minutes.
- 3.Variable-size disk, with outbursts, and occasional superoutbursts, like the SU UMa subclass of dwarf novae, 20 < P < 40 minutes.
- 4.Small stable disk, like dwarf novae in quiescence, P > 40 minutes.
The average V magnitude (〈V〉) in Table 1 is a time-averaged value for objects with long photometric campaigns. In the same column the observed magnitude range is given. The MV is corrected for known interstellar absorption (Roelofs et al. 2007b), for those with quoted errors. For the others, the absolute magnitude is estimated from equation (13) with an expected error of 0.5 mags.
Figure 1 shows the distribution of AM CVn stars in Galactic coordinates. Only 3 out of 25 are located in the southern Galactic hemisphere. This bias is due to the large contribution of SDSS objects. Only nine objects were found with |b| < 30°, while 64% were expected based on population studies (Roelofs et al. 2007d).
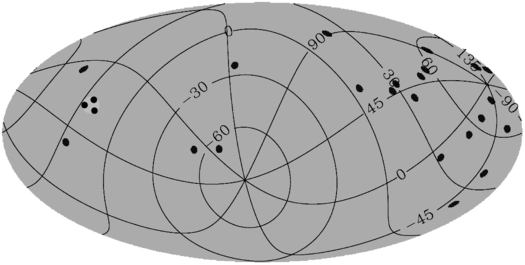
Fig. 1.— Distribution of AM CVn stars in Galactic coordinates (prepared by H. K. Eriksen).
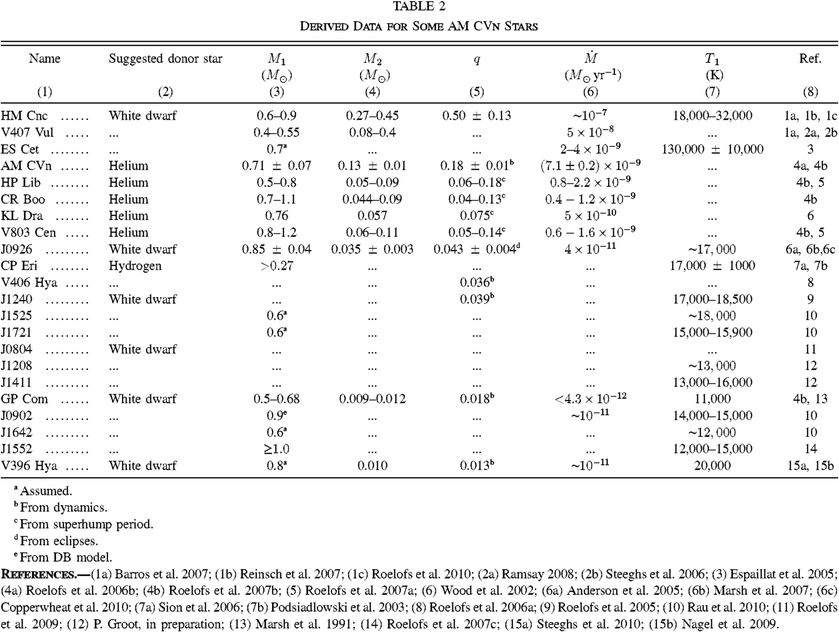
Table 2 gives some derived data for mass, mass transfer rate, luminosity, and temperature for AM CVn stars. The numbers are from various sources and estimated by different methods and assumptions. Some references are given in the table, and the methods and assumptions are discussed in more detail in § 4. In column (2) a possible donor channel is indicated for some of the stars. Determination of donor channel is at the moment quite uncertain, as will be discussed extensively in the following.
 |
3. FORMATION SCENARIOS AND POPULATION STUDIES
The small number of AM CVn stars tells us that they are rather special objects, difficult to find, or simply represent the endpoint to a fine-tuned evolution, where other outcomes are more likely. In Figure 2 a scenario for the evolution of AM CVn stars is shown.
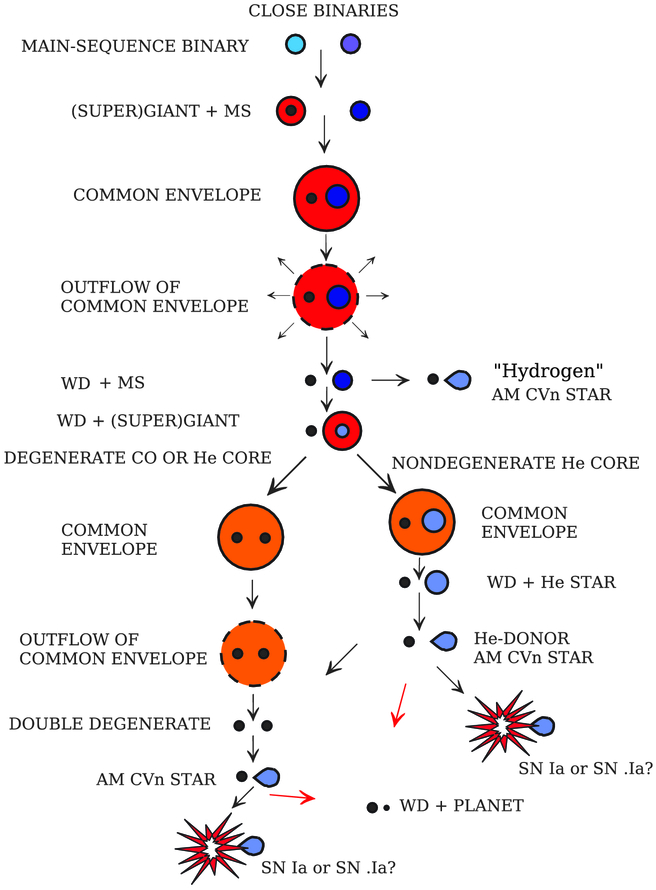
Fig. 2.— The basic steps in the evolution of AM CVn stars from close binaries to supernova explosions or a cooling white dwarf with a companion (prepared by L. Yungelson).
The starting point is a binary system consisting of two main-sequence stars with low enough masses to develop WD cores. The minimum mass of each star has to be slightly below one M⊙. Stars with lower masses will not evolve into AM CVn stars during the age of the universe. The most massive stars will be the first to evolve into a giant or supergiant star. If the orbits are close enough, the least evolved star will find itself inside the atmosphere of the giant or supergiant. This is called a CE event. In the CE event, the giant star loses its envelope and becomes a white dwarf with degenerate helium or carbon core. The companion star experiences a drag being inside the CE, and the system loses angular momentum. The orbital period shortens, and the result determines the future evolution of the binary. This phase is complicated to model because of the hydrodynamic nature of the process, but it is necessary for the evolution of all types of close binary stars, including those involving neutron stars and black holes. The study of the results of this phase, including AM CVn stars, is vital in order to model the population of short-period binaries.
Formation of an AM CVn star requires, in most cases, a second CE event to shorten the period even more. If the mass of the unevolved star, which in the future becomes the donor star, is M2 ≤ 2.3 M⊙ after the first CE event, it evolves into a helium white dwarf. Such systems form the so-called white dwarf subset of AM CVn stars (Paczyński 1967), shown as the left branch in Figure 2—the white dwarf channel. If 2.3 ≤ M2 ≤ 5 M⊙, the future donor appears from the second CE as a star with nondegenerate helium core, and after contact, such systems form the helium-star subset of AM CVn stars (Savonije et al. 1986; Iben & Tutukov 1987), shown as the right branch in Figure 2, called the helium-star channel. In this case, the donor star starts burning helium after the end of the CE event. GW emission brings the stars closer and mass transfer starts. The He burning may continue after the mass transfer starts and leads to composition changes (Yungelson 2008; Nelemans et al. 2010). The arrow from the He to the WD channel indicates the possibility that if the He is exhausted before RLOF, the helium star turns into a hybrid white dwarf that fills the critical lobe while evolving along the cooling track. Such a system would belong to the WD branch. In the He-channel the donor star is semidegenerate and has a larger mass than in the WD channel. At late stages the two channels merge, and the most likely end product is a cold DB white dwarf with a brown dwarf or a planet in close orbit.
If the distance between the two stars is too large for a second CE event, the pair will evolve as a normal hydrogen CV, with a white dwarf and a main-sequence star in a wider orbit. If the evolution is finely tuned, so the donor with mass ∼1.0 M⊙ fills its Roche lobe when the hydrogen abundance in the center is < 0.4, it may (by magnetic braking and GW radiation) evolve into a long-period AM CVn star. This is called the hydrogen-star channel (Tutukov et al. 1985; Podsiadlowski et al. 2003).
The first numerical population synthesis study for both the WD and He-star channels was made by Tutukov & Yungelson (1996). Nelemans et al. (2000) noticed that the standard algorithm with two stages of CE, described by Webbink's (1984) energy-balance equation, did not well reproduce the parameters of double white dwarfs known at that time, and a formalism for description of the first CE based on angular momentum balance was suggested. This algorithm was implemented in the population synthesis code, and a revised population study was done by Nelemans et al. (2001a). They concluded that the first CE event resulted in mass loss without significantly spiraling in. They argued that the almost equal mass of the two stars made the envelope easily spin up to corotate with the binary, and no drag force developed. A review of the current understanding of the CE event and its importance for evolution of short-period binaries is given by Webbink (2008).
After the second CE event we have the immediate progenitors of AM CVn systems in the two main channels: either systems with two white dwarfs or with a white dwarf and a helium star. They are in close orbits and the evolution is governed from now on by loss of angular momentum by GW radiation. This is described by Landau & Lifshitz (1971) for circular orbits:
where M1 and M2 are the masses of the two components, and a is the distance between them.
Loss of angular momentum brings the two stars closer together, and mass transfer begins when the radius of the lighter star, either a white dwarf or a helium star, exactly matches its Roche lobe. This is the moment of birth of an AM CVn star.
The mass transfer rate depends on the masses and the mass-radius relation (ξ) of the donor (Paczyński 1967):
where ξ(R2) = d ln R2/d ln M2. Stable mass transfer requires that
For a cool white dwarf with mass well below the Chandrasekhar limit, gravity is balanced by the degeneracy pressure of nonrelativistic electrons. A simplified mass-radius relation is

If we neglect the angular momentum in the spin of the binary components and allow all the angular momentum contained in the mass transfer stream to be returned to the orbit by tides, we get a stability criterion based on the preceding mass-radius relation:
In the following, I will discuss the three channels of formation separately and also the possibility of lower limits for qcrit.
3.1. The White Dwarf Channel
For this channel, stable mass transfer will start when the donor mass is reduced to between ∼0.13 and ∼0.3 M⊙, while the mass function for the accretors peaks at 0.65–0.75 M⊙ (Tutukov & Yungelson 1996). This is higher than the normal WD mass distribution peak of 0.60 M⊙ (Weidemann 1990). The donor may have a larger radius than a zero-temperature white dwarf (Deloye et al. 2005, Deloye et al. 2007b).
3.1.1. The Direct-Impact Phase
In order to achieve stable mass transfer q < qcrit. With small mass ratios, the distance between the stars becomes small, and the accretion stream can hit the surface of the accretor directly, instead of forming an accretion disk. This is demonstrated in Figure 3 (from Marsh et al. 2004), where the solid line is the lower limit for direct accretion, (qda ≳ 0.2). The upper dashed line is the upper limit for stable systems (qcrit). The gray scale indicates the birthrate distribution. As mass is transferred, the donor mass M2 will decrease, the accretor mass M1 will increase, and a disk may be formed.
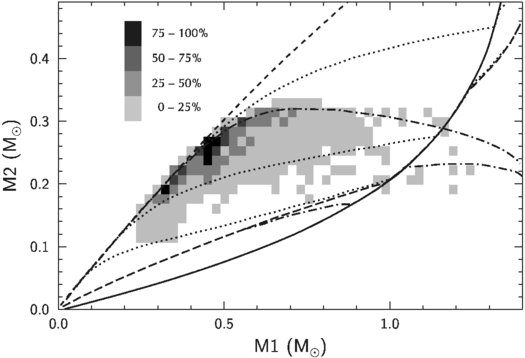
Fig. 3.— Birthrates and stability limits for mass transfer in close double white dwarf stars. The shaded areas are increasing birth probability relative to the maximum birthrate per bin of 9 × 10⁻⁵ yr-1. The upper dashed line is the upper limit for stable systems qcrit. The lower solid line is the lower limit for direct accretion qda. The upper dash-dotted line is the limit set by Eddington luminosity for stable mass transfer at synchronization time limit τ1 → 0. The lower dash-dotted line is the limit set by Eddington luminosity for τ1 → ∞, and the lower dashed line is the strict stability limit for the same, also called the pessimistic case. The three dotted lines show how the strict stability limit is raised for shorter synchronization timescales ranging from 1000 yr (bottom), 10 yr (center), and 0.1 yr (top). (From Marsh et al. 2004, Figs. 1 and 10, with permission from T. Marsh. The figures are combined and simplified by G. Nelemans. Reproduced with permission from John Wiley & Sons, Inc.)
The coupling between the accretor's and donor's spin and the orbit is important for survival as an AM CVn system. The rate of change in orbital separation can be written as follows (Marsh et al. 2004; Gokhale et al. 2007):
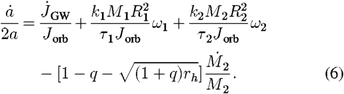
Here, k1,2 ∼ 0.2 are structure parameters, τ1,2 are the synchronization timescales for the stars, and ω1,2 = Ω1,2 - Ωorbit is the spin difference between the star(s) and the orbit, rh = Rh/a, where Rh is the radius of an orbit around the accretor, which has the same angular momentum as the transferred mass, and a is the distance between the stars.
Equation (6) shows that the orbital separation decreases due to gravitational radiation losses increases due to the dissipative torque if the accretor or donor is spinning faster than the binary and may decrease or increase as a result of mass transfer, depending on the mass ratio. The last term can make the mass transfer unstable, because it can lead to a runaway if the mass transfer causes the separation to decrease, which in turn causes the mass transfer to increase. The critical parameter is the synchronization timescale of the accretor (τ1). Figure 3 shows how the stability of AM CVn systems upon contact is particularly sensitive to τ1. This implies a much lower birthrate of stable AM CVn stars if the tidal coupling is inefficient (τ1 is large).
Further investigations by Gokhale et al. (2007) have shown that a larger fraction of detached double white dwarfs survive the onset of mass transfer than previously assumed, even if the mass transfer is initially unstable and rises to super-Eddington levels. Furthermore, many of the parameters oscillate after the first contact before the system finally stabilizes. As a result, the orbital period may increase during a few cycles and then decrease.
A surprising result is found by Motl et al. (2007), who followed the start of a dynamically unstable mass transfer (q = 0.4) in more detail. The mass transfer rate increased an order of magnitude during approximately 10 orbits, but then it reached a peak and even subsided. The accretor's spin saturated, and the angular momentum returned to the orbit more efficiently than previously assumed, and the donor survived.
Many details in the direct-impact phase are not completely known, but it is clear that this initial mass transfer instability will have important implications for modeling the space densities of stable AM CVn systems. Also, the unstable systems may leave some interesting merger products.
3.1.2. Evolution of the Donor
For stable mass transfer the donor's radius R2 must equal the Roche lobe radius RL, which is
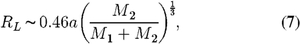
which is valid for q < 0.8 (Paczyński 1971a). Combining R2 = RL with Kepler's third law, we get:
In analyzing and modeling AM CVn systems it is customary to specify a mass-radius relation for the donor in order to arrive at a unique relation between Porb and M2. One example is the mass-radius relation for cold spheres (T = 0) after Zapolsky & Salpeter (1969), valid for 0.002 < M2 < 0.45 M⊙, assumed to be accurate within 3%:

and used by Nelemans et al. (2001a) for white dwarf secondaries in their population synthesis. For helium secondaries, they used the following M - R relation:

based on Tutukov & Fedorova (1989) calculations. However, the use of discrete single-valued M - R relations limits what can be learned about these systems. Based on calculations of low-mass He WD models, Deloye et al. (2005) have demonstrated how a set of continuous M - R relations can, for a fixed Porb, determine M2 if the donor's specific entropy (degree of degeneracy) is specified by the core temperature Tc. They assumed that the donors were fully convective and evolve adiabatically under mass loss. Calculations with a full stellar evolution code (Deloye et al. 2007a, Deloye et al. 2007b) showed that the AM CVn evolution can be described in three phases, as shown in Figure 4 (left). First we have a turn-on phase, where the mass transfer rate increases to a maximum value, and the R2 contraction stops and changes to expansion. When this change takes place depends on the degree of degeneracy in the outer layers, which have a steep degeneracy profile. When the system has passed its  maximum, the donor is expanding adiabatically and the binary is now in the most typical AM CVn phase. In this figure the donor's entropy is parameterized as ψc,i, where ψc = εF,c/kTc and εF,c is the electron's Fermi energy at the donor's center.
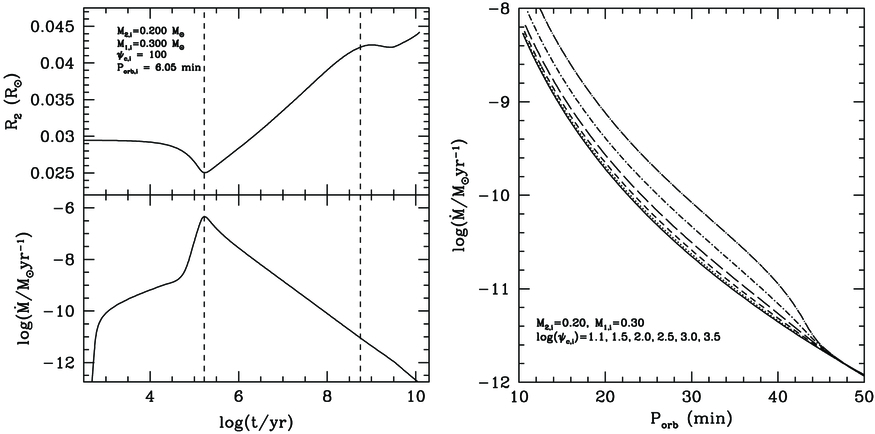
Fig. 4.— (Left): A representative result of AM CVn binary evolution calculation. Initial parameters are M1,i = 0.3 M⊙, M2,i = 0.2 M⊙, ψc,i = 100, and Porb,i = 6.5 minutes, where ψc is the central degeneracy parameter (ψc =  F,c/kTc with Tc as the central temperature, and F,c is the electron's Fermi energy at the donor's center). The system's evolution can be divided into three phases, as marked with the vertical dotted lines: the
  turn-on phase, adiabatic donor evolution, and final cooling at later times. (From Deloye et al. 2007a, Fig. 1, with permissions from C. Deloye and ASP Conf. Ser.) (Right): Evolution of
  as a function of Porb for systems where the initial donor and accretor masses are 0.2 and 0.3 M⊙, respectively. The different curves represent different donor entropies (ψc,i). The solid line shows the evolution of a fully degenerate object, while the top lines show the evolution for decreasingly degenerate objects (increasing Tc). (From Deloye et al. 2007a, Fig. 2, with permissions from C. Deloye and ASP Conf. Ser.)
In the previous work by Deloye et al. (2005), the adiabatic phase was assumed to last indefinitely. But when the mass loss timescale  becomes less than the donor's thermal timescale τth, the donor starts shredding entropy and contracts toward a completely degenerate state. This typically happens for Porb between 40 and 50 minutes. This is the third and longest phase in the AM CVn evolution. An example of the
  versus Porb evolution for an AM CVn star is shown in Figure 4 (right). The least degenerate donors have a higher mass transfer rate before they become fully degenerate.
3.1.3. The Luminosity and Temperature of the Donor
The full stellar structural evolution calculations by Deloye et al. (2007a) have also made it possible to calculate the luminosity and Teff of the donor. If we assume no irradiation effects, the luminosity during the adiabatic expansion phase becomes L2 ∼ 10-6 - 10-4 L⊙ and Teff ∼ 1000–1800 K. However, the flux generated in the accretion flow dominates the donor's intrinsic light at all times. Assuming a gray atmosphere and that a fraction η of the received radiation from a point source (accretion spot) is thermalized in the donor's photosphere, Deloye et al. (2007a) found that the impact of irradiation on the donor extends the phase of adiabatic expansion to longer Porb. It also slows the contraction during the cooling phase and makes the donor more luminous. Teff may increase as much as 1000 K. An example of the impact of irradiation in the limit of zero albedo is shown in Figure 5a. Instead of a plateau at L2 ∼ 10-5 L⊙, the luminosity is gradually decreasing with a gradient depending on η and can be as high as 10-2 L⊙ right after maximum  .
.
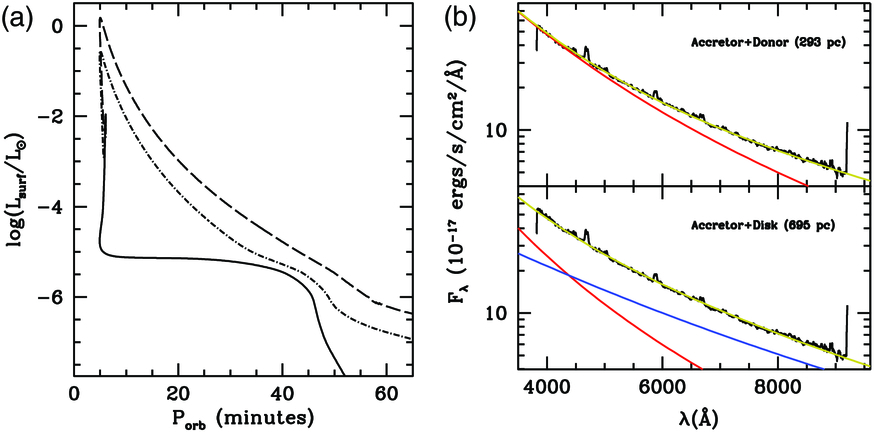
Fig. 5.— (a): Irradiation's impact on the donor's surface luminosity Lsurf, for η = 0 (solid line), 0.1, and 0.5, where η is the fraction of received radiation from a point source (accretion spot) that is thermalized in the donor's photosphere. (From Deloye et al. 2007b, Fig. 14, with permission of C. Deloye.) (b): low-resolution spectra of AM CVn binaries in the low state can be modeled either as accretor plus disk spectrum or accretor plus donor spectrum. An example is shown for J0926, which is modeled in the upper panel (yellowline—behind observed spectrum) with a Teff = 21,000 K, R1 = 0.01 R⊙ accretor (redline) plus a Teff = 4400 K, R2 = 0.0043 R⊙ donor (below x-axis). The lower panel shows the combined spectrum (yellowline) from a Teff = 39,000 K accretor (redline) and a steady-state α—disk model (blueline). The distances for the two models are given in the panels. (From Deloye et al.2007b, Fig. 20, with permission from C. Deloye. Both figures are reproduced with permission from John Wiley & Sons, Inc.)
Low-resolution spectra of AM CVn stars in the low state can be modeled either as an accretor plus disk spectrum or an accretor plus donor spectrum. An example is shown in Figure 5b for J0926 (Deloye et al. 2007b). Since the disk spectrum is more luminous, the unknown distance becomes more than doubled for the disk model.
Another possibility is to detect the secondary object in IR photometry. So far, little IR photometry has been done of any AM CVn stars, except for AM CVn itself, where a donor with Teff ∼ 10,000 K is needed to fit IR observations in addition to a model disk spectrum (Nelemans et al. 2001b).
3.1.4. The Accretor: Response to Accretion
Accreting helium on a white dwarf heats up the outer layers (and if the mass transfer rate is high enough, the heat that diffuses inwards) will eventually reach the core and heat it up. However, as the mass transfer rate diminishes, the normal white dwarf cooling will dominate.
During the lifetime of an AM CVn star the mass transfer rate changes 6 orders of magnitude, from a maximum at ∼10-6 M⊙ yr-1. The accretion history can, according to Bildsten et al. (2006) be divided into four different phases: The first, rapid-accretion phase, may last only ∼105 years with unstable recurrent He ignition (nova) events. As the mass transfer rate slows, the temperature drops, and the accreted He-shell becomes thicker before ignition, which means that the last explosion is the most violent. Explosions are discussed in more detail in § 3.4.
The second phase takes place when M2 < 0.1 M⊙. In this stage the accretor is already cool and the mass transfer rate is low. The envelope experiences compressional heating, and this phase lasts from 3 × 10⁵ to 3 × 10⁶ yr. In the following period lasting until 108 yr, the inward-diffusing heat balances the core cooling, and Tc is approximately constant. Then, in the fourth phase, after 108 yr, the mass transfer rate is too small to stop the normal DB white dwarf cooling. The mass transfer rate at the time of decoupling is of the order of 1–3 × 10⁻¹⁰ M⊙ yr-1. The luminosity depends on the time since decoupling (Bildsten et al. 2006).
Observation of the accretor is possible in the direct-accretion phase, when the impact location is out of sight. The white dwarf is then very hot and will dominate in the UV spectrum. For systems with disks, the luminosity of the disk will dominate as long as the disk is in the high state, but for low-state disks the accretor may be observed with Teff < 20,000 K. Finally, for the objects on the DB cooling track, the disk is much colder and smaller, and the accretor becomes the brightest component.
As the white dwarf cools, it will pass through the DB pulsational instability strip, which for single DBs is located at 22,400 K < Teff < 27,800 K. For accreting white dwarfs the instability strip may be different, due to spin-up of the accretor and the mass of the helium envelope. Pulsating ZZ Ceti stars in CVs are found both inside and outside the DA instability strip, but most are on the hotter side (Szkody et al. 2010). So far, no AM CVn pulsator is detected. However, if an accreting pulsator is found, it may give the opportunity to determine the accumulated He-layer mass and the inward angular momentum transport. The best chances for detecting a pulsator are for Porb between 20 and 40 minutes (Bildsten et al. 2006).
Figure 6 shows the parameters  , Teff and minimum MV calculated for three different binary systems as a function of Porb and compared with values estimated from observed systems. The two objects GP Com and V396 Hya (CE 315) have both quiescent (small) disks and known distances. They fit models with hot donors.
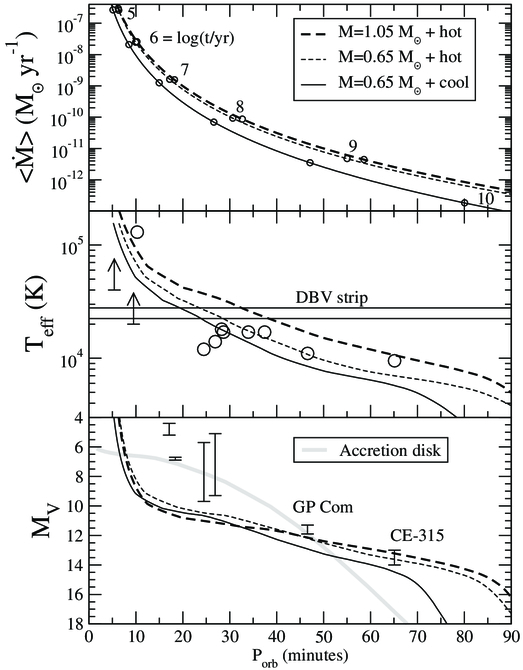
Fig. 6.— Time-averaged accretion rate, white dwarf surface temperature, and minimum absolute magnitude as a function of Porb for three different binary models. The long-dashed curve represent a 1.05 M⊙ accretor, while the others have 0.65 M⊙. In each case a 0.05 M⊙ helium shell is accreted. The donors have low (cold) or high (hot) entropy (Deloye et al. 2005). In the upper panel the timescale is indicated. In the central panel the DB instability strip is shown, together with circles indicating the estimated Teff (or arrows for lower limits) for observed systems. The bottom panel shows the minimum MV, with limits for observed systems. The gray line indicates disk magnitudes. The circles in the middle panel and the bars in the bottom panel are observed values. (From Bildsten et al. 2006, Fig. 2, with permission from L. Bildsten. Reproduced with permission of the AAS.)
Figure 5b (top) shows that an accretor with Teff = 21,000 K fits the spectrum in the eclipsing system J0926, if there is no disk. If a disk is added, the best fit for the accretor becomes Teff = 39,000 K with  (Fig. 5b, bottom). It may be possible to choose between the two models if the distance is determined independently. For CP Eri, with almost the same orbital period, a HST spectrum covering the wavelength range from 1100–1700 Å was taken in the low state and was best modeled with a hybrid white dwarf (DBA) model with Teff = 17,000 K (Sion et al. 2006). In this case, the DBA model produced a significantly better fit than would a disk model.
3.2. The Helium-Star Channel
In an alternative route of evolution the donor star is replaced by a low-mass nondegenerate helium star that transfers mass to a white dwarf accretor and evolves through a period minimum of ∼10 minutes. The donor star is the nondegenerate core of a 2.5–5 M⊙ star and at the time of contact may be in different stages of He exhaustion in the core, from Yc = 0.98 to about 0.1: i.e., from an almost homogeneous He star to a star at the helium terminal-age main sequence, which is the moment the star starts to contract at the end of He burning in the center. Masses of helium stars are ≥0.32 M⊙. The nuclear evolution of He stars with mass ≤ 0.8 M⊙ terminates after the helium-burning stage, and they evolve directly into white dwarfs (Paczyński 1971). The secondary, which burns helium at the onset of mass transfer, becomes semidegenerate and dims during the mass transfer, while the period increases as the mass transfer rate decreases.
One problem with this scenario is the possibility of a destructive thermonuclear runaway explosion in the accreted helium layer. Iben & Tutukov (1987, 1991) calculated that transfer of about ∼0.15 M⊙ of helium onto a dwarf of initial mass ∼0.6–1 M⊙ is sufficient for a thermonuclear runaway. If the mass of the accretor is ∼0.6 M⊙, the system may appear as a short-lived helium planetary nebula. If it remains visible for about 100 yr, there may be one such (super)nova at any time in the Galaxy at a luminosity of the order of 10,000 L⊙ (Iben & Tutukov 1991). Nondestructive ignitions are discussed in § 3.4.
Ignition of helium on the surface may also lead to central detonation of carbon of a sub-Chandrasekhar mass accretor (Livne & Glasner 1991) and prevent the binary from becoming an AM CVn star. Because of the possible variations in starting conditions, Nelemans et al. (2001a) used two assumptions for their population synthesis calculations: In the inefficient scenario, accumulation of Mign = 0.15 M⊙ is enough for an explosion. In the efficient scenario, Mign = 0.3 M⊙ is needed. This led to a near doubling of the resulting population. Modeled progenitor populations for these two cases are shown in Figure 7. It should be noted that if rotation is taken into account, energy may be efficiently released at the base of the accreted layer and helium ignition occurs in less degenerate conditions than in the nonrotating case (Yoon & Langer 2004; Bildsten et al. 2007). Thus, helium novae may happen instead of supernovae, and formation of AM CVn systems remains possible. As Figure 7 shows, accumulation of 0.3 M⊙ is not very likely, and if rotation prevents disruption of accretors, the resulting population of the helium-star family will be close to the one obtained in the efficient scenario.
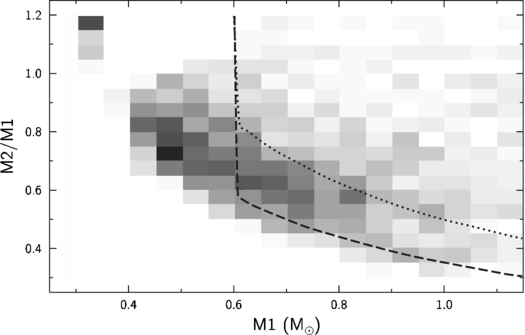
Fig. 7.— Mass distribution of white dwarf stars with helium-star companions that start stable mass transfer. In the systems to the right of the dotted and dashed lines, the white dwarfs have to accrete at least 0.3 M⊙ (dashed line) or 0.15 M⊙ (dotted line) before ignition. The gray scale indicates the model birthrate distribution as a fraction of the total birthrate of 1.4 × 10⁻⁴ yr-1. The population in the upper left corner consists of binaries with helium white dwarf accretors. (Credit Nelemans et al. 2001a, Fig. 3, with permission from G. Nelemans and ©ESO.)
A more detailed investigation of the evolution of low-mass helium stars in AM CVn systems has been presented by Yungelson (2008) for a set of representative binaries. The important parameters are the mass of the He star (MHe,0) and the orbital period (Porb,0) at the end of the CE episode that resulted in the formation of a WD + He-star system. As the helium stars evolve, GW radiation decreases their orbits, and at some time after the CE episode, mass transfer starts. For a short time, the period decreases before the minimum period is reached. Then the period increases, for the same reasons as for systems with WD donors.
Figure 8 gives examples of the period-mass transfer evolution after the CE episode. As GW radiation removes angular momentum, the orbit shrinks. For periods between 9 and 11 minutes, the mass transfer rate increases and will finally dominate. Then the period will start to increase. The  will now decrease and the exponent in the M - R relation becomes more negative (eq. [10]), because of growing degeneracy for mass-losing donors. According to Yungelson (2008), the M - R relation for models with helium-star donors with initial M2 between 0.34 and 0.40 M⊙, and Porb,0 between 10 and 35 minutes, can be written as:
When the mass of the donor is reduced to ∼0.01–0.03 M⊙ the timescale for mass transfer τ M ˙ ≧ τ th and the donor will develop into a fully degenerate cooling WD, and populations with the WD and He-star donors will merge. This happens for Porb ≳ 35–40 minutes.
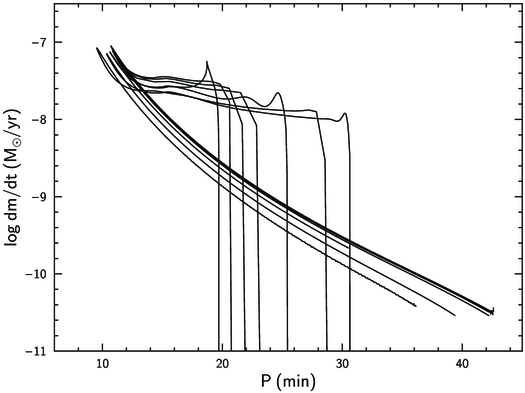
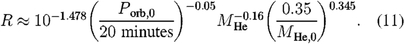
Fig. 8.— Dependence of mass loss rates on the period for a binary system with initial mass M1 = 0.4 M⊙ and M2 = 0.8 M⊙ and with initial orbital periods Porb,0 = 20, 40, 60, 80, 100, 120, and 140 minutes (from left to right), when the last common envelope phase ends. Initially, more evolved donors overflow their Roche lobes at longer periods. (From Yungelson 2008, Fig. 2, with permission from L. Yungelson and Pleiades Publishing, Inc.)
3.2.1. Estimating Donor Mass
The donor mass may be used to decide from which channel of evolution the various AM CVn stars come. Mass estimates for some AM CVn star donors compared with Porb - M2 relations for helium donors are shown in Figure 9. In this figure the orbital period-mass relation for a least degenerate donor is also shown. All the AM CVn stars in this graph may have nondegenerate helium-star donors. For HP Lib and J0926, mildly degenerate WD donors are also possible. For P ≳ 40 minutes the timescale of mass loss begins to exceed the thermal timescale of the donors, they become more degenerate, and the populations merge (Yungelson 2008).
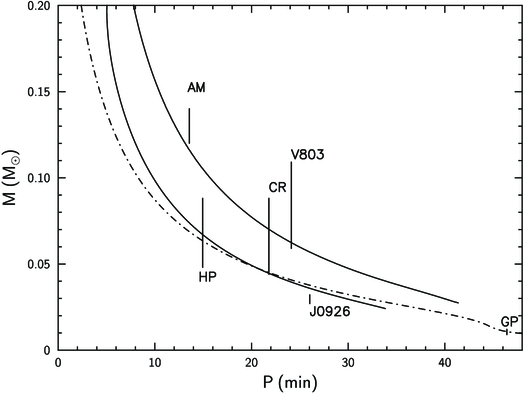
Fig. 9.— Orbital period—donor-mass relation compared with observations for binary systems with initially least (top) and most evolved donors (bottom). The initial masses of the binaries are 0.35 M⊙ + 0.5 M⊙ (thin solid lines). For most evolved donors the lines practically coincide. The dot-dashed line shows the relation for a M0 = 0.3 M⊙ and log ψc,i = 1.1 helium white dwarf donor, which is the least degenerate in the sample of Deloye et al. (2007b). The vertical bars are mass estimates for some of the best-known AM CVn stars in Table 2. (From Yungelson 2008, Fig. 6, simplified with permission from L. Yungelson and Pleiades Publishing, Inc.)
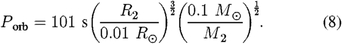
If we assume that the radius of the donor star is equal to the Roche lobe radius (eq. [7]), the estimated mass-radius relation can be compared with M - R relations (eqs. [9] and [10]) or to equations for increasingly degenerate WD donors (log ψi,0 = 1.1, 1.5, 2.0) (Deloye et al. 2007a) or to partly degenerate He-star donors, as shown in Figure 10. This indicates that HM Cnc and GP Com are the only objects where WD donors appear to be the only possibility.
Fig. 10.— Mass-radius relations assuming Roche lobe radii (eq. [8]) for some AM CVn donors (dashed lines), with estimated masses (Table 2) as thicker lines. The lower solid line is the RZS for a cold sphere (eq. [9]). The upper solid line is the RTF for helium-star secondaries (eq. [10]). The thick dash-dotted line is a model with a mildly degenerate WD donor (log ψc,i = 1.1), which approximately defines the border between the WD donors (bottom) and helium-star donors (top) for log M2 > -1.6. The thinner dash-dotted lines are models with increasing degeneracy: log ψc,i = 1.5 and 2.0 (downward). A star like V396 Hya can only be a fully degenerate object.
3.3. The Hydrogen Star Channel
This channel was first proposed by Tutukov et al. (1985), who calculated evolutionary tracks for low-mass close binaries with a compact primary and a slightly evolved, chemically inhomogeneous secondary, with angular momentum being lost from the system by GW radiation and a magnetic stellar wind. As the binary evolves, the orbital period will shorten to 20–80 minutes, and the mass transfer rate may increase to ∼10-9 M⊙ yr-1. In these calculations the starting mass of the secondary was between 0.85 and 1.25 M⊙. M2 = 0.85 M⊙ is the lowest mass a star can have and still consume its hydrogen core within a Hubble time.
A systematic study of evolution of cataclysmic variables (CVs) by Podsiadlowski et al. (2003) shows that binary systems that start mass transfer from a ∼1 M⊙ normal H-rich star, near the end of, or just after, hydrogen core burning may become ultracompact binaries with periods as short as ∼10 minutes. The secondary is initially nondegenerate and hydrogen-rich, but becomes increasingly degenerate and helium-rich during its evolution. Angular momentum loss is due to GW radiation, and magnetic braking is described by the formalism of Rappaport et al. (1983). However, van der Sluys et al. (2005) have shown that ultrashort periods are only reached by an extremely small range of binary parameters if one assumes that specific magnetic braking law. They also show that for less efficient magnetic braking, ultrashort periods are not reached in a Hubble time, independent of the amount of mass and angular momentum lost from the binary. Calculations (van der Sluys et al. in progress) show that periods as short as 6.5 minutes can be reached for specific values of magnetic braking.
In a population study of short-period (P < 25 minutes) AM CVn binaries, Nelemans et al. (2004) conclude that a total of 2400 post-CV AM CVn stars are expected in our Galaxy, compared to 140,000 possibly detectable from the WD and helium-star channels together—based on optimistic models. However, the population as calculated from detected AM CVn stars in the Sloan Digital Sky Survey is only one-tenth of the modeled population (see § 3.5), which means that selection effects and model parameters may not be completely understood.
One way to distinguish between the hydrogen-star channel and the other two channels is that in this channel a few percent of hydrogen still remain in the donor envelope before the period minimum is reached. After the period minimum, the hydrogen content will decrease and this population may not be distinguishable from the objects from the WD channel at the longest periods. The composition of helium-star donors may be different at long periods, because of helium-burning products.
Spectroscopy of GP Com (Marsh et al. 1991) gave an upper limit for the H/He ratio of 10-5 by number. Similar limits are found for AM CVn, CR Boo, HP Lib, and V803 Cen from modeling their disk spectra (Nasser et al. 2001). They are not candidates for the hydrogen-star channel. A possible candidate, however, is CP Eri. Its low-state UV spectrum shows a Lyα profile, which is best fitted with a H/He ratio of 10-3 by number. With an orbital period of 28.4 minutes, this may be a CV descendant evolving after its period minimum (Sion et al. 2006). Two short-period CVs with evolved hydrogen-rich donors (El Psc and V485 Cen) are so far known below the nominal CV period minimum (Gänsicke 2005).
3.4. Explosive Events: Novae and Supernovae
In the helium-star channel, explosive events either resulting in complete detonation as a supernova or in a stronger-than-normal nova may happen as described in § 3.2 when the binary is evolving toward period minimum with  . When Porb ∼ 10 minutes, then M2 ∼ 0.2 M⊙, and we see from Figure 11 (dotted line) that there is not enough mass left for another explosive event. However, the situation is different for fully degenerate donors. For the shortest periods (2.5–3.5 minutes),
  is ∼10-6 M⊙ yr-1, and stable helium burning occurs on the accretor (Tutukov & Yungelson 1996). As
  decreases the He burns unstably via recurrent flashes. Figure 11 shows the relation between accretion rates and ignition mass. It is expected that ∼10 recurrent weak He flashes occur as the donor mass drops from 0.2 to 0.1 M⊙ (Bildsten et al. 2007). In all cases the last flash has the largest Mign. The time from first contact to last flash is ∼108 yr, and we should expect one such explosive event, termed SN .Ia, every 5–15,000 yr in an E/S0 galaxy. The brightness and the duration are about one-tenth of a normal SN Ia event.
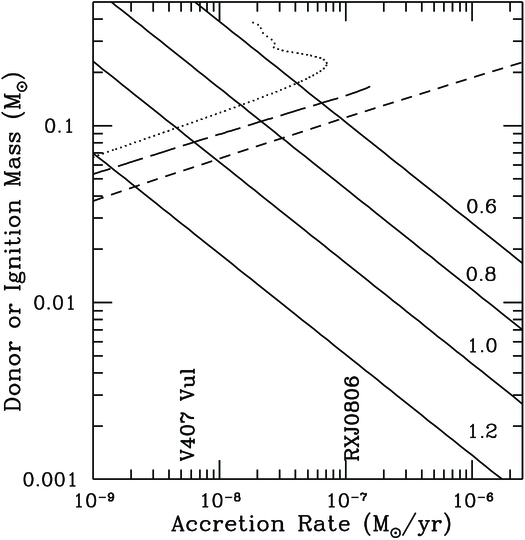
Fig. 11.— Helium ignition masses for fully degenerate and semidegenerate donor masses in AM CVn stars. The dotted line gives the accretion rate for a helium semidegenerate donor with Porb = 80 minutes after the CE event (Yungelson 2008). The short dashed line is a fully degenerate secondary, and the long dashed line is a WD with a finite entropy (Deloye et al. 2005). The solid lines show (Iben & Tutukov 1989) ignition masses for pure He accretion on WDs for different masses. Two AM CVn candidates with  in this range are indicated. (From Bildsten et al. 2007, Fig. 1, with permission from L. Bildsten. Reproduced with permission of the AAS.)
The discovery of a helium nova (V445 Puppis) (Kato et al. 2000a) raises the question of whether this system is related to AM CVn stars. The nova remnant is hidden inside an expanding dust shell. The derived luminosity suggests it is a massive white dwarf accreting from a helium-star companion (Woudt et al. 2009). It is important to search for the orbital period of the binary when the nova debris finally blows away, in order to verify if this object belongs to the AM CVn family and, as such, could become a SN Ia progenitor.
Figure 2 shows that both the white dwarf and the helium donor systems may evolve into SN Ia's. Population studies show that systems with He-star donors produce more SN Ia explosions at earlier ages (0.3–4 × 10⁸ yr), while systems with white dwarf donors need 0.4–2.5 × 10⁹ yr to explode (and then with a lower rate). Type Ia progenitors are first found among pairs with unstable mass transfer, which may lead to a critical mass of the accretor in some cases. A maximum of 1% of the present AM CVn population will evolve into SN Ia's (Solheim & Yungelson 2005), and none of the known AM CVn stars have high enough mass to explode.
A similar conclusion is reached by Ruiter et al. (2009), who show that binaries related to AM CVn progenitors produce a short burst of SN Ia within 2 Gyr with a median time difference of ∼0.6 Gyr. They emphasize that the potential SN Ia progenitors are massive ultracompact systems (Porb ∼ 10 minutes), quite different from the known AM CVn population. Rates calculated by Ruiter et al. (2009) are ∼10-4 yr-1 for a Milky Way type of galaxy.
3.5. Calibration of Population Synthesis Models
Most AM CVn binaries were previously discovered by chance by their variability. In particular, the outbursts' objects (like dwarf novae) are easily discovered. Three of the more recent discoveries in this group were found in supernova searches.
Population synthesis models of AM CVn stars have predicted their space density, but these are believed to be uncertain to 2 orders of magnitude (Nelemans et al. 2001a, 2004). The most uncertain part to determine is the birthrates in the two main channels of evolution, and this led Nelemans et al. (2001a) to propose an optimistic or pessimistic scenario for the evolution. In the optimistic case, there is a strong tidal coupling to feed back the angular momentum to the orbit in the white dwarf channel, and in the helium channel, there is a smaller chance to destroy the progenitor by edge-lit detonations. In the pessimistic scenario, there is no tidal coupling for the WDs, and edge-lit detonations are more likely for the helium progenitors.
The observed AM CVn stars (Table 1) show emission-line spectra for orbital periods P > 40 minutes and alternate between absorption and emission spectra for orbital periods between 20 and 40 minutes, spending more time in the low state with emission spectra between outbursts as the period increases. This is the same behavior as for dwarf novae in ordinary CVs. For P > 30 minutes the following equation describes the relation between the effective temperature of the donor and the period (Roelofs et al. 2007d), which are approximations to numerical results by Bildsten et al. (2006):

and the following relation between absolute magnitude and orbital period:

with an estimated root-mean-square scatter of 0.5 mag, where Mg is the absolute magnitude in the g band of the SDSS. Based on these relations, a realistic Galaxy population model, and the assumed evolution of the WD and helium progenitors, Roelofs et al. (2007d) calculated sky surface density predictions as the function of orbital period. The predicted density of AM CVn stars is highest for low Galactic latitudes, where we also find the youngest population, which also tend to have shorter orbital periods.
With the SDSS survey, the search for AM CVn binaries can, for the first time, be carried out in a systematic way. The first phase, SDSS-I, contains photometry down to a magnitude g = 22 of 8000 deg2, concentrated on the north Galactic cap. Spectroscopy is done for about one million objects, which are selected by several different target selection criteria, based on color and magnitude, giving priority to galaxies and quasars. So far, 15 emission-line AM CVn stars have been detected in the systematic searches (Anderson et al. 2008; Roelofs et al. 2007d; Roelofs et al. 2009; Rau et al. 2010). In order to estimate the sky surface density distribution, one needs to estimate the completeness of targets selected for taking spectra. Anderson et al. (2008) estimate the spectroscopic completeness to be ≳24% for 15 < g < 20.5, which gives a sky surface density for AM CVn stars of ∼3 × 10⁻³ per deg2. This is somewhere between estimates based on the optimistic and pessimistic models mentioned previously.
A more detailed analysis of the completeness is done by Roelofs et al. (2007d). Figure 12 shows how the completeness varies with color bins in u - g and g - r and the location of the first 15 AM CVn stars found in the SDSS compared with a blackbody cooling track and the modeled cooling tracks for DA and DB white dwarfs. The completeness is between 10 and 30%, which means that the SDSS may be concealing on the order of 50 more AM CVn stars.
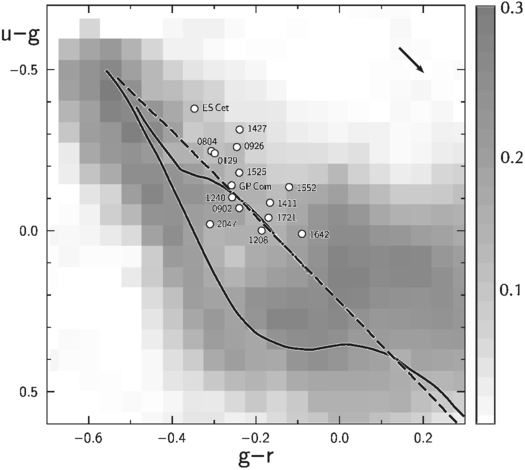
Fig. 12.— Completeness of spectroscopic follow-up (gray scale) in SDSS as a function of the u - g and g - r colors to a limiting magnitude g = 21. The circles indicate the location of identified AM CVn objects in the survey. The dashed line is the blackbody cooling track. The left solid line is the DA white dwarf cooling track, and the right solid line is the DB cooling track. (From Roelofs et al. 2007d, Roelofs et al. 2009, Figs. 2 and 1, revised and updated by G. Roelofs and the author. Reproduced with permission from John Wiley & Sons, Inc.)
In order to overcome the spectroscopic incompleteness of the SDSS, an independent survey has been started of a color-selected sample based on the SDSS photometric database. The search strategy is described by Roelofs et al. (2009), who also presented the first identified AM CVn object, J0804, based on this strategy. In addition, searches in the time domain for variability are expected to find more dwarf novae like AM CVn stars with absorption-line spectra when they exhibit outbursts. Anderson et al. (2008) described the first SDSS-II supernova-search-detected AM CVn star (J2047).
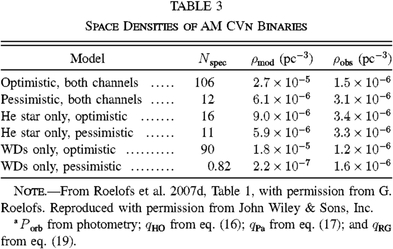
A comparison between the modeled and observed space densities of emission-line AM CVn stars in the SDSS database, based on the first six SDSS detections, is given in Table 3—with numbers from Roelofs et al. (2007d). The table shows how many objects are expected for each channel, separate and combined. The remaining room for errors in the modeled space density is estimated to be less than a factor 2. It is clear that the optimistic case of the WD channel gives a space density that is far too high, and that for the pessimistic case is too low. If the WD channel alone may explain the observations, then only about 10% of the optimistic case number is needed. On the other hand, the helium channel alone predicts more than those observed in both cases. From Table 1 we notice that only 3 of the 25 known AM CVn stars have periods above 50 minutes. The lack of detections for long periods may be explained if the mass transfer shuts down completely for substantial periods of time and the emission lines, used for detection, disappear.
 |
A population study by Nelemans et al. (2004), who investigated the number of short-period (P < 25 minutes) objects in our Galaxy that could be detected by the planned low-frequency GW radiation space detector (LISA), focused on the subset of these objects with optical and/or X-ray counterparts. The optimistic population model used, showed that the largest fraction (i.e., more than 90%) of those are AM CVn stars (Nelemans et al. 2004). They estimated a population of about 140,000 AM CVn stars with P < 25 minutes in our Galaxy. This number must be reduced by a factor of 10 to be within the observed space density from the SDSS searches (Roelofs et al. 2007d). One may question whether this is due to selection effects or to something missing in the population synthesis. In any case we may conclude that we observe AM CVn stars with both white dwarf and helium-star donors, as shown in Figures 6, 9, and 10. There may even be one hydrogen-star donor, as well as some evolved CVs, that in the future may appear as AM CVn stars.
4. OBSERVATIONS: LARGER TELESCOPES AND NEW TECHNIQUES
For the few known AM CVn stars, the period of 1990–2000 was a decennium of large photometric campaigns, involving tens of telescopes on all continents, including the Whole Earth Telescope (WET) (Nather et al. 1990), the Center for Backyard Astrophysics (CBA) (Patterson 2000), and the Variable Star Network (VSNET) (Kato et al. 2000b). The introduction of CCD photometry made high-speed photometry possible even with smaller telescopes. Initially, it was a matter of orbital periods, superhump periods, and possible pulsations on the white dwarfs in the systems. The main goal was to confirm the AM CVn stars as a subclass of CVs.
When the first AM CVn review was published (Warner 1995), the interpretation of AM CVn itself as a binary was disputed. Patterson et al. (1992, 1993) compared light modulations with white dwarf pulsations, and concluded that the period 1051 s was a superhump period and that an observed 13.38 hr period in helium absorption-line profiles was due to apsidal precession of the disk. From this they predicted an orbital period of 1028 s. Analysis of 298 hr of high-speed photometry (Provencal et al. 1995) revealed no detectable power at the period 1051 s, but rather at its harmonics (525 s and higher), with many double frequency peaks showing a frequency difference of 20.77 μ Hz, or 13.37 hr. A WET campaign with 143 hr of observations in 12 days in 1990 showed that the amplitude of the main modulation of 525 s varied with a period of 13.32 hr and that the sideband structure might be related to structures in the disk (discoseismology). Low-amplitude variations were detected at periods 1028 s and 1011 s, with the latter period interpreted as a pulsation period (Solheim et al. 1998). Skillman et al. (1999) reported photometry comprising 670 hr (1992–1999) and argued that the 1051 s period was the superhump period and 1028 s the orbital period, with 1011 s as a negative superhump period related to nodal regression.
Intensive photometric campaigns on CR Boo (Provencal et al. 1997; Patterson et al. 1997) also revealed a superhump period for this star, and a supercycle period of 46.3 days (Kato et al. 2000b) was even established. Finally, Patterson et al. (2000b) reported superhumps for V803 Cen, both in its high and low states, including a cycling state somewhere between the maximum and the minimum, where the brightness varied with a period of about 22 hr and by an amplitude of about 1 mag. This was supplemented with observations of the newest bright AM CVn star, HP Lib, which also showed superhumps (Patterson et al. 2002).
At the turn of the millennium the observational aspects broadened. Access to larger telescopes gave opportunities for time-resolved spectroscopy. The first published was for GP Com, where the orbital period of 46.5 minutes was confirmed, and an S-wave in phase bin trailed spectra and a central peak showing small velocity variations in the center of emission lines were also found (Marsh 1999). The first ultrashort period, possibly an AM CVn star, V407 Vul, was detected as an X-ray variable with a period of only 9.5 minutes (Motch & Haberl 1995).
In the following sections I will first present X-ray observations of the normal AM CVn stars (§ 4.1), then discuss in more detail the two X-ray-detected ultracompact binaries (§ 4.2), followed by disk spectra (§ 4.3), chemical composition and evolution (§ 4.4), Doppler tomography and spikes (§ 4.5), superhumps and disk structure (§ 4.6), and the first eclipsing AM CVn star, J0929, which has given us a good clock to follow (§ 4.7).
4.1. X-Ray Observations
Some of the AM CVn stars: AM CVn, CR Boo and GP Com are weak, soft X-ray emitters (Ulla 1995). The X-rays come from the accretor or the inner part of the accretion disk and are evidence for nonmagnetic behavior (van Teeseling et al. 1996). GP Com also shows X-ray modulations both in flux and hardness ratio with its orbital period (van Teeseling & Verbunt 1994), which may be explained by modulations of the accretion stream onto the accreting object.
With the greater sensitivity of the XMM-Newton EPIC X-ray detectors, coupled with the onboard optical/UV telescope (optical monitor), it has been possible to study these systems in more detail. Of the seven systems so far observed (excluding HM Cnc and V407 Vul), none show any evidence of pulsations in their light curves. This implies that the spin period of the accretor is not detected or that they do not have strong magnetic fields (Ramsay et al. 2007b). The X-ray spectra are best modeled by thin thermal plasma with highly nonsolar abundances. On top of their hydrogen deficiency, many systems show significant nitrogen overabundance. The accretion luminosity determined from X-rays and UV spectra agrees with the accretion luminosity predicted for GW radiation losses. The UV luminosity (LUV) increases by a factor of 1.5 × 10³ from the longest-period (V396 Hya) to the shortest-period (ES Cet) object. This is due to hotter disks or boundary layers and is evidence of higher accretion ( ) at shorter periods (Ramsay et al. 2006).
4.2. The Ultracompact Binaries: Competing Models
The three AM CVn candidates with periods less than 15 minutes are all expected to be detected by LISA. They have remarkable properties that are different from the other AM CVn stars.
The two with shortest periods, V407 Vul (Motch & Haberl 1995; Ramsay et al. 2000) and HM Cnc (Israel et al. 1999; Ramsay et al. 2002a) were both discovered in the ROSAT survey. They are soft X-ray sources with almost identical X-ray light curves, being off for half the period, then a sharp rise to the maximum, followed with a more gradual decay. Analysis of their X-ray spectra shows that they can be modeled with almost identical blackbody temperatures of kT ∼ 65 eV for HM Cnc and kT ∼ 67 eV for V407 Vul, with the latter showing added neon with respect to solar composition (Ramsay 2008).
The observed periods are decreasing for both objects. HM Cnc has P = 321.53 s and  (Israel et al. 2004; Roelofs et al. 2010), while V407 Vul has P = 569 s and
  (Ramsay et al. 2005). No other periods have been observed with certainty for any of these objects.
The optical light curves are sinusoidal and were first reported to be in antiphase with the X-rays (Ramsay et al. 2000; Israel et al. 2004). However, observations with ULTRACAM and reprocessed X-ray light curves (Barros et al. 2007) show that the X-rays peak around 0.2 cycles after the maximum optical light for both objects, as seen in Figure 13. The optical light curves for HM Cnc show a first harmonics with a relative amplitude 15–20% of the fundamental, in phase with the X-ray peak. For V407 Vul the first harmonics is fainter and not in phase with the X-ray peak (Barros et al. 2007). After removing the sinusoidal components from the light curves, none of the objects show flickering on a level comparable with accreting binaries. This is an argument against accretion models or may indicate that most of the optical light does not actually come directly from the accretion region, but rather from the irradiated donor (Barros et al. 2007).
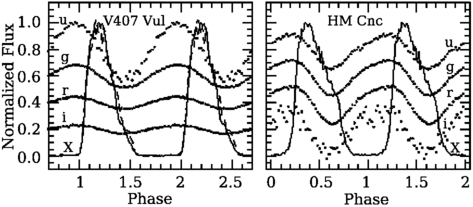
Fig. 13.— X-ray and optical light curves for V407 Vul (left) and HM Cnc (right) originally presented by Barros et al. (2007). The solid and dashed lines for V407 Vul are Chandra observations 9 months apart in 2009. (From Wood 2009, Fig. 4, with permission from M. Wood. Reproduced with permission from John Wiley & Sons, Inc.)
The optical spectrum of V407 Vul is featureless and is dominated by a G star with an on-sky separation of 0.027'', determined by pulsation astrometry (Barros et al. 2007). This star may either be in the line of sight (low probability) or, more likely, in orbit with V407 Vul with a period of 120 yr. It is definitely not in a close orbit, since no radial velocity shifts greater than 10 km s-1 have been found (Steeghs et al. 2006). If the G star is in a distant orbit, the observed period-change may be influenced, or even dominated, by light travel-time variations (Barros et al. 2007). V407 Vul has low Galactic latitude and is heavily reddened with AV ∼ 5.6 mag (Motch & Haberl 1995). The distance determination is uncertain because of the absorption and is estimated to be 1.1–3.5 kpc based on the G star (Steeghs et al. 2006). Assuming a distance of 1 kpc, Ramsay (2008) estimated an X-ray luminosity LX = 2 × 1034 - 1.6 × 1035 erg s-1. Polarization or radio flux is not detected for this object.
The optical spectrum of HM Cnc shows a blue continuum with faint emission lines of He I and He II, which were claimed to be mostly those of the He II Pickering series (Israel et al. 2002). Norton et al. (2004) noticed that the lines corresponding to even terms in the series were all stronger than the odd terms and suggested a likely blend with the Balmer series of hydrogen. This is confirmed by VLT (Mason et al. 2010) and Keck-I (Roelofs et al. 2010) observations. Non-LTE (NLTE) analysis of its spectrum, including irradiation effects, gave a possible abundance ratio 0.05 ≤ (He/H) ≤ 0.2, by number, with a best fit (He/H) = 0.1 and a low surface gravity log g = 6 of the irradiated system component. If the line emission arises from the donor's irradiated side, it could either be a low-mass white dwarf or a substellar object. Alternatively, line emission could arise from an accretion column standing several white dwarf radii above the photosphere of the accretor (Reinsch et al. 2007).
The best blackbody fit to the mean spectral flux from HM Cnc gives T1 = 32,400 K. The lowest temperature fit to the spectrum is T1 = 18,500 K, and the spectral amplitude of the pulsation gives a lower limit of Tirr > 14,800 K of the irradiated face of the donor star (Barros et al. 2007). Based on the assumption that the optical pulses of HM Cnc are due to irradiation of the secondary star, the distance becomes greater than 1.1 kpc.If it is the photosphere of the accretor rather than the X-ray site that is responsible for the heating, then the distance becomes greater than 4.2 kpc (Barros et al. 2007). This would place HM Cnc 2.5 kpc out of the Galactic plane. Time-resolved spectroscopy (Roelofs et al. 2010; Mason et al. 2010) has confirmed modulation of He I lines, both in frequency and amplitude, with a period 5.4 minutes and no other periods. This confirms it as an orbital period. The phasing indicates that the He I lines are reflected from the cooler, less massive object.
The He II spectral lines have a broad and fairly constant component, in addition to a narrow peak that moves in antiphase with the He I lines. The double-peaked emission-line He II at 4486 Å originates from a ring around the massive object, which is a definite sign of accretion. From the observed velocities, the mass ratio is calculated to q = 0.50 ± 0.13 (Roelofs et al. 2010). The donor is best modeled by a mildly degenerate white dwarf, as calculated by Deloye et al. (2007b) and shown in Figure 10.
HM Cnc is linearly polarized at a level of -2.0 ± 0.3% (Israel et al. 2004). Circular polarization is marginally detected at a level 0.5% with amplitude variations at the X-ray period. This is typical for an accretion column in a magnetic field of the order of 10 MG (Reinsch et al. 2004). The X-ray luminosity determined by Israel et al. (2004) was LX ∼ 5 × 1032 ergs s-1, assuming a distance of 500 pc. If the NLTE determined distance is used, we get 8 × 1033 ergs s-1. It is also detected at a radio frequency by the VLA with ∼96 μJ at λ = 6 cm (Ramsay et al. 2007b).
ES Cet is hydrogen-deficient and has a very blue continuum and strong He II and C IV emission lines, indicating a very hot object (Warner & Woudt 2002). The optical light curve varies with a single period of 620.2 s, with three harmonics. The stability of this period over time ( | P ˙ | < 1.5 × 10 - 11 ) (Espaillat et al. 2005) and the detection of a spectroscopic period of 620 s (Woudt & Warner 2003) suggest that this is the orbital period. Broad emission lines at every phase indicate a ringlike structure or a (thin) disk. It has much harder X-rays than the other ultracompact binaries, with indications of emission lines from N and Ne and no modulations (Strohmayer 2004b). If this is a system with a bona fide accretion disk and a small, as expected, mass ratio, we should observe a superhump period slightly longer than the orbital period; however, we do not. One explanation is that the disk may be too small to superhump or does not exist at all, which means that this may be a direct-impact system (Espaillat et al. 2005). The hard X-rays may then originate from the impact area or the boundary layer of the accretor. Since no hydrogen is detected and emission lines and hard X-rays are observed, this is a genuine AM CVn system in any case.
The observations of HM Cnc and V407 Vul may be explained by four different models, all involving a binary system. V407 Vul was first proposed as an intermediate polar (IP) (Motch & Haberl 1995) with the observed spin period of the white dwarf. Cropper et al. (1998) proposed that this is the first double-degenerate polar. Marsh & Steeghs (2002) proposed double-degenerate direct accretors, while Wu et al. (2002) proposed double-degenerate systems powered by electric currents and no mass transfer. A review of the models and how well they explain the observations is given by Cropper et al. (2004). In the following an update is given.
4.2.1. Intermediate Soft Polar
In this model (Motch & Haberl 1995; Israel et al. 1999) the pulsation period is related to the spin period of a white dwarf, accreting from a nondegenerate secondary. For IPs the white dwarf spin is asynchronous with the orbit, and typical values are Pspin ∼ 103 s and Porb ∼ 1 hr. Norton et al. (2004) argue that since only one period is observed, this means that the accretor is stream-fed, and the period observed is the beat period between the spin and orbit. Decreasing  is a common feature for IPs, explained as the spin-up due to accretion.
The X-ray light curve is explained by the systems being nearly face-on, with accretion switching from one visible pole to the other hidden pole for half the rotation period. In this case a hard X-ray component is expected as observed in other IPs, but Norton et al. (2004) argue that, unlike other IPs, the X-ray emitting regions in V407 Vul and HM Cnc are fueled purely by a stream-fed accretion flow with high accretion rates. This buries the accreting material beneath the white dwarf surface before releasing blackbody X-rays. One problem with this model is to explain the total switching off of the X-rays for half the period. The optical/X-rays phase difference of 0.2 is also difficult for this model, which predicts the optical pulse to be in antiphase with the X-ray pulse. For IPs the donor star is expected to be a main-sequence star, which normally is observed in the IR, but a donor star is not detected in these cases. The G star in V407 Vul does not qualify as a donor, since it has no measurable velocity. In the case of HM Cnc the donor must be substellar in size, most likely a brown dwarf, and it may be difficult to achieve the large mass transfer rate necessary for the observed X-ray luminosity (Reinsch et al. 2007).
The lack of observations of both the orbital and spin periods normally observed in other IPs argues against this explanation. Since the orbital period is definitely observed to be 5.4 minutes (Roelofs et al. 2010) for HM Cnc, this object cannot be an IP. The lack of emission lines makes also V407 Vul an unlikely IP candidate, in addition to no sign of an orbital period of the order of 1.5–2 hr (Steeghs et al. 2006).
4.2.2. DoubleDegenerate Polar
The difficulty of explaining the X-ray luminosity curve with the IP model (in particular, the pole-switching with no X-rays observed for half the period) led Cropper et al. (1998) to propose synchronously rotating polar systems. They are characterized by a single period (plus harmonics) in their power spectra. Since only one period is observed, a disk is not present, and the short period makes a double-degenerate system the only possibility. In order to become a stable synchronized system the accretion torque must be balanced by a MHD torque from a magnetic field of the order of a few megagauss (Ramsay et al. 2000). The secondary has to be a degenerate object, with a mass transfer rate of the order of 5 × 10⁻⁸ M⊙ yr-1. The model predicts detectable levels of optical circular polarization and strong emission lines from the accretion stream. The latter should be dominated by He, in addition to hard X-rays.
Observations have confirmed a low level of circular polarization and broadened weak emissions lines for HM Cnc, but definitely not the strong emission lines observed in many other polars. But since not all polars show such properties, these are not decisive arguments against this model (Barros et al. 2007). The negative  observed was initially viewed as an argument against accretion models, but as explained by Barros et al. (2007) and D'Antona et al. (2006), both a period decrease and a thick layer of hydrogen are possible before the minimum period is reached.
4.2.3. Unipolar Inductor, or Electric Star Model
The fact that only soft X-rays are observed, seen at that time as a definite sign of no accretion, led Wu et al. (2002) to propose a nonaccreting model. It consisted of a magnetic and nonmagnetic pair of white dwarfs that is powered by electric energy. The model assumes that the primary's spin (ω1) is not perfectly synchronous with the orbital motion (ω0), while the secondary is tidally locked to the orbit. An electromagnetic force is induced across the secondary star, which is assumed to be a perfect conductor, as it crosses the primary's magnetic field lines. A current flows between the two stars, as in the Jupiter-Io system. The emission of GW radiation injects energy in the electric circuit when ω1 ≠ ω0 and can thus sustain a permanent slight asynchronism of the primary spin. The degree of asynchronism is defined as α = ω1/ω0. The angular momentum is conserved by spin orbit coupling.
Figure 14 gives a schematic view of this model. The energy is dissipated in relatively small areas at the two footpoints of the field lines connecting the two stars. Soft X-ray emission is generated, but the geometry has to be rather special in order to allow both footpoints to come into view at the same time and then disappear gradually, but completely, in order to explain the observed X-ray light curve. This is better achieved with only one footpoint visible; however, it also creates serious constraints to the viewing angle.
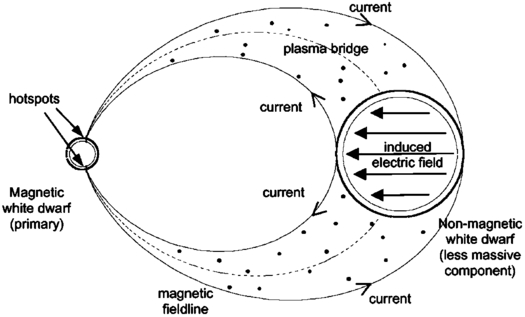
Fig. 14.— Schematic illustration of the unipolar-inductor model for a pair of white dwarfs. (From Wu 2009, Fig. 2, with permission from Y. Wu. Reproduced with permission from Research in Astronomy and Astrophysics.)
The two objects are most likely in different regimes. HM Cnc has a short orbital period and weak X-ray emission if a distance of a few hundred parsecs is accepted as proposed by (Dall'Osso et al. 2007), which necessitates α < 0. It has most likely settled in a steady state with  . An additional constraint is that the secondary object needs to have a minimum mass in order to not fill its Roche lobe at the orbital period of 321.5 s (Dall'Osso et al. 2007). If the distance is ∼2 kpc, as indicated by the NLTE spectral fits (Ramsay et al. 2007b), then a solution with α < 0.2 is marginally possible, but not so in the steady-state regime.
Additional arguments in favor of the unipolar inductor (UI) model for HM Cnc are the detection of polarization, the substellar size of the secondary, and the broad absorption lines that may originate in the irradiated photosphere of the secondary star. Furthermore, the UI model predicts radio emission generated by electron-cyclotron radiation, which is detected at the level of ∼96 μJ (Ramsay et al. 2007b).
For V407 Vul the situation is different. The longer orbital period and much smaller rate of orbital shrinking, together with the higher X-ray luminosity, give α > 1 as the only solution, i.e., the spin orbit coupling has an opposite sign to the GW torque, and a steady state is not reached. The lack of emission lines, polarization, and radio emission argue against this interpretation. On the other hand, detection is more difficult in this case because of the presence of the G star, which may also introduce timing errors for the  determination.
For both objects a large amount of asynchronization is needed to explain the large X-ray emission if the larger distances are accepted. Since the footpoints follow the orbit ω0 and the spin ω1 is different, a beat period between these periods is expected, but so far has not been observed.
The unipolar-inductor model explains most of the observed quantities. Of some concern is the geometrical shape of the magnetic field and the size and structure of the footpoints. For HM Cnc the double S-wave is a definite sign of accretion (Roelofs et al. 2010), which makes the UI model unlikely for this star.
Another concern is the lifetime of a unipolar inductor. According to Wu et al. (2002), the synchronization timescale (τα) is of the order of 103 yr—and then the current is shut off. Dall'Osso et al. (2007) concluded that the lifetime before synchronization is less than 3 × 10⁵ yr, but still compatible with the population constraints. In any case, since the orbital period will decrease due to loss of GW radiation, the system will desynchronize and the current will switch on. After some on/off events the system may eventually reach an asymptotic regime.
4.2.4. Direct-Impact Model
As indicated previously, ES Cet has all the properties of a direct-impact binary. This is also the case for HM Cnc and V407 Vul, as proposed independently by Marsh & Steeghs (2002) and Ramsay et al. (2002a). In this model none of the white dwarfs are magnetic, and the ballistic mass stream impacts directly onto the surface of the accretor. This happens if the minimum distance of the ballistic gas stream from the center of mass of the accretor is smaller than the radius of the accretor, as is the case for Algol-type binaries where the donor is a normal star. This model immediately explains the absence of polarization and the X-ray pulse shape.
The accretion-stream impact spot is fixed in the binary corotating frame and is located on the accretor's equator, with an impact angle as a function of the mass ratio of the two stars and the radius and mass of the accretor. The impact angle, which is defined as the angle between the X-ray emission site and the secondary star, has to be between 80° and 130°. The observed impact angles of about 95° for HM Cnc and 110° for V407 Vul give the following constraints on the masses (Barros et al. 2007).
HM Cnc:

V407 Vul:

According to the model, the accretion stream is narrow (∼10-4 R⊙ or ≤ 1.2 × 10⁵ km2). The density of the accreted material is high enough to penetrate below the surface and thermalize to soft X-rays. This is confirmed by use of a smooth-particle hydrodynamics (SPH) code by Dolence et al. (2008) using system parameters proposed by Marsh & Steeghs (2002). The supersonic stream impacts the white dwarf atmosphere in a near horizontal trajectory. The shock-heated surface fluid is carried away (downward) from the impact point, and fresh material will be drained from the surrounding atmosphere. Dolence et al. (2008) find that 99% of the flux is contained in an area f3σ = 8.5 × 10⁻⁵ R⊙ as required by the direct-impact (DI) model. The ram pressure of the stream is high enough to make it penetrate to about 100 km depth, and the up-dwelling of hot (∼65 eV) material will produce the soft X-rays observed about 60–65° downstream from the impact point. Simulations show (Wood 2009) that two X-ray spots, one for the accretion point and one for the up-dwelling, are necessary to explain the sharp rise and first more gradual, then sharp, fall of the X-ray light curve (Fig. 13). The up-dwelled material is distributed further downstream and cooled by radiation and mixed with the existing atmosphere and will, in the end, cover more than half the circumference of the star. The basic shape of the optical light curves can be fitted by this simple model (Wood 2009), but for HM Cnc excess light it is found at phase ∼340°, which corresponds to the back side of the donor star. For V407 Vul the match is good for the u' light curve, but the other light curves are diluted by the light from the G star.
The main argument against the DI model has been the observed  , which is not what is expected for AM CVn stars. One explanation is that GW radiation is dominating and the star is still not transferring mass fast enough to stop the period decrease, as explained previously. If one assumes for HM Cnc that q ∼ 0.5 and the
  is due to GW radiation only, one gets M1 = 0.55 M⊙ and M2 = 0.27 M⊙ (Roelofs et al. 2010). Works of Deloye et al. (2007b) and D'Antona et al. (2006) show that a contracting lower-mass secondary also can yield a negative rate of period change and a steady accretion rate for a time long enough to be observable.
Another problem is the observed hydrogen in the spectrum of HM Cnc. D'Antona et al. (2006) proposed a low-mass helium WD donor with a hydrogen envelope with p - p burning at its base. When mass transfer starts, the hydrogen burning is still going on, and the orbit will decrease to a minimum of P ∼ 4.7 minutes. The hydrogen present in HM Cnc favors this model, but not the high donor mass determined by Roelofs et al. (2010). The detected polarization and radio emission indicate that HM Cnc also has a weak magnetic field (Reinsch et al. 2004), but with the high ram pressure created by the accretion stream, a weak magnetic field cannot change much.
The extra light in the optical light curve also needs to be explained. According to Ramsay et al. (2006) the ratio LUV/LX increases with shorter orbital periods, but HM Cnc has far stronger relative LX than the other AM CVn stars. The hydrogen abundance makes HM Cnc look more like an evolved CV, and since normal CVs show less UV with shorter orbits, this may explain the LX/LUV anomaly.
The direct-impact model explains most of the observations with the least assumptions. Even details in the light curves may be explained in the future by 3D modeling of the flow between the stars (Wood 2009).
4.3. Spectra of Disk and Accretor
Apart from the stars with ultrashort periods (HM Cnc, V407 Vul, and ES Cet), the spectra AM CVn stars can be divided into three groups. For P < 20 minutes we observe spectra showing broad helium absorption lines on top of a hot (Teff ∼ 30000 K) blue continuum. The objects AM CVn and HP Lib show low-amplitude photometric variations, and time-resolved spectroscopy reveal spectral variations on several timescales.
For P > 40 minutes the spectra are dominated by strong helium emission lines on top of a blue T ∼ 10,000 K continuum. Small photometric variations are observed.
For stars with orbital periods between 20 and 40 minutes, the spectra changes from a high state with absorption lines to a low state with emission lines. This is demonstrated in Figure 15 for V803 Cen, showing both high- and low-state spectra taken on successive nights. For this star the difference between high and low states can be as much as 5 mag. In the absorption-line spectra we also find broad lines that may come from iron. The double-peaked emission lines and flat double-bottom absorption lines are typical disk line profiles.
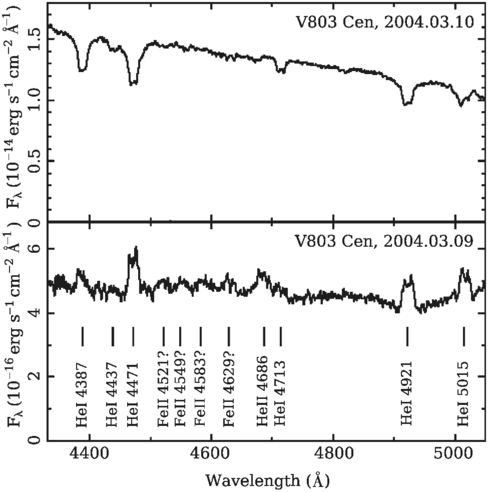
Fig. 15.— New Technology Telescope spectra of V803 Cen taken one day apart. The bottom panel shows the low state (V = 17.2) with emission lines and the top panel shows the high state (V = 14) with absorption lines. (From Roelofs et al. 2007a, Fig. 2, with permission from G. Roelofs. Reproduced with permission from John Wiley & Sons, Inc.)
A remarkable paper on the spectral properties of AM CVn was published by Voikhanskaya (1982). She observed in the prime focus of the 6 m telescope of the Special Astrophysical Observatory in Crimea and noted many details in the spectrum that have much later been confirmed. In addition to the broad He I lines, she identified an emission feature at 4640 Å as the C III–N III blend. This is also observed in many X-ray sources, as well as the faint He II emission at 4686 Å. She also noted emission peaks inside the He I absorption lines that moved with time and that the absorption-line edges also moved with time. The movement of the absorption-line edges later revealed a 13.4 hr precession period of the disk (Patterson et al. 1993). It is also found that the emission peak variability shows an S-wave with a period 1029 s, identified as the orbital period (Nelemans et al. 2001b; Roelofs et al. 2006b).
In the following subsections I will discuss disk atmosphere spectral models, UV spectra, and the chemical composition as a diagnostic tool.
4.3.1. Disk Atmosphere Models
The main contribution to the flux observed in the optical and UV regions for most AM CVn stars is from the disk. There have been several attempts to model the disk spectra for AM CVn systems:
Tsugawa & Osaki (1997) calculated the thermal-tidal instability cycle for helium disks as a function of orbital period and predicted that the mass transfer rates for AM CVn and HP Lib are high enough to be in a stable superoutburst state, while AM CVn stars with longer orbital periods should be in the unstable dwarf nova state. The tidal instability generates the superhump phenomena (see § 4.6), while the thermal instability generates the outburst observed for AM CVn stars with periods between 20 and 40 minutes.
The outburst cycle starts with cold accretion via RLOF. This causes the surface density and temperature of the disk to increase. At some point T > Tcrit, which is the ionization temperature of He in this case. This changes the opacity and the viscosity in the disk, and a heating front sweeps through the disk and ionizes helium. At outburst maximum, the disk is hot. Since the disk is thinner and colder in the outer part, this cools first, and a cooling front moves inward and the disk changes back to its cold state.
So far, only spectra of stationary disks have been calculated. Semionovas & Solheim (1999) calculated a model grid of hydrogen-helium NLTE disks and applied it to four of the AM CVn systems. El-Khoury & Wickramasinghe (2000) calculated a LTE model grid of hydrogen-helium disks in the optical range and applied it to AM CVn and CR Boo. Nasser et al. (2001) calculated NLTE H/He-disk spectra for some AM CVn systems in the optical wavelength range, varying the mass accretion rate  . Nagel et al. (2004) analyzed the optical spectrum of AM CVn itself, using their own metal-blanketed NLTE disk models containing H, He, C, N, O, and Si. An extended grid of these models covering the range of
  to 10-11 M⊙ yr-1 (with M from 0.6 to 1.4 M⊙ and abundance variations) has been computed by Nagel et al. (2009) and tested on the low-state object V396 Hya.
The disk model calculations are based on the α-disk approximation of Shakura & Sunyaev (1973) assuming a stationary geometrically thin disk, where the disk thickness is much smaller than the disk diameter. This allows for decoupling the vertical and radial structures and, together with the assumption of axial symmetry, the disk can be separated into concentric rings, with effective temperature:
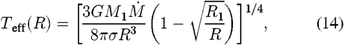
where G is the gravitational constant and σ is the Stefan-Boltzmann constant.
For a complete disk, important parameters are  , M1, the radius of the accretor R1, and the outer radius of the disk, which is assumed to be the tidal radius (Warner 1995):
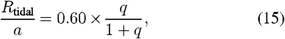
when 0.03 < q < 1, in addition to inclination and chemical abundances. Irradiation of the inner part of the disk by the primary may increase the temperature of the inner part, but changes the spectrum only slightly (Nagel et al. 2009). In order to compare disk models with observations, spectra of various rings are added and convolved with an instrument profile and corrected for distance and reddening.
 and M1 are the most important parameters. Low
  gives emission-line spectra. The total flux increases with M1. If
  is high we get absorption-line spectra and only the most massive primary may be detected, primarily in the UV (Nagel et al. 2009). The relation between
  , M, and inclination i is demonstrated in Figure 16. The accretion disk dominates at all wavelengths for high accretion rates. For
  the white dwarf will appear in the UV if the inclination is low. It may be possible to detect absorption lines from the DB accretor, as is demonstrated in Figure 17 for J1411.
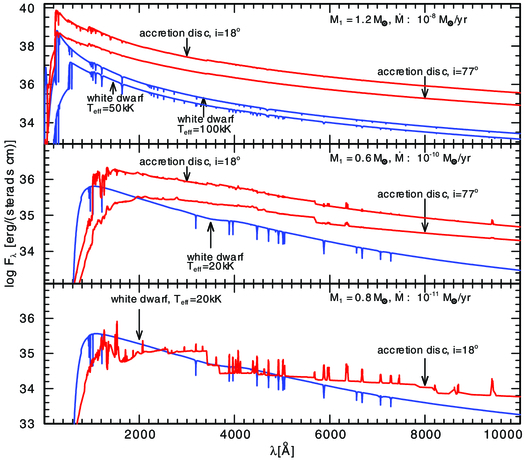
Fig. 16.— Comparison of spectra of accretion disks and white dwarfs. Top panel: disk extends between 1.3 and 20 R1. Middle panel: disk extends between 1.3 and 12.5 R1. Bottom panel: disk extends between 1.3 and 18 R1. In the upper panels i = 18° and 77°, and in the bottom panel i = 18°. (Credit Nagel et al. 2009, Fig 14. Reproduced with permission from T. Nagel and ©ESO.)
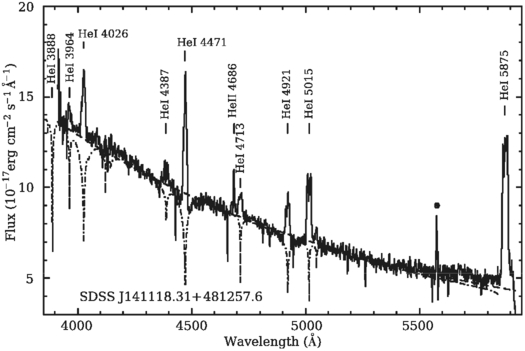
Fig. 17.— Average MMT spectrum of J1411 overplotted on a 16,000 K blackbody (dashed line) and a 16,000 K, log g = 8 DB model (dash-dotted line). (From P. Groot, in preparation.)
An example of a disk model fit to a low-mass transfer star is calculated by Nagel et al. (2009). Figure 18 shows the observed and modeled spectra of V396 Hya, the AM CVn star with the largest orbital period, and smallest  . The profiles of the spectral lines are variable on a timescale of a few minutes–probably due to a rotating bright spot in the accreting stream (Nagel et al. 2009). Because of absence of Si lines in UV and in optical spectra (Gänsicke et al. 2003), this star is most likely a Population II object. The best disk model fit had
  and an accretor with T = 20,000 K, which is considerably higher than for other long-period AM CVn stars (Table 2).
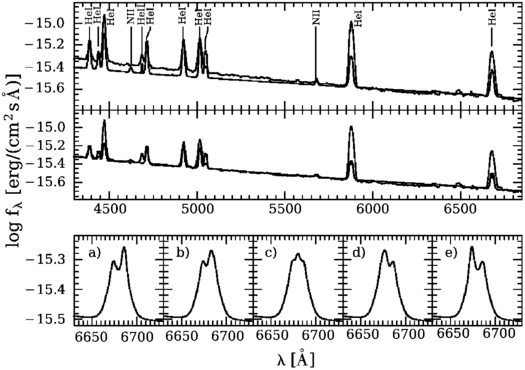
Fig. 18.— Observed and modeled spectra of V396 Hya. Top panel: Observed (thick line) and modeled (thin line) spectra of an accretion disk with  and 0.0001 Si, including a boundary layer and a bright spot. Middle panel: Observations and model of accretion disk, without boundary layer and bright spot, but including a white dwarf accretor with Teff = 20 kK and log g = 8.3. Lower panels: Changes of line profile for the He I line at 6678 Å as a function of the orbit. The bright spot moves away from the observer in panel a and toward the observer in panel e. Inclination for both models is i = 18°. (Credit Nagel et al. 2009, Fig 16. Reproduced with the permissions from T. Nagel and ©ESO.)
4.3.2. UV-Spectra Interpretations
UV studies of bright AM CVn stars were done with IUE (Solheim 1993), and this has been repeated for AM CVn itself with HST (Solheim et al. 1997; Sion et al. 2006; Wade et al. 2007). A spectral energy distribution (SED) of AM CVn from UV to IR is shown in Figure 19. This is a combination of four points from FUSE (λλ1100–1150), a low-resolution Space Telescope Imaging Spectrograph (STIS) spectrum between 1150 and 3150 Å, spectrophotometric data from the Hale telescope in the visual, and 2MASS data in the IR (Wade et al. 2007). The spectrum is almost flat in fν below 4500 Å, and is modeled with a blackbody disk or a disk based on interpolated helium-star atmosphere models. With the HST distance of 606 pc (Table 1) the fit is quite poor, thus indicating that something either in the disk fitting procedure or distance determination is wrong.
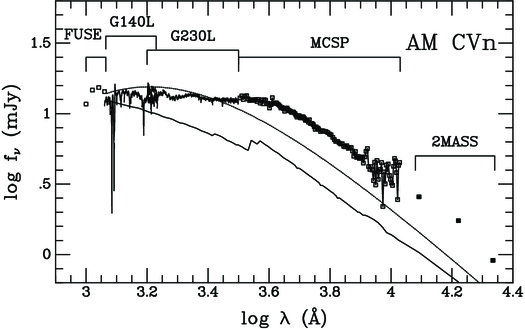
Fig. 19.— SED of AM CVn from various sources, as explained in the text. No correction is made for interstellar extinction. The upper dotted curve is a blackbody disk. The lower solid line is a disk atmosphere model from interpolated spectra of pure helium white dwarf model atmospheres. Parameters for both are as in Table 1. (From Wade et al. 2007, Fig. 11, with permission from R. Wade. Reproduced with permission of the AAS.)
A better fit for a higher-resolution spectrum of AM CVn is obtained by Nagel et al. (2004) for the visual range and by Kusterer et al. (2008) for the UV range, including a Monte Carlo modeled disk-wind spectrum. Some UV line profiles are shown in Figure 20. For some lines P-Cygni (wind) profiles are apparent. The line profiles are asymmetric and blue-shifted, except in the interstellar Lyα line. This is consistent with a biconical wind from the accretion disk, viewed at an intermediate angle. The UV light curve shows a steady decline of ∼20% during 2 hr of STIS observations (Wade et al. 2007). This may be related to variations up to 0.5 mag and rare flares observed in the visual (Solheim 1995). Finally, the UV observations of AM CVn reveal white light variations, including a 27 s moderately coherent oscillation, which may be analog to dwarf nova oscillations observed in ordinary CVs with periods of 8–40 s. Such short-period variations may relate to blobs in the inner part of the disk or in the accretion stream (Wade et al. 2007; Warner & Woudt 2008).
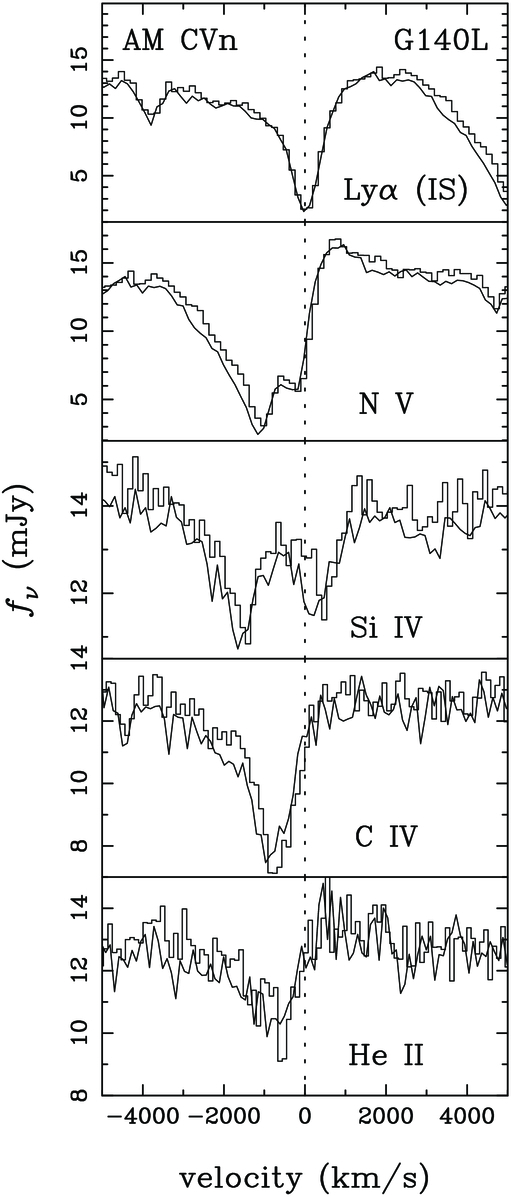
Fig. 20.— Comparison of wind profiles for AM CVn at two epochs 10 minutes apart. The zero-velocity wavelengths for each multiplet is shown as a vertical dashed line. The top panel shows the interstellar Lyα line. (From Wade et al. 2007, Fig. 5, with permission from R. Wade. Reproduced with permission of the AAS.)
The first HST time-resolved UV spectra of the emission-line object GP Com were observed by Marsh et al. (1995). They detected three high-velocity flares in the dominant N V emission line during 13 hr of observations. The flares may be explained as a response to rapid variations in X-ray emission, driving the emission lines by photoionization and recombination. The flare spectrum revealed C IV emission at a level of 0.094 times the N V flux. This was the first detection of carbon in this object. No Si or other heavier elements were found. As part of a snapshot program with HST, an UV spectrum of the similar emission-line object V395 Hya also displayed a strong N V emission line, but no detectable C IV or Si (Gänsicke et al. 2003). The underabundance or lack of carbon is interpreted as a result of CNO processes in the donor that convert C and O to N.
The first UV detection of an accretor were done by Sion et al. (2006). They showed that HST spectra of CP Eri were best fitted by a hybrid composition DBAZ white dwarf atmosphere model with a low metallicity and a H/He abundance ∼10-3 by number.
4.4. Chemical Composition and Evolution
One of the exiting aspects of AM CVn stars is that the mass that is transported through the disk and accreted on the white dwarf is peeled off the donor star, layer by layer, revealing its interior. The chemical composition of the disk will therefore give us clues on the evolution of the donor star and its origin. Using detailed evolutionary calculations Nelemans et al. (2010) show that the three channels lead to some differences in the chemical composition, which is an important factor that may help in identifying the progenitors.
First, traces of hydrogen are expected in the hydrogen-star channel, where the H/He ratio may vary by 2 orders of magnitude, but may drop to zero in extreme cases. A rather narrow range of CNO element variations is expected. In this channel we may find XN > XO > XC.
In the white dwarf channel the secondary is a helium white dwarf, with CNO abundances according to the equilibrium of the CNO cycle, since no burning takes place after the CE terminates. The relative ratios of these elements depend on the temperature of the stellar core, which is a function of the progenitor mass and metallicity. Again, the models give XN > XO > XC, but there is a possibility of a hybrid composition with donors having a C/O core and thick He-C-O mantle surrounded by some H in the outmost layers. The hybrids are remnants of low- and intermediate-mass stars that overflow their Roche lobes prior to nondegenerate helium ignition in the core. They lose their H and He layers very fast, and a distinct property will be the absence of N. The composition of such a hybrid will be XO ∼ 0.9, XC ∼ 0.1, and XNe ∼ 0.05.
Finally, in the helium-star channel, helium still burns at the time RLOF starts. However, since the mass transfer strongly suppresses the helium burning, the chemical composition depends critically on the moment the helium star fills its Roche lobe. Before the period minimum, the star loses matter outside the convective core in the helium-burning stage. This material is helium-rich with CNO-cycle equilibrium for relative massive progenitors. Shortly after period minimum, helium-burning products in the form of C and O come to the surface and may even dominate over He.
An example of how the abundance ratios N/C vary as a function of the orbital period is shown in Figure 21. Based on the classification scheme in Nelemans et al. (2010) and other possibilities discussed previously, we can suggest birth channels for some AM CVn stars:
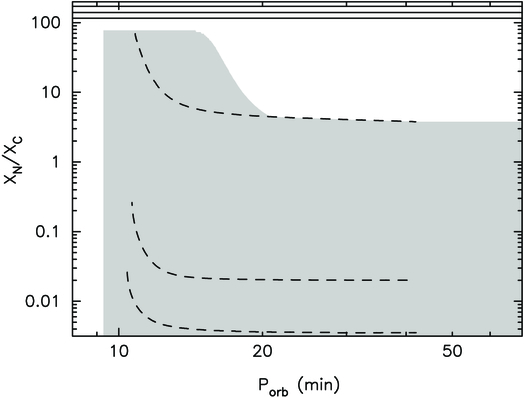
Fig. 21.— Abundance ratios XN/XC by mass for helium white dwarf donors (solid lines near the top) with descendants of stars with mass 1, 1.5, and 2 M⊙ downward. Helium-star donor tracks with initial orbital periods of 20, 80, and 120 minutes are also shown (dashed lines). The shaded area defines the possible ratios for helium-star donors, and it extends to zero. (From Nelemans et al. 2010, Fig. 11, with permission from G. Nelemans. Reproduced with permission from John Wiley & Sons, Inc.)
HM Cnc.—With 0.05 < He/H ≤ 0.2 (Reinsch et al. 2007), this could be a low-mass helium white dwarf donor with a thick hydrogen burning layer as proposed by D'Antona et al. (2006). Underabundance of nitrogen was reported by Strohmayer (2008) based on X-ray spectra, but N is later detected in Keck-I spectra (Roelofs et al. 2010) which indicated a massive, mildly degenerate white dwarf donor as the only solution (see Fig. 10). An evolved CV, with a rather specific choice of parameters, may also be marginally possible (L. Yungelson 2010, private communication).
CP Eri.—With He/H ∼ 103 (by number) (Sion et al. 2006) and P ∼ 28 minutes, it fits a hydrogen-star channel donor past the period minimum of P ∼ 20 minutes. XO ∼ XC ∼ 0.1 is then expected (Nelemans et al. 2010).
The two high-state absorption-line systems, AM CVn and HP Lib, have CNO processed material. IUE spectra of HP Lib show O, both have N and Si, and maybe also Mg and Fe. They most likely belong to the helium-star channel, with AM CVn having the most massive donor, while the case for HP Lib is more uncertain (Fig. 10).
The dwarf novae CR Boo and V803 Cen have increased N, while V803 Cen also shows O in IUE spectra. Ratios are not determined, but for both, a helium-star secondary is most likely, given the high donor mass (Fig. 10).
For GP Com and V396 Hya the ratio N/C > 10 (Marsh et al. 1991; Gänsicke et al. 2003), and helium high-mass white dwarf secondaries are the only options (Nelemans et al. 2010), but since they do not show Si and other heavy elements, a low-metallicity progenitor is needed, and it is proposed that they belong to the halo population (Marsh et al. 1991; Ruiz et al. 2001).
For J1240 N/C > 1, and for J0804, it is greater than 10, which in both cases indicate helium white dwarf donors.
Finally, two of the stars cannot be classified, because no C, N, or O is detected. Those areJ0902, which has He, Fe, and Si, and V406 Hya, which shows He, Fe, Si, Ca, and Na. For the other AM CVn stars no element ratios are determined yet, but other parameters may give hints about evolutionary channels.
Observational tests to determine formation channels are very important to better understand the evolution of the AM CVn stars. So far, most spectral analysis have been done in the blue or visual part of the spectrum. A more systematic study of the red and infrared parts of the spectrum, in addition to space UV, should give us possibilities to explore the opportunities for abundance classification more completely and do so for more AM CVn stars.
4.5. Doppler Tomography and Spikes: Orbital Periods and Mass Ratios
Time-resolved spectroscopy of a binary system provides information on the system observed from various angles. For systems not observed face-on, the line profiles will change with viewing angles, and this may give us information of the geometry of the system (Doppler tomography). The main tool is to produce and analyze a velocity–density map. The conversion between geometrical and velocity coordinates is demonstrated in Figure 22, which explains the key locations in a binary system with mass transfer. The ballistic stream from the inner Lagrangian point L1 hits the outer edge of the disk and ploughs into the disk, generating a bright spot with a shape and structure that may reveal disk properties. The light from the bright spot generates a signal in the light curve that will be modulated with a combination of the orbital and stream velocities. The K1 velocity may be observed as a low-velocity spike in antiphase to the impact-point modulation. In the Doppler map we observe the disk inside-out, since the inner parts have the highest velocities.
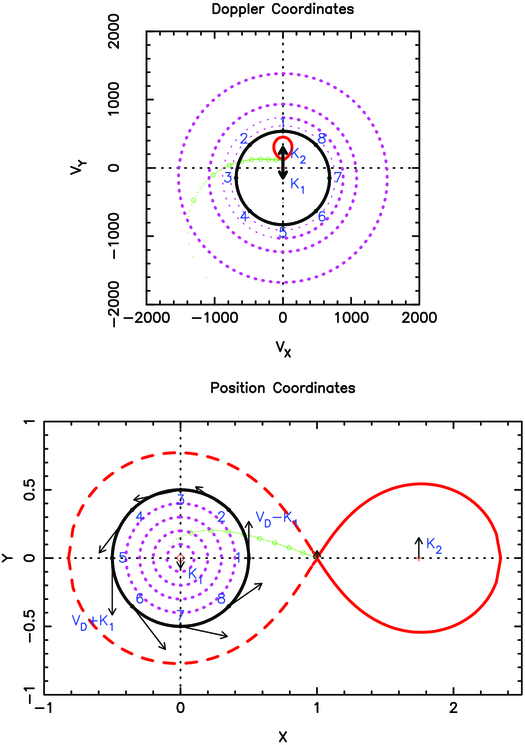
Fig. 22.— Key locations in position coordinates (lower panel) and Doppler coordinates (upper panel). The accretor has velocity K1 and the donor K2. VD is the disk velocity. The ballistic stream is marked by circles from the L1 point into the disk. Points on the outer rim on the disk are marked with numbers. (Prepared by K. Horne and D. Steeghs, used with their permission.)
The question of the orbital period of AM CVn itself was discussed for a long time before time-resolved spectra finally were analyzed by Nelemans et al. (2001b), and an S-wave emission feature was discovered with a periodic modulation of 1028.7 s, which then became the confirmed orbital period. In Figure 23 the location of the bright spot is shown as the gray-scale feature in a relative velocity diagram for AM CVn. The fully drawn small closed curve is the expected location of the donor star based on a specific mass solution. The dashed circle is the location of the outer edge of the accreting disk. The accreting stream starts from the inner Lagrangian point and hits the disk with Vx ∼ 400 km s-1. Phase-binned spectra of AM CVn in Figure 24 also show the presence of a central spike moving with a semi-amplitude of 92 km s-1 in antiphase with the S-curves (Roelofs et al. 2006b).
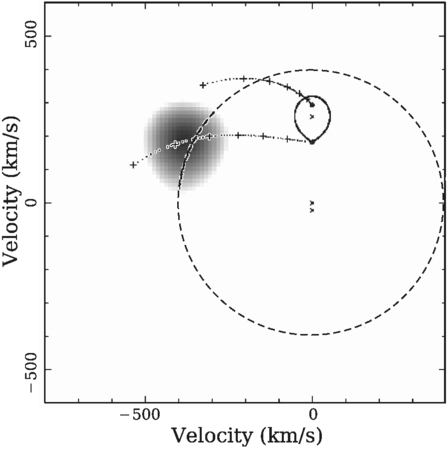
Fig. 23.— The measured bright spot velocity of AM CVn is shown on a gray scale. The lower dotted line, starting from the inner Lagrangian point, represents the accretion stream from the donor to the outer edge of the disk. The velocities of the outer rim of the disk are shown as a dashed line. The upper solid line, starting inside the donor, represents the Keplerian accretion-disk velocities along the ballistic stream trajectory. The bright spot has to be located between those trajectories, and in this case it is found close to the ballistic trajectory. The central cross is the velocity of the mass center, and the crosses above and below give the K2 and K1 velocities, respectively. (From Nelemans et al. 2001b, Fig. 6, with permission from G. Nelemans. Reproduced with permission from John Wiley & Sons, Inc.)
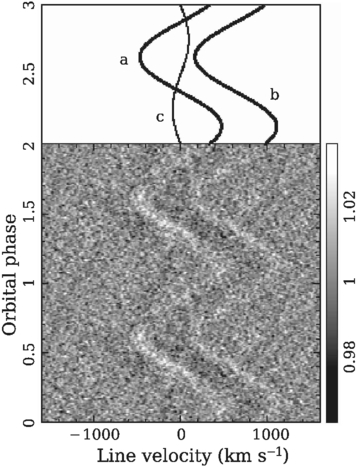
Fig. 24.— Phase-binned average-subtracted spectra of AM CVn around the He Iline at 4471 Å. The bright spot trails around zero velocity (component a), in phase with the bright spot from the nearby Mg II line at 4481 Å (component b). In addition, there is a weak component c moving around 30 km/s with a semi-amplitude of 92 ± 5 km s-1 and opposite in phase relative to the bright spot. This is the spike, which is more clearly observed in low-mass transfer objects with longer periods. (From Roelofs et al. 2006b, Fig 3, with permission from G. Roelofs. Reproduced with permission from John Wiley & Sons, Inc.)
By using the velocity amplitude and phases of the central spike and the bright spot, Roelofs et al. (2006b) constrained the mass ratio and the effective accretion-disk radius for AM CVn, as demonstrated in Figure 25. The velocities observed may either be the stream velocity, the Keplerian velocity at the impact spot, or a combination. If interpreted as Keplerian velocity, the disk becomes too small with respect to the 3∶1 resonance radius, which is the source of the disk precession, which again generates the superhump period. If the velocities originate in a ballistic stream, we get the conditions shown in Figure 25, which gives q≥0.18 ± 0.01. This is considerably higher than obtained from superhump-period ratios earlier and shown in the figure. Similar analysis of the bright spot is done for a few other AM CVn stars, and the results are included in Table 2 as dynamical determinations of q.
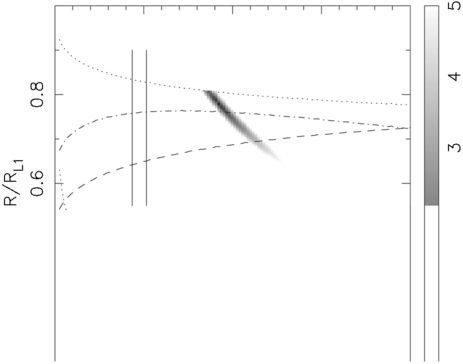
Fig. 25.— Mass ratio q and effective radius R of AM CVn based on observed velocities and phases, assuming pure ballistic velocities. The gray scale shows confidence levels. The upper and lower dotted lines indicate the edges of the primary Roche lobe and the circularization radius, while the dashed line shows the 3∶1 resonance radius in the disk. The dash-dotted line indicates the tidal truncation radius of the disk. The labels NGS01 and P05 indicate q estimates based on AM CVn's superhump behavior (see § 4.6). (From Roelofs et al. 2006b, Fig. 6, with permission from G. Roelofs. Reproduced with permission from John Wiley & Sons, Inc.)
Figure 18 shows how the line profile of a disk emission line varies with the orbital period. Such variations were first observed in the spectrum of GP Com by Nather (1985) and explored in more detail by Marsh (1999), who also demonstrated that Doppler tomograms show slightly different behavior in different emission lines, apparently due to the structure and temperature gradient in the disk. For GP Com, Marsh (1999) discovered a central spike with a velocity amplitude of 10.6 ± 1.6 km s-1. Figure 26 shows emission-line profiles of GP Com and V396 Hya, both with an inner disk velocity of near 1000 km s-1 and a central spike of near-zero velocity. The most likely source of the spike is on the surface or in the boundary layer of the accreting white dwarf.
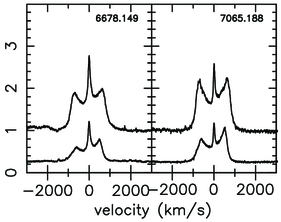
Fig. 26.— Helium emission-line profiles for AM CVn stars with low accretion rates. The top profile is for GP Com (Morales-Rueda et al. 2003), and the bottom one is V396 Hya. Both show a double-humped profile with a central spike of near-zero velocity, which may originate from a point near the surface of the accretor. (From P. Groot, in preparation.)
Further refinement of this technique gives values for the eccentricity of the disk for AM CVn as e = 0.04 ± 0.01 and shows how the eccentricity and alignment of the disk varies with the precession period of 13.6 hr (Roelofs et al. 2006b). This is in contrast to investigations by Morales-Rueda et al. (2003), who showed that the outer part of the disk of GP Com has an eccentricity e ∼ 0.6, while the inner part is more circular.
4.6. Superhumps and (q) Relations
All known AM CVn stars, except one, have currently determined mass ratios, q < 0.2. Simulations have shown (Whitehurst 1988) that disks in CVs with such small mass ratios will develop asymmetries due to tidal stress produced by parametric resonance between particle orbits and an orbiting secondary star with a 1∶3 period ratio. The initially circular disk is deformed into a slowly precessing disk. This produces a signal in the light curve, at the superhump period, which is usually observed being a few percent longer than the orbital period (positive superhump). The period is not stable, but changes slightly in the course of an outburst (Patterson et al. 2005). A harmonic structure in the observed photometric periods is interpreted as a sign of disk response (Solheim & Provencal 1998a).
Tidal instability for helium disks stars was calculated by Tsugawa & Osaki (1997), based on work on SU UMa stars' instabilities by Hirose & Osaki (1990). The following approximate formula for the relation between the beat period and the orbital period was calculated by Warner (1995):
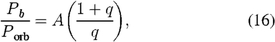
where A ∼ 3.85 for 0.1 ≲ q ≤ 0.22, A ∼ 3.73 for q ≲ 0.1, and Pb = Psu·Porb/(Psu - Porb).
Using this relation and a mass-radius relationship for the secondary, whose radius is determined from the Roche Lobe size at the observed period, the mass of the primary object can be estimated. For the SU UMa stars this equation showed good agreement with observations (Warner 1995), and for a long time it was the main tool for mass determination of AM CVn stars.
For the AM CVn stars, 3-D SPH models of helium accretion disks with small q values were simulated by Simpson & Wood (1998). They also calculated energy-production time series that display remarkable similarities with the observed light curves. These calculations show that the disk changes its shape from circular to elliptical or pear-shaped during one orbital revolution and that the stress in the disk produces more energy when it is noncircular. This leads to pulse profiles variations that can be compared with the observed profiles from the light curves.
From the SPH simulations it was also found that spiral shocks appear near the outer edges of the disks and that the appearances of spiral shocks will have a noticeable effect on the light curve, producing higher harmonics in the Fourier transform of the light curve (Simpson & Wood 1998). They also showed that the amplitudes of the harmonics are sensitive to the angle of inclination and that time-series amplitude spectra for inclination angles i < 45° are dominated by the superhump frequency, while linear combinations of the superhump and orbital frequencies appear at higher inclinations. SPH simulations of a precessing accretion disk in a q = 0.1 binary system by Foulkes et al. (2004) reveal complex and continuously varying shape, kinematics, and dissipation. The resulting light curve roughly repeats on the superhump period, but evolves continuously from cycle to cycle.
An empirical approach to determine the mass ratio from superhumps is developed by Patterson et al. (2005), who demonstrated that ordinary CVs follow this relation with great precision for 0.005 < q < 0.38:

where the observed superhump-period difference is defined by
For AM CVn stars we observed superhumps for outbursting objects with absorption spectra, as shown in Table 4. For V803 Cen the period ∼1618 s was observed when the star was in a high state, while a period ∼1611 s, was observed when the star was in the low state and was interpreted as the orbital period for a long time. However, phase-resolved spectroscopy, which resulted in the average spectra shown in Figure 15, gave an orbital period 1596.4 s (Roelofs et al. 2007a). Patterson et al. (2000b) found the superhump present at least 4000 periods after outburst, but with decreasing period.
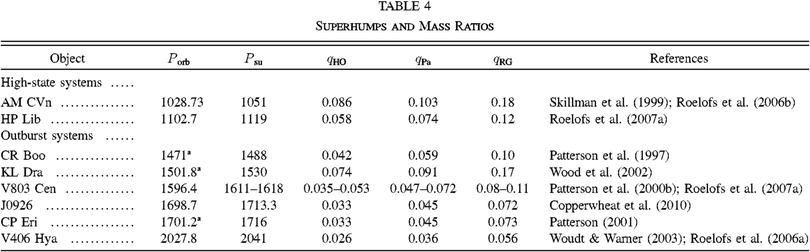 |
The same happened for CR Boo (Patterson et al. 1997), where periodic signals in the range 1484–1495 s were observed in addition to P = 1471 s, which always kept its phase. The former signals were then interpreted as a variable superhump period, while the latter were interpreted as the orbital period. For KL Dra, two periods are also observed and interpreted the same way (Wood et al. 2002).
Figure 27 shows the relation between the superhump-period excess and the orbital period. For the AM CVn stars with orbital periods determined dynamically, there is a hint of a relation between orbital period and , shown with the dashed line, if the minimum superhump period is used. KL Dra does not fit this relation. This may indicate that the orbital period determined from photometry in this case is a superhump period, and the orbital period remains to be found.
Fig. 27.— Superhump excess (eq. [18]) as a function of orbital period. The dashed line is drawn between stars with Porb determined kinematically. The bars illustrate observed ranges in .
AM CVn is the only superhumper with dynamical mass-ratio determination. Roelofs et al. (2006b) found the following relation:

which is quite different from the relation determined by Patterson et al. (2005) (eq. [17]). Table 4 shows the superhump periods determined and the three q values that can be calculated with equations (16), (17), and (19), respectively, which can be compared in the future with mass ratios determined dynamically or with other methods (see § 4.7).
However, Pearson (2007) has pointed out that the relations obtained by Hirose & Osaki (1990) (eq. [16]) are incomplete because they only included the dynamic term ωdyn in the equation

where ωpres is a pressure term that depends on how hard the spiral arms are wound up in the disk:
where ωp is the orbital angular frequency of disk material at radius r, and β is the pitch angle of the induced spiral wave.
Pearson (2007) developed a relation that fits well to the CV superhumpers of the SU UMa class, but when this is applied to AM CVn stars, the Tutukov-Federova mass-radius relation (eq. [10]) produced unacceptably high M1 values, while the degenerate relation (eq. [9]) produced too-low M1. The value q = 0.18 for AM CVn determined by dynamics (Fig. 25) is much higher than any values predicted by the superhump analysis of Pearson (2007). He could only make a fit by tightening the spiral structure to β ∼ 10°, which is the opposite of what is found for SU UMa stars, where smaller mass ratios lead to less tight spirals. An explanation of the failure in extrapolation of the SU UMa empirical relation may, according to Pearson (2007), be the lack of a unique M - R relation for AM CVn stars. The wide spectrum of M - R relations as calculated by Deloye et al. (2005, 2007b) for white dwarf donors and the M - R relation, which change as the donors cool and their degeneracy changes (Yungelson 2008), make it important to determine the q values dynamically for more systems. As long as we do not have a solution to this problem, we may do as recommended by Roelofs et al. (2007b) and use the relation in equation (19) with a huge error (50% or more).
4.7. Finally, a Good Clock: An Eclipsing AM CVn Star
The first confirmed eclipsing AM CVn system (J0926) was presented by Anderson et al. (2005). It was found in a search for helium emission-line stars in the SDSS and has a period of 28.31 ± 0.01 minutes and a sharp eclipse of about 1 mag lasting about 40 s at full width half-maximum. Observations with ULTRACAM during three nights in March 2006 (Marsh et al. 2007) showed superhump features that moved relative to the eclipse with a slightly longer period. The best fit from light-curve modeling is a partial eclipse of the white dwarf and a total eclipse of the bright spot. Including data from 2009 gave the following parameters: q = 0.041 ± 0.002, inclination i = 82.6 ± 0.03°, and donor radius R2 = 0.047 ± 0.001 R⊙. The primary mass became M1 = 0.85 ± 0.04 M⊙, and the donor mass became M2 = 0.035 ± 0.003 M⊙ (Copperwheat et al. 2010). The donor mass is substantially larger than that for a fully degenerate white dwarf, which means that it contains a significant level of thermal energy (Marsh et al. 2007). As seen in Figure 10, the donor-mass determination places it close to the least degenerate white dwarf donor or as a semidegenerate helium-star donor. It may also be an evolved CV system (Copperwheat et al. 2010). If chemical abundances can be determined, this may solve the evolution-channel dilemma for this star.
In the 2006 data set a superhump period of 1713.3 s was clearly detected, but in the 2009 data no superhump modulation was seen (Copperwheat et al. 2010). Within the uncertainty of the superhump-period determination, it fits both the Patterson formula (eq. [17]), a slightly modified relation proposed by Kato et al. (2009), and a linear relation proposed by Knigge (2006).
An eclipsing system like this allows for precise timing, and it will be possible to detect the period-change due to mass transfer and GW radiation in a few years. If we assume conservative mass transfer via RLOF and the expected loss of angular momentum by GW radiation, we may expect  , which is detectable in an O-C timing curve in about 3 yr (Anderson et al. 2005). It has already been observed in two seasons (2006 and 2009), and the next observing season may give the first hint about period change, possibly confirming general relativity theory predictions.
5. CONCLUSIONS AND CHALLENGES
The most important development the last decade is the increase in number of AM CVn stars. The systematic searches in SDSS have given a total of 11 new AM CVn stars in 4 yr, including the first eclipsing (J0926) and one possibly magnetic (J0804). In addition, supernova searches have added three new AM CVn stars.
This has made improved population estimates possible, since we now have a better understanding of the selection effects. Even so, the space density seems to be on the low side compared with population models, telling us that something may be overlooked in the population studies or in the searches for new AM CVn stars. It is even more important to determine the relative population in the three evolutionary channels from observations with a white dwarf, helium-star, or hydrogen-star donors. The result will be important for stellar evolutionary model calculations and, in particular, to understand what happens in the poorly understood common-envelope phases, which are important for the birth of AM CVn stars. So far, we have indications that all three channels produce AM CVn stars.
The two ultra–short-period objects discovered in X-rays have, for the first time, given measurable  , which turned out to be decreasing instead of increasing as expected. This has led to four different models for interpretation, including nonaccreting systems driven by electric energy converted from GW radiation. The most straightforward explanation for the observed features is accretion by direct impact. If GW radiation reduces angular momentum more than accretion can restore it, the orbit will contract and a negative
  will result. If the direct-impact model is proved, then the predictions of Paczyński (1967) are finally fulfilled.
In the near future, it will be possible to detect the variations of the precise clock of the eclipsing AM CVn star J0929, and we may get another verification on the role of GW radiation in binary evolution. This must be a high-priority observation.
Observations with larger telescopes have finally, by time-resolved spectroscopy, made it possible to map the structure of AM CVn stars by Doppler tomography. By inverting the tomograms and spike information, it is possible to get a geometric picture of the systems and to model the disk, bright spots, and even circumbinary matter. The question of the orbital period of AM CVn itself has finally been settled after 34 yr.
The observed emission-lines spikes have given the mass ratio kinematically for AM CVn itself and for other emission-line AM CVn stars. However, the kinematically determined mass ratio for AM CVn is quite different from the one determined from superhumps by the (q) relation for SU UMa stars.
The eclipses of J0926 have, for the first time, given a precise accretor radius and mass ratio. The result is that a hot white dwarf donor, only slightly degenerate, as calculated by the structural models of Deloye et al. (2007b) is possible. However, a helium-star donor or an evolved CV are not excluded (Copperwheat et al. 2010).
The simple equation of state (EOS) for white dwarf and helium-star donors has been replaced by a continuum of EOS functions, partly overlapping for the two channels. This makes determination of mass ratios from superhump observations less precise. More efforts should made for kinematical determinations using the central spike and Doppler tomography. It remains to be seen if a unique (q) relation can be established as is done for ordinary CVs.
A new type of AM CVn star is J0804 with broad, almost Gaussian, single-peaked emission lines, as well as strong lines of ionized helium. It is suggested to be the first magnetic AM CVn star, because of its similarity to magnetic CVs (Roelofs et al. 2009).
Chemical composition determination is a promising method for deciding between birth channels of AM CVn stars: in particular, the element ratios of XN/XC and XN/XO (Nelemans et al. 2010). This requires good resolution spectra and disk and white dwarf atmosphere models. Spectroscopy in the red and IR, which have been little explored for AM CVn stars, may contribute with important lines for chemical abundance determination. A particular problem is the lack of UV observations. The high temperature of the AM CVn stars makes the spectrum peak in the UV, and this is where we may find the possibility to determine the important element ratios between N, C, and O, which in turn may help decide the channel of evolution.
Progress has been made in disk atmosphere modeling, but the full spectrum including wind lines from disks has not yet been well enough modeled. X-ray flux has been detected for some of the AM CVn stars, and abundance anomalies have been determined. Periodic X-ray variations have only been detected for the two shortest-period AM CVn stars and the long-period GP Com.
The SPH modeling of disks has contributed to the interpretation of photometric signals. All observed photometric modulations can be explained as harmonics of the orbital and superhump periods and combinations of those. In the future, a combination of SPH and atmosphere models may improve the fit to observed spectra and provide us with valuable dynamical information related to the accretion process.
We still are waiting for detections of pulsations. These are most likely found for AM CVn stars with orbital periods between 20 and 40 minutes (Bildsten et al. 2006) and, if found, may yield information on the thickness and composition of accreting layers and the accretors' response to accretion.
We may also one day discover DB white dwarfs with a substellar object, either a brown dwarf or a planet, in orbit. They are possible end products of AM CVn evolution, and there should be many such pairs close to us.
Another, more unlikely, end product is a supernova, either of the important SN Ia type, or a weaker, so-called SN .Ia supernova. From analysis of spectra of the low-mass, subluminous Type Ib supernova SN 2005E, it is concluded that this object arises from a helium-accreting white dwarf in a binary, and it may be the first observed SN .Ia with an ejected mass of only ∼0.3 M⊙ (Perets et al. 2010).
Before an AM CVn star is born it may go through a number of nova explosions of increasing strength. A recent helium nova (V445 Puppis) may be an AM CVn progenitor, and its development is eagerly watched.
Finally, intense campaigns are still useful to investigate the outbursts pattern and superhump development. Multispectral campaigns also involving X-rays and UV coverage, such as those currently in progress for KL Dra (Ramsay et al. 2010) and other AM CVn stars (Barclay et al. 2009b), are important.
One of the most important uses of AM CVn stars in the future is that they will serve as verification sources for LISA (Nelemans et al. 2004), which is slated for launch sometime after 2018. LISA will identify thousands of compact-object binary systems—in particular, double white dwarfs—with the major advantage of not being biased against short orbital periods (Stroeer & Nelemans 2009). It is also expected that a fair fraction of LISA-detected systems will be observable with both X-ray and optical instrumentation. In addition, astrometric instruments such as Gaia should dramatically increase the information on double-degenerate systems (Stroeer et al. 2005). Of particular concern is that the GW radiation formula (eq. [1]) describes the evolution of two point masses in vacuum, while the astrophysical scenario is radically different and includes tidal effects, mass transfer, irradiation, magnetic fields, etc. With LISA and the other space detectors there will be an opportunity to disentangle the various effects and greatly improve the understanding of the extreme physics in this stage of stellar evolution.
Thanks to Lev Yungelson for excellent advice during the writing of this review and to H. K. Eriksen and E. Meistas for technical assistance with figures. I also wish to thank Lewis Houck for help with proofreading and the anonymous referee who suggested numerous improvements. This research has made use of the NASA Astrophysics Data System (ADS) and the SIMBAD database, operated at CDS, Strasbourg, France.