
ABSTRACT
Stunted outbursts have been reported in old novae and nova‐like cataclysmic variables by Honeycutt, Robertson, and Turner. These 0.4–1 mag outbursts were concluded to be either mass transfer events or disk outbursts similar to dwarf nova eruptions, but seen under unusual conditions. Honeycutt, Robertson, and Turner did not have enough evidence to favor either of these possibilities. This paper uses additional long‐term photometry and analysis to argue that the similarities of these stunted outbursts to dwarf nova eruptions are now so numerous that the dwarf nova outburst choice is strongly favored. The similarities discussed here include the range of outburst spacings, the coherence and stability of the outbursts, and the presence of isolated outburst/dip pairs. As part of this discussion we note the presence of unexpectedly stable clocks over 9 years for the repetition interval of dwarf nova outbursts in SY Cnc and of stunted outbursts in FY Per.
Export citation and abstract BibTeX RIS
1. INTRODUCTION
Cataclysmic variables (CVs) typically consist of a red dwarf/white dwarf pair in which the red dwarf is losing gas to the white dwarf via Roche lobe overflow (Warner 1995a). The accretion luminosity usually dominates in the visual part of the spectrum, making CVs important laboratories for the physics of stellar accretion. Dwarf novae (DNs) are a subclass of CVs in which an accretion disk surrounding the white dwarf undergoes regular eruptions due to a thermal instability in the disk (Cannizzo 1993). This instability occurs only in a restricted range of disk temperatures (and hence in a restricted range of mass transfer rates M˙ from the red dwarf) over which partially ionized hydrogen controls the thermal structure of the disk. At the higher disk temperatures provided by a larger M˙, hydrogen is nearly fully ionized in the relevant portions of the disk, and accretion takes place under steady state conditions without DN outbursts. Therefore we do not expect DN behavior in systems with M˙>M˙crit.
Systems with M˙>M˙crit are identified observationally as nova‐like CVs (NLCVs). (Most classical novae observed decades after the nova outburst are similar spectroscopically and photometrically to NLCVs, and we will make no distinction between the two types in this paper.) As expected, NLCVs are found to be brighter on average (by ∼3 mag) than DN‐type CVs at the same orbital period (Warner 1995a).
In a decade‐long monitoring program of about 70 NLCVs, Honeycutt, Robertson & Turner (1998, hereafter HRT98) reported that a significant fraction displayed stunted outbursts. These 0.4–1.0 mag events have spacings and widths characteristic of DN outbursts but are of much smaller amplitude. Several candidate explanations for stunted outbursts were explored, including mass transfer events as well as thermal disk instabilities seen under unusual circumstances. However, the authors did not have enough evidence to establish any explanation as favored among those proffered. In this paper, using additional data and analysis, it is argued that the similarities of stunted outbursts in NLCVs to DN outbursts are now so numerous that stunted outbursts must almost surely be due to DN‐type disk instabilities. It is further argued that stunted outbursts may be outbursts of normal DN amplitude, seen against a brighter background source that makes them appear of smaller amplitude.
Except for the AAVSO data on Z Cam, the light curves presented here were acquired by RoboScope (Honeycutt & Turner 1992), an unattended 0.41 m telescope in central Indiana that is devoted to long‐term photometric monitoring of accretion systems. The data was reduced using the method of incomplete ensemble photometry (Honeycutt 1992). The average RoboScope error for these light curves is 0.01–0.02 mag. For clarity the error bars are not plotted on the light curves.
2. COMPARISON OF OUTBURST TYPES
The morphology of DN outbursts is rich and complex. Excluding superoutbursts that occur in the SU UMa–type DN (probably due to a tidal, not thermal, disk instability; Osaki 1989), DN outbursts can be broadly classified according to mean outburst spacing. For other parameters being equal, the outburst spacing decreases with increasing M˙. Typical DN outburst widths are 3–20 days. At low M˙ the outbursts are spaced at intervals of many times their mean width. As M˙ approaches M˙crit, the spacing decreases until the duty cycle becomes 100% (Lin, Papaloizou, & Faulkner 1985). At this stage the outbursts have the approximate appearance of a continuous sine wave. Very near M˙crit small changes in M˙ can carry the star back and forth across the instability boundary, leading to a Z Cam–type dwarf nova (Meyer & Meyer‐Hofmeister 1983). In Z Cam–type CVs the DN outbursts occasionally cease, leading to a steady standstill that might last weeks to years. At later times the star returns to outbursting behavior as M˙ drifts back below M˙crit. As expected, the DN outbursts in Z Cam systems are usually rapid with near 100% duty cycle (Warner 1995b). Furthermore, Z Cam stars during standstill are brighter than their mean brightness when they are experiencing DN outbursts (Honeycutt et al. 1998b). Taken together, these two observational characteristics of Z Cam stars provide confidence that this picture is fundamentally correct. Another relatively common behavior of Z Cam stars (although not well documented in the literature) is a single outburst/dip pair, having the appearance of a single cycle of oscillation, that occurs during a momentary lapse from standstill.
Examples of spaced stunted outbursts which appear to be analogous to the larger amplitude spaced outbursts in dwarf novae were presented and discussed in HRT98. That material will not be repeated here. Rather, in this paper we add several examples of small continuous outbursts (or oscillations) to the morphology of stunted outbursts and also add a discussion of outburst/dip pairs seen in NLCVs.
2.1. Continuous Outbursts or Oscillations
The continuous stunted outbursts reported here have, for the most part, an erratic character similar to that reported (HRT98) for more widely spaced stunted outbursts. That is, they are rather obvious when present but sometimes cease or are obscured by the common stochastic variations present in many NLCVs. The typical oscillation period for continuous stunted outbursts in NLCVs is found to be 15–50 days, and enhanced periodogram power is often present near 15–50 days even when the oscillations cannot easily be seen by eye.
Figure 1 shows a portion of the light curve of DI Lac (=Nova Lac 1910) from 1993–1994 and a portion of the light curve of RW Tri from 1992–1993. In both cases ∼0.5 mag oscillations at about 25 days are clearly present, although the sampling is not as complete as desired. This behavior in RW Tri was first described in Honeycutt et al. (1994), and the DI Lac oscillations are more fully described in Hoard et al. (2000). For RW Tri a sine wave fit was made to the first 6 cycles of the data in Figure 1, giving P = 25.1 ± 0.2 days with a full amplitude of 0.45 mag. The coherence interval appears to be at least 150 days (or 6 cycles). Although the oscillations continue beyond this interval, the phasing of this 25 day period becomes progressively worse over the extrapolation.
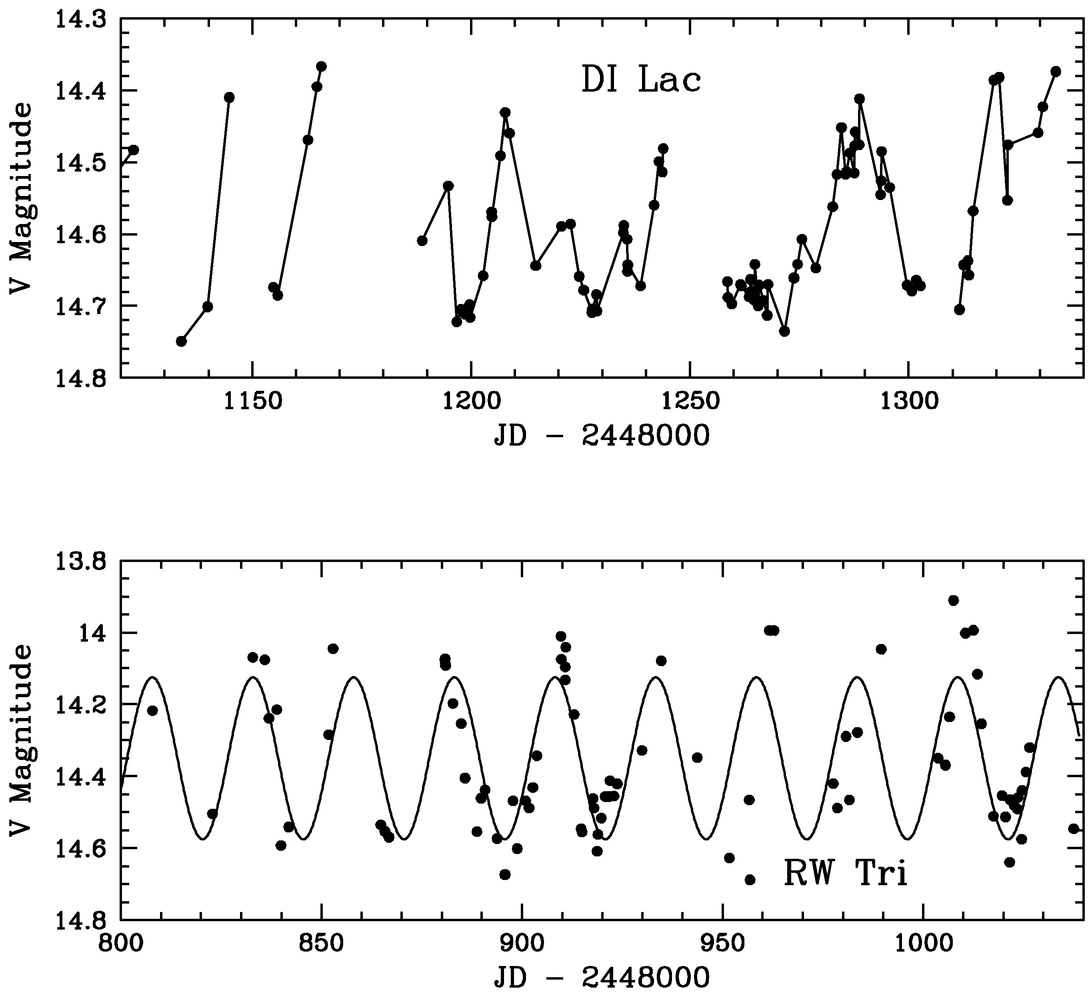
Fig. 1.— Stunted continuous outbursts or oscillations at about 25 days in DI Lac (1993 May–1993 December) and in RW Tri (1992 July–1993 February). Points closer than 8 days are connected by straight lines for DI Lac. Points in eclipse are omitted from the RW Tri light curve. The sine curve superposed on the RW Tri data is a least‐squares fit to the first half of the displayed data, which is then extrapolated over the latter half of the data. The fitted parameters give a period of 25.1 ± 0.2 days and a peak‐to‐peak amplitude of 0.45 mag.
Extra power near 25 days is also present in other years for RW Tri, as seen in the periodogram for 9 years of RW Tri photometry in Figure 2. These examples of CV periodograms were produced using the method of Horne & Baliunas (1986). The top seven periodograms in Figure 2 are for NLCVs and the bottom three for dwarf novae, all using RoboScope data obtained over about 9 years. The top two NLCVs (SW Sex and BH Lyn) are included as examples of systems for which oscillations are not present, where we see the power evenly distributed over the range 5–100 days. Most of the 70 NLCVs on the RoboScope program have this character, often with large stochastic variations over a wide frequency range; only ∼20%–25% have discernible stunted outbursts or oscillations. In about 50% of the NLCVs on the RoboScope program, stunted outbursts would be very difficult to spot even if present because of the background noise of larger amplitude random variations. Therefore, the fraction of NLCV systems having stunted outbursts could approach 50%. For the old novae and nova‐like CVs V841 Oph (N Oph 1848), GI Mon (N Mon 1918), CT Ser (N Ser 1948), RW Tri, and FY Per in Figure 2 we see that most of excess power is in the interval 15–50 days. Also shown for comparison in Figure 2 are periodograms of three DNs with frequent DN eruptions (SS Cyg, HX Peg, and SY Cnc), again from RoboScope data. Dwarf novae typically have reliable repetitive outbursts that are not strictly periodic. In Figure 2 the distributions of power for the eruptions of the three DNs and for the five NLCVs having stunted outbursts are seen to be quite similar.
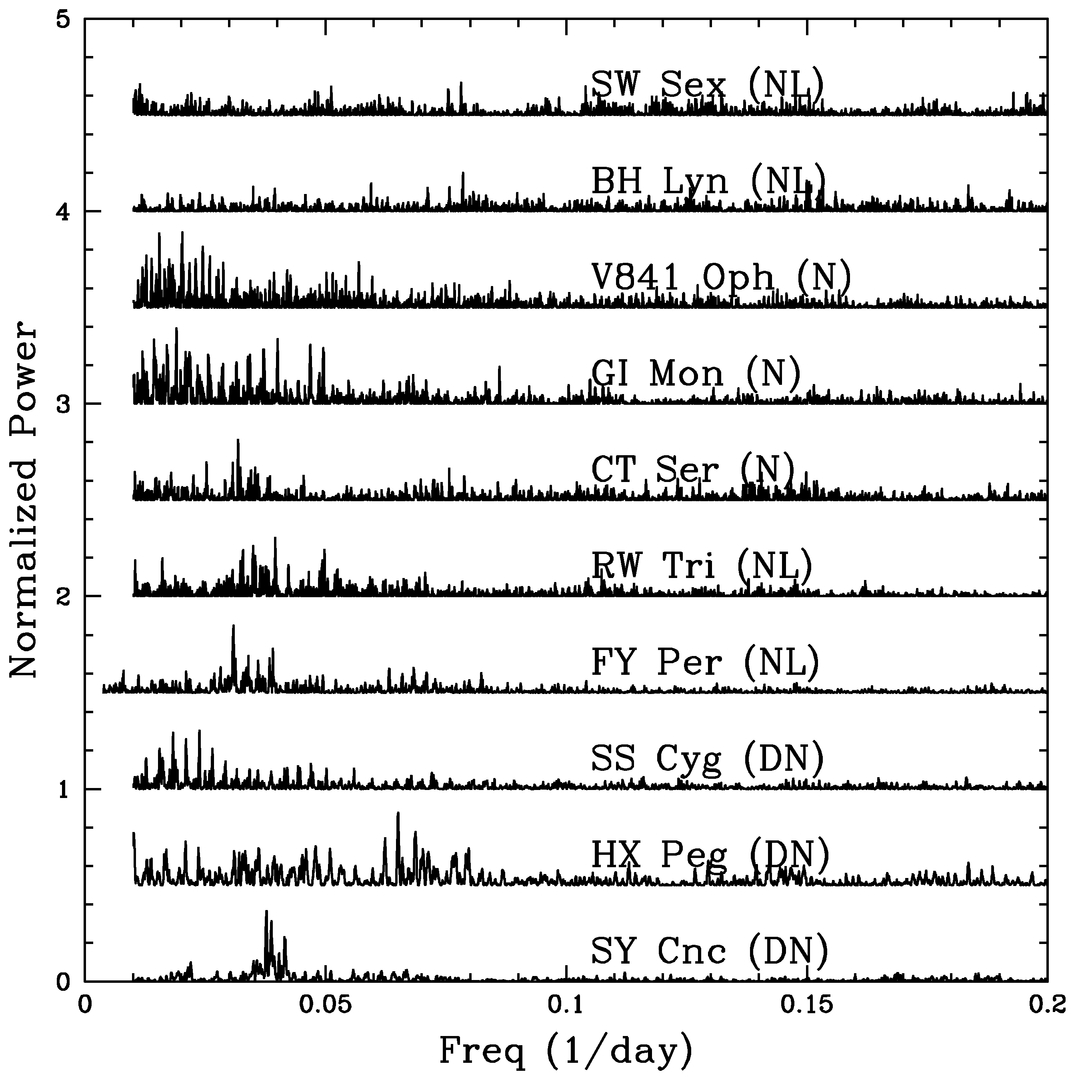
Fig. 2.— Periodograms over the period interval 5–100 days for seven old novae and NLCVs, plus three dwarf novae. The input data in each case are 9.5 year light curves from RoboScope. Before producing these periodograms, eclipse points were removed from the light curves of SW Sex, BH Lyn, and RW Tri, and the low states were removed from FY Per.
The most reliable of the oscillating NLCVs is FY Per. Figure 3 shows the 1990–1999 light curve. The scatter between magnitudes 12 and 13 are the oscillations, and several excursions to fainter levels are also present. Quasi‐periodicity in the range 20–30 days has been reported before in FY Per by Sazonov & Shugarov (1992) and by Watanabe & Maehara (2000). The classification of FY Per as a cataclysmic variable has been questioned by Okazaki (1993) but our spectrum obtained at Kitt Peak on 1993 July 26 (UT), shown in Figure 4, is consistent with an NLCV having an optically thick disk, probably seen at low inclination. Hα is in emission, and the higher Balmer lines also have weak central reversals. This FY Per spectrum appears quite similar to a 1993 December spectrum shown in Downes et al. (1995), where a short history of this poorly studied CV can be found. The occasional VY Scl–type low states seen in Figure 3 would seem to make the CV classification of FY Per secure, as well as the similarity of the oscillations to other NLCV behavior. Figure 5 is an expanded portion of the light curve in Figure 3 surrounding the well‐resolved low state that occurred over a 2 week interval in 1995 November/December.
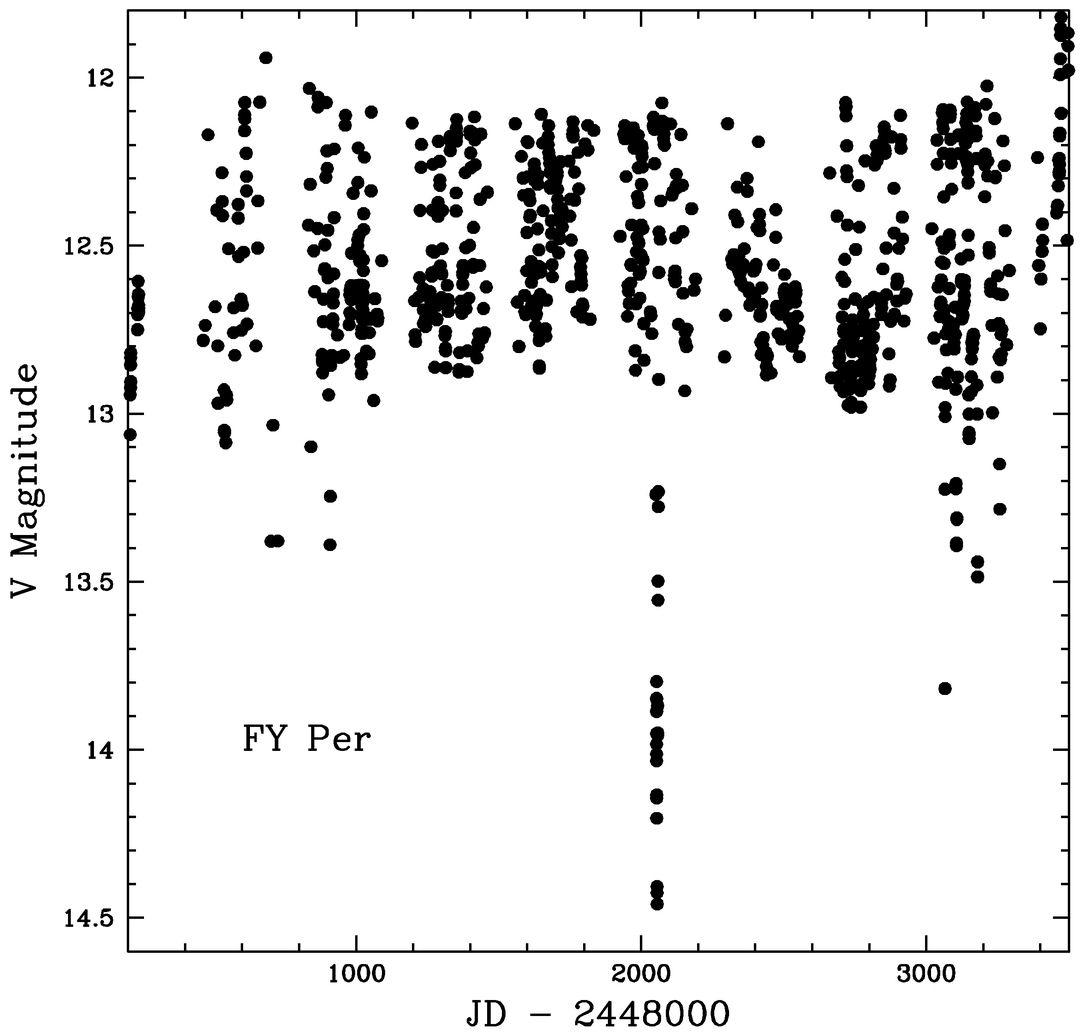
Fig. 3.— RoboScope light curve of the NLCV FY Per from 1990 November to 1999 November showing large faintward excursions as well as oscillations in the high state with an amplitude of 0.7 mag and a typical period of 32 days.
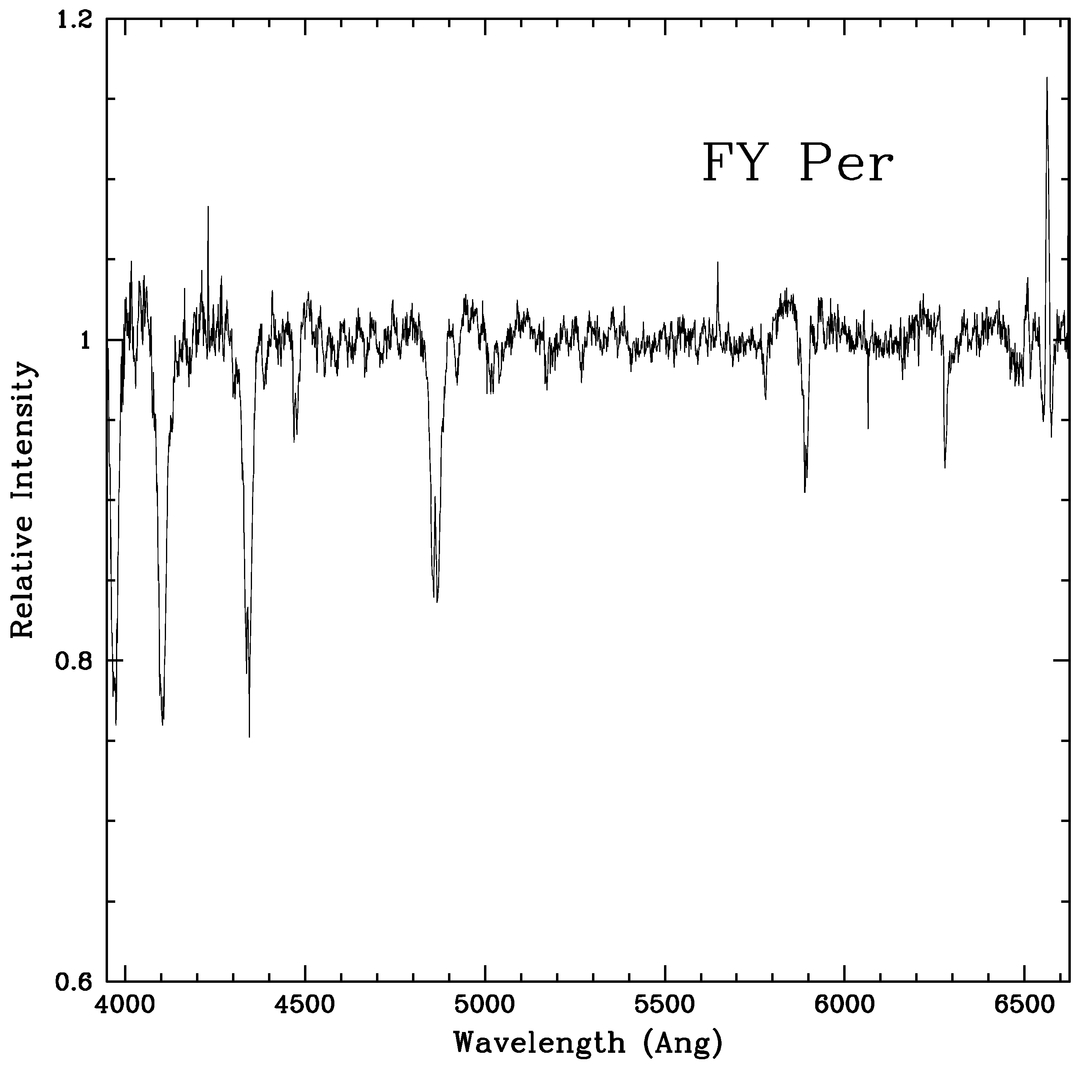
Fig. 4.— Spectrum of FY Per obtained 1993 July 26 (UT) at KPNO using the GoldCam spectrograph on the 2.1 m telescope. The resolution is 3.5 Å, and the continuum slope has been removed. Hα is in emission. The other strong absorption features are Balmer lines, He i, and Na D.
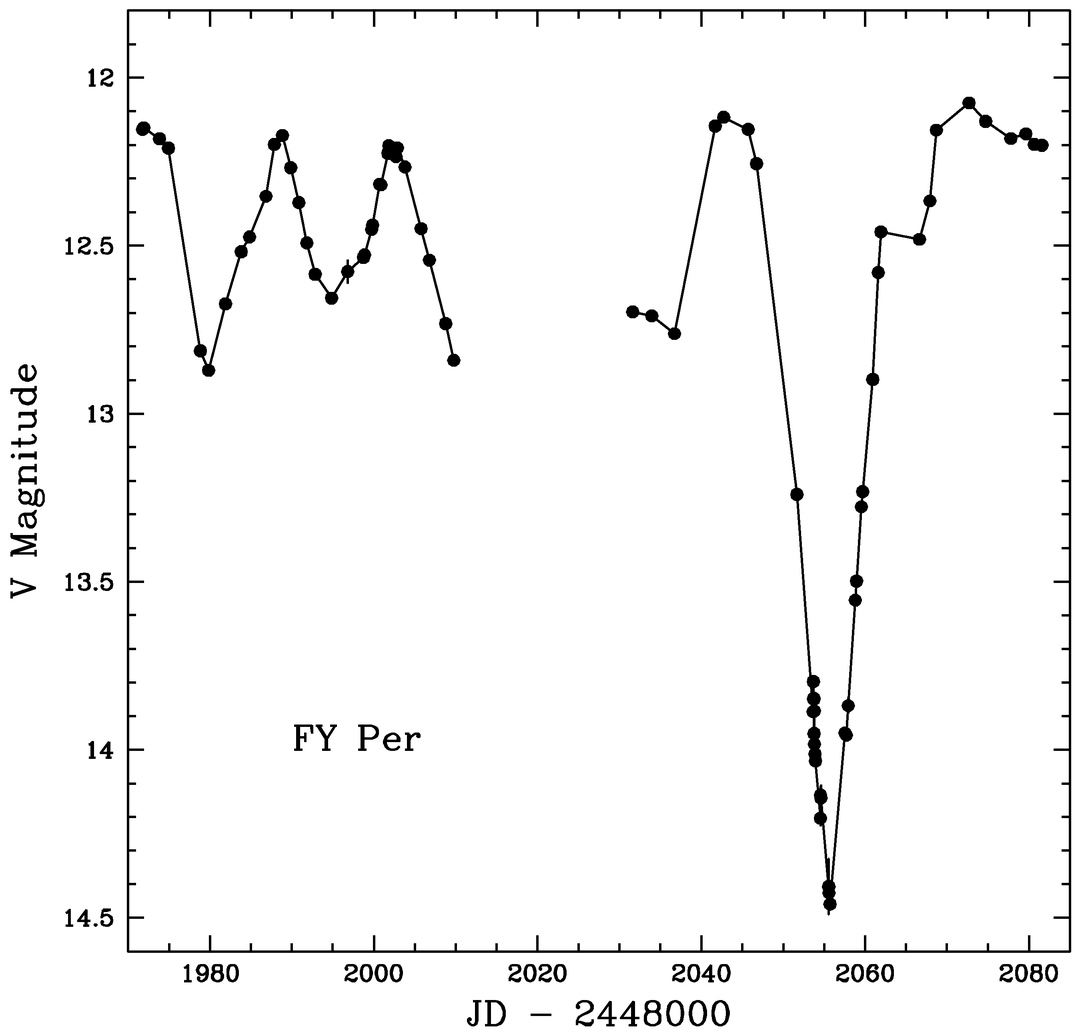
Fig. 5.— Expanded portion of the FY Per light curve of Fig. 3 showing a 2.2 mag low state lasting about 2 weeks in 1995 November/December. Data points spaced more closely than 5 days are connected by straight lines.
The outbursts in FY Per can sometimes be spaced so closely as to appear continuous, as seen in the top panel of Figure 6, and sometimes spaced at intervals of about 50 days, as seen in the bottom panel. This behavior is confirmed in the series of periodograms of the FY Per light curves arranged by observing season, shown in Figure 7. While the power remains concentrated between 15 and 50 days, the patterns and peaks can be strikingly different from year to year. The top periodogram of Figure 7 is for the full 9.5 year observing interval. This periodogram was produced using the full data set, not by averaging the yearly periodograms. There is a strong narrow peak at 32.45 days which can be seen more clearly in the expanded periodogram view of Figure 8.
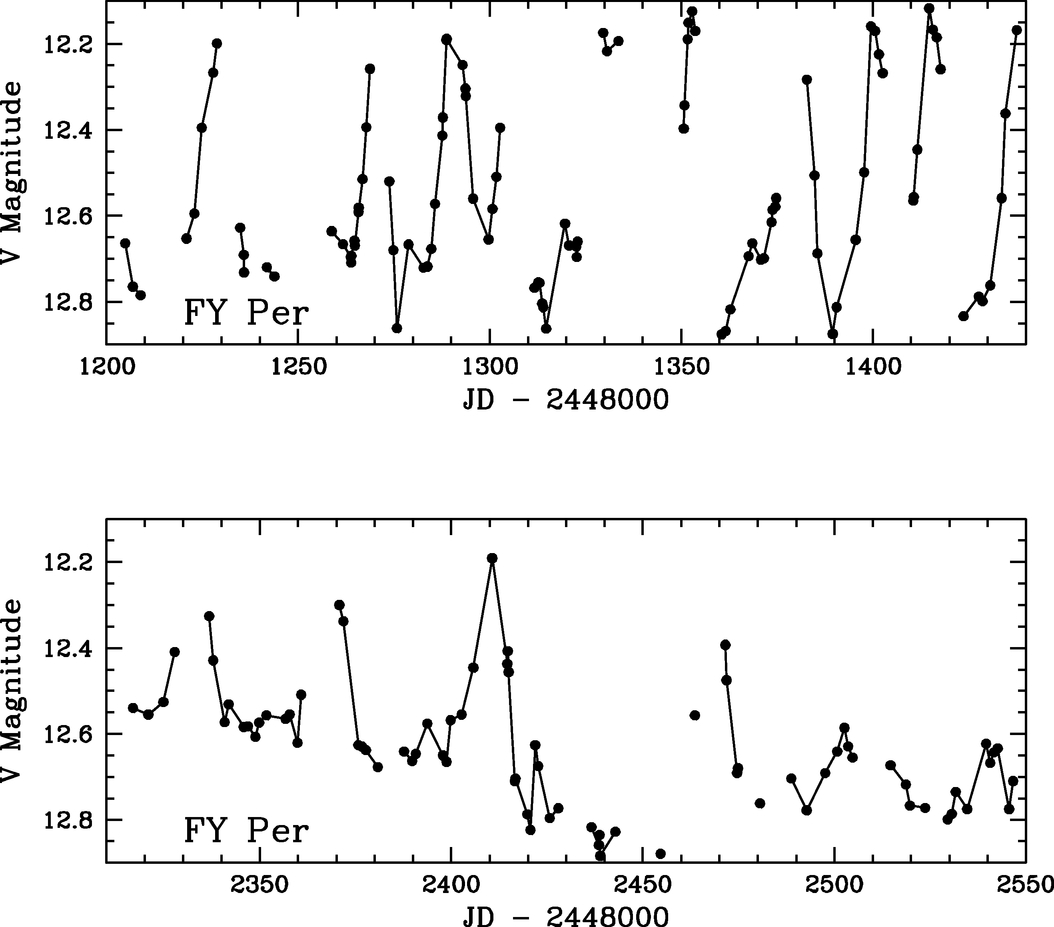
Fig. 6.— Expanded portions of the FY Per light curve of Fig. 3, showing continuous stunted outbursts in 1993–1994 (top) and spaced stunted outbursts in 1996–1997 (bottom). Points closer than 5 days are connected by straight lines.
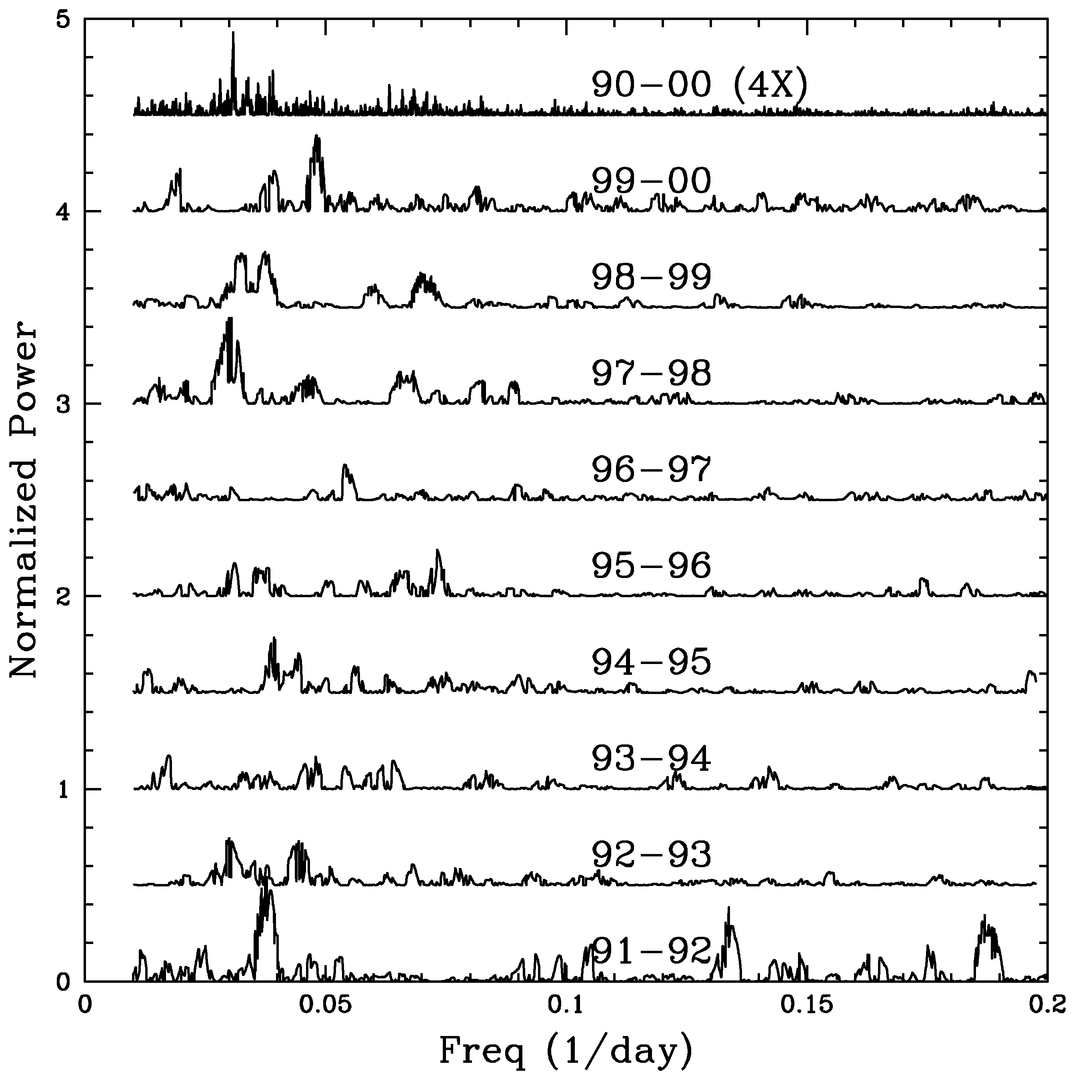
Fig. 7.— Periodogram of FY Per from 5 to 100 days for each of 9 seasons plus (top) for the full 9 year light curve. Each periodogram is offset by 0.5 units of normalized power. For clarity the power in the top periodogram has been multiplied by 4.
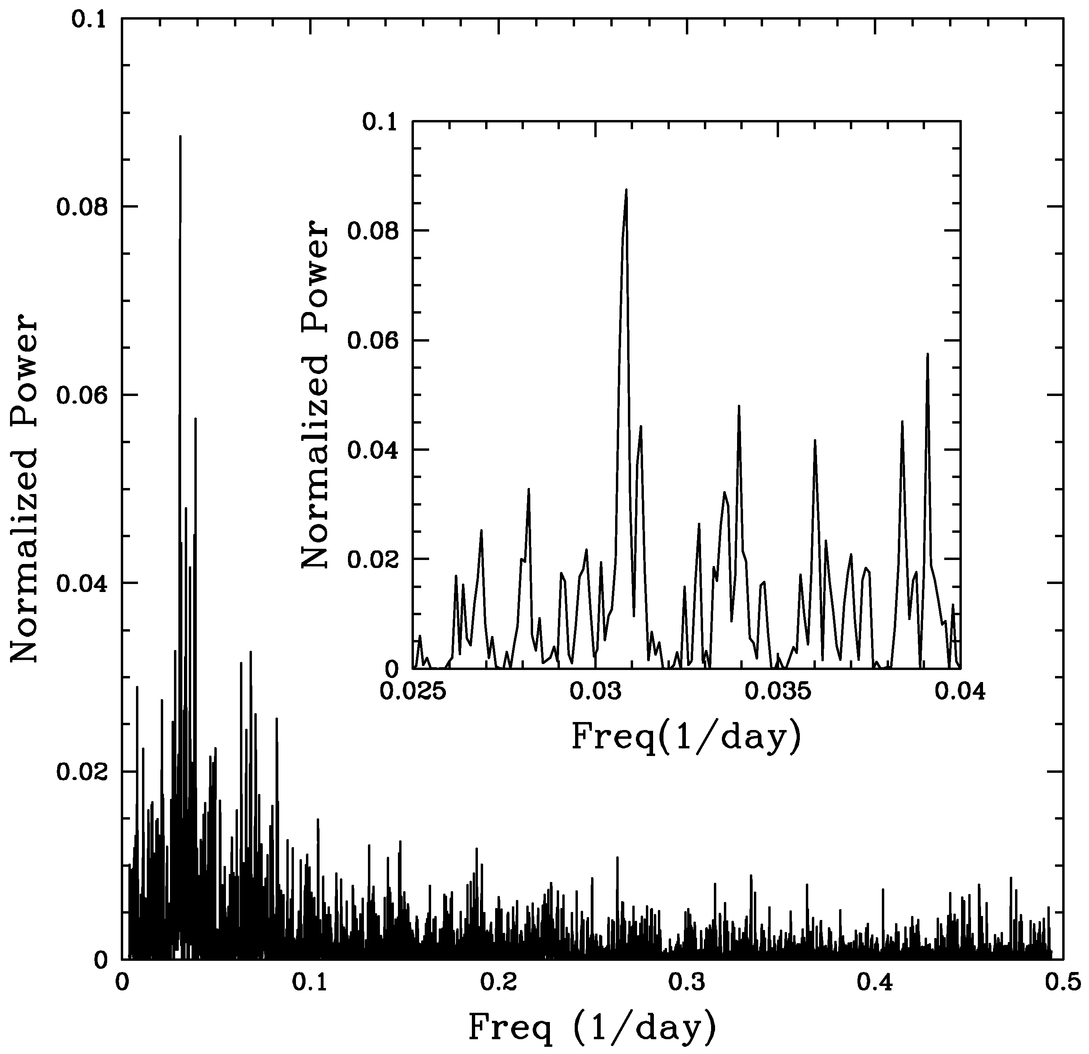
Fig. 8.— Periodogram of FY Per from 2 to 100 days for 9 years of data. The inset plot is an expanded view of the region near the 32.45 day peak. The flanking peaks seen in the inset plot are mostly yearly and multiyear aliases of the 32 day peak.
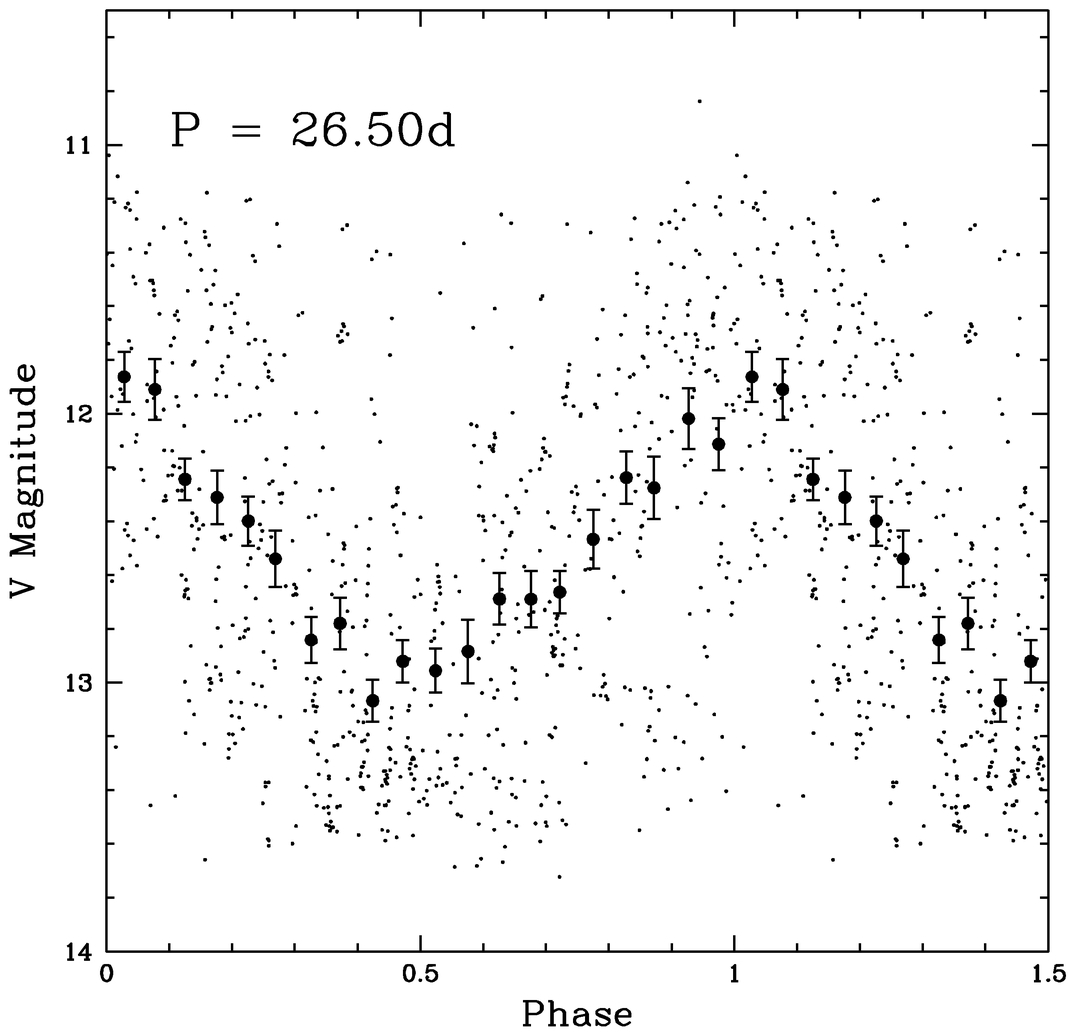
The appearance of this periodogram peak in FY Per at 32.45 days is surprising because it is not prominent in the yearly periodograms and because it implies an unexpected long‐term stability in the outburst spacing. Figure 9 shows the full 9.5 year light curve of FY Per (with the low states removed) folded on the 32.45 day period. While some outbursts clearly are at variance with this periodic behavior, this coherence at 32.45 days is not totally washed out by phase drift or large phase jitter over these 106 cycles. In Figure 2 we see that the outbursts in the Z Cam–type DN SY Cnc over 9.5 years produce a periodogram peak similar to that of FY Per. (The amplitude of the outbursts in SY Cnc are larger than in FY Per, having a typical full amplitude of 2.0 mag as compared to 0.7 mag in FY Per.) Figure 10 shows the 9.5 year light curve of SY Cnc folded on its periodogram peak of 26.50 days. The phasing of the outbursts in SY Cnc remain mostly coherent over 130 cycles. Regardless of the mechanism or significance of this unexpected coherence, it does represent an additional similarity of stunted OBs in NLCV to DN eruptions.
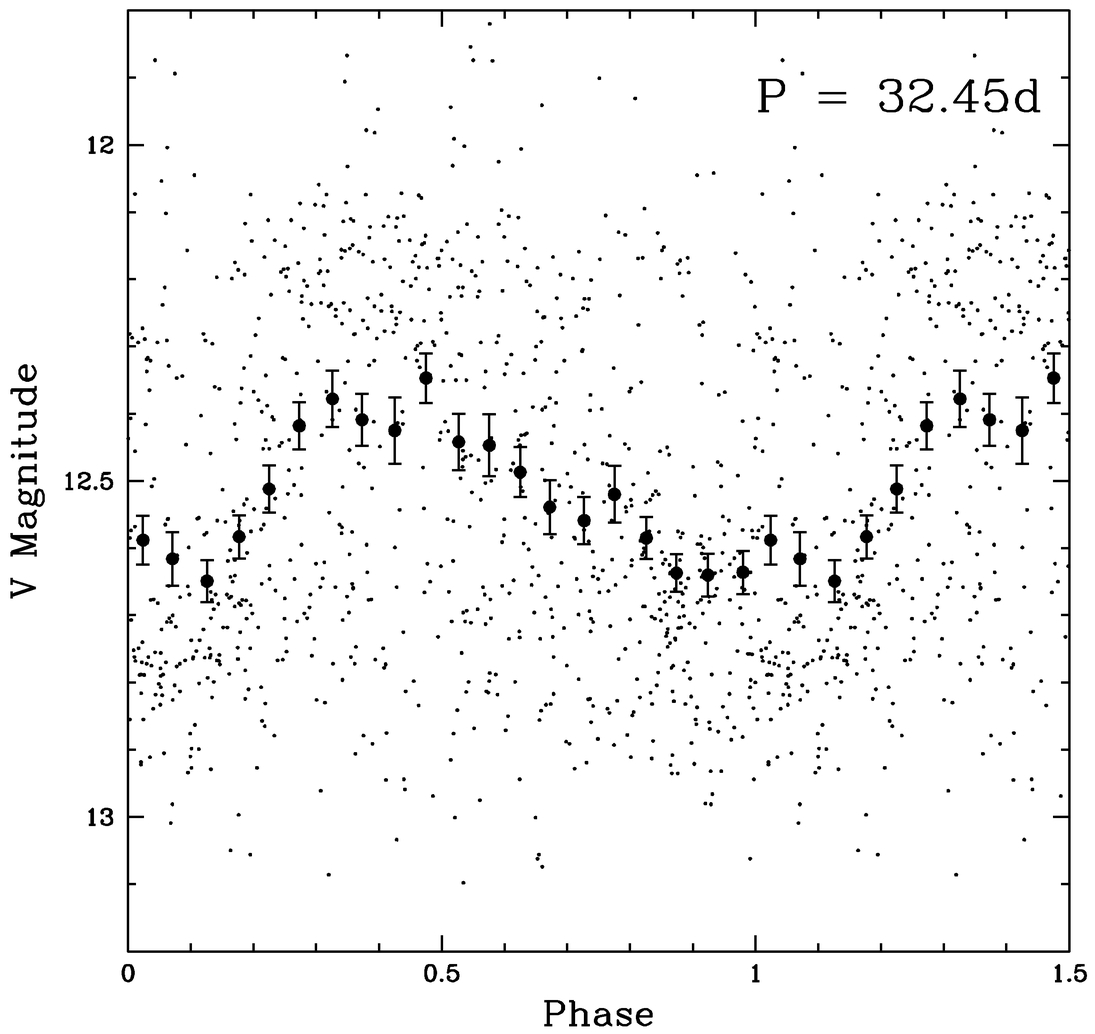
Fig. 9.— The 9 year FY Per light curve of Fig. 3, for data brighter than V = 13, is folded on the periodogram peak at 32.45 days and shown as small dots. For clarity the data are repeated to make 1.5 cycles. The large filled circles with error bars are data averaged in phase bins 0.05 phase units wide. The error bars are the standard deviations of the mean.
2.2. Outburst/Dip Pairs
Some stunted outburst/dip pairs in NLCVs were noted in HRT98. Figures 11 and 12 show four such pairs which bear a strong resemblance to outburst/dip pairs of much larger amplitude that are occasionally seen in Z Cam–type dwarf novae. Figures 13 and 14 show examples of large‐amplitude outburst/dip pairs in the Z Cam‐type systems AH Her, HX Peg, and Z Cam itself. The Z Cam light curve is AAVSO data from Honeycutt et al. (1998b). There appears to be little difference between stunted outburst/dip pairs in NLCVs and outburst/dip pairs in Z Cam systems, except for the amplitude. The amplitudes in the NLCVs are 0.6–1 mag while they are 1–3 mag in Z Cam systems.
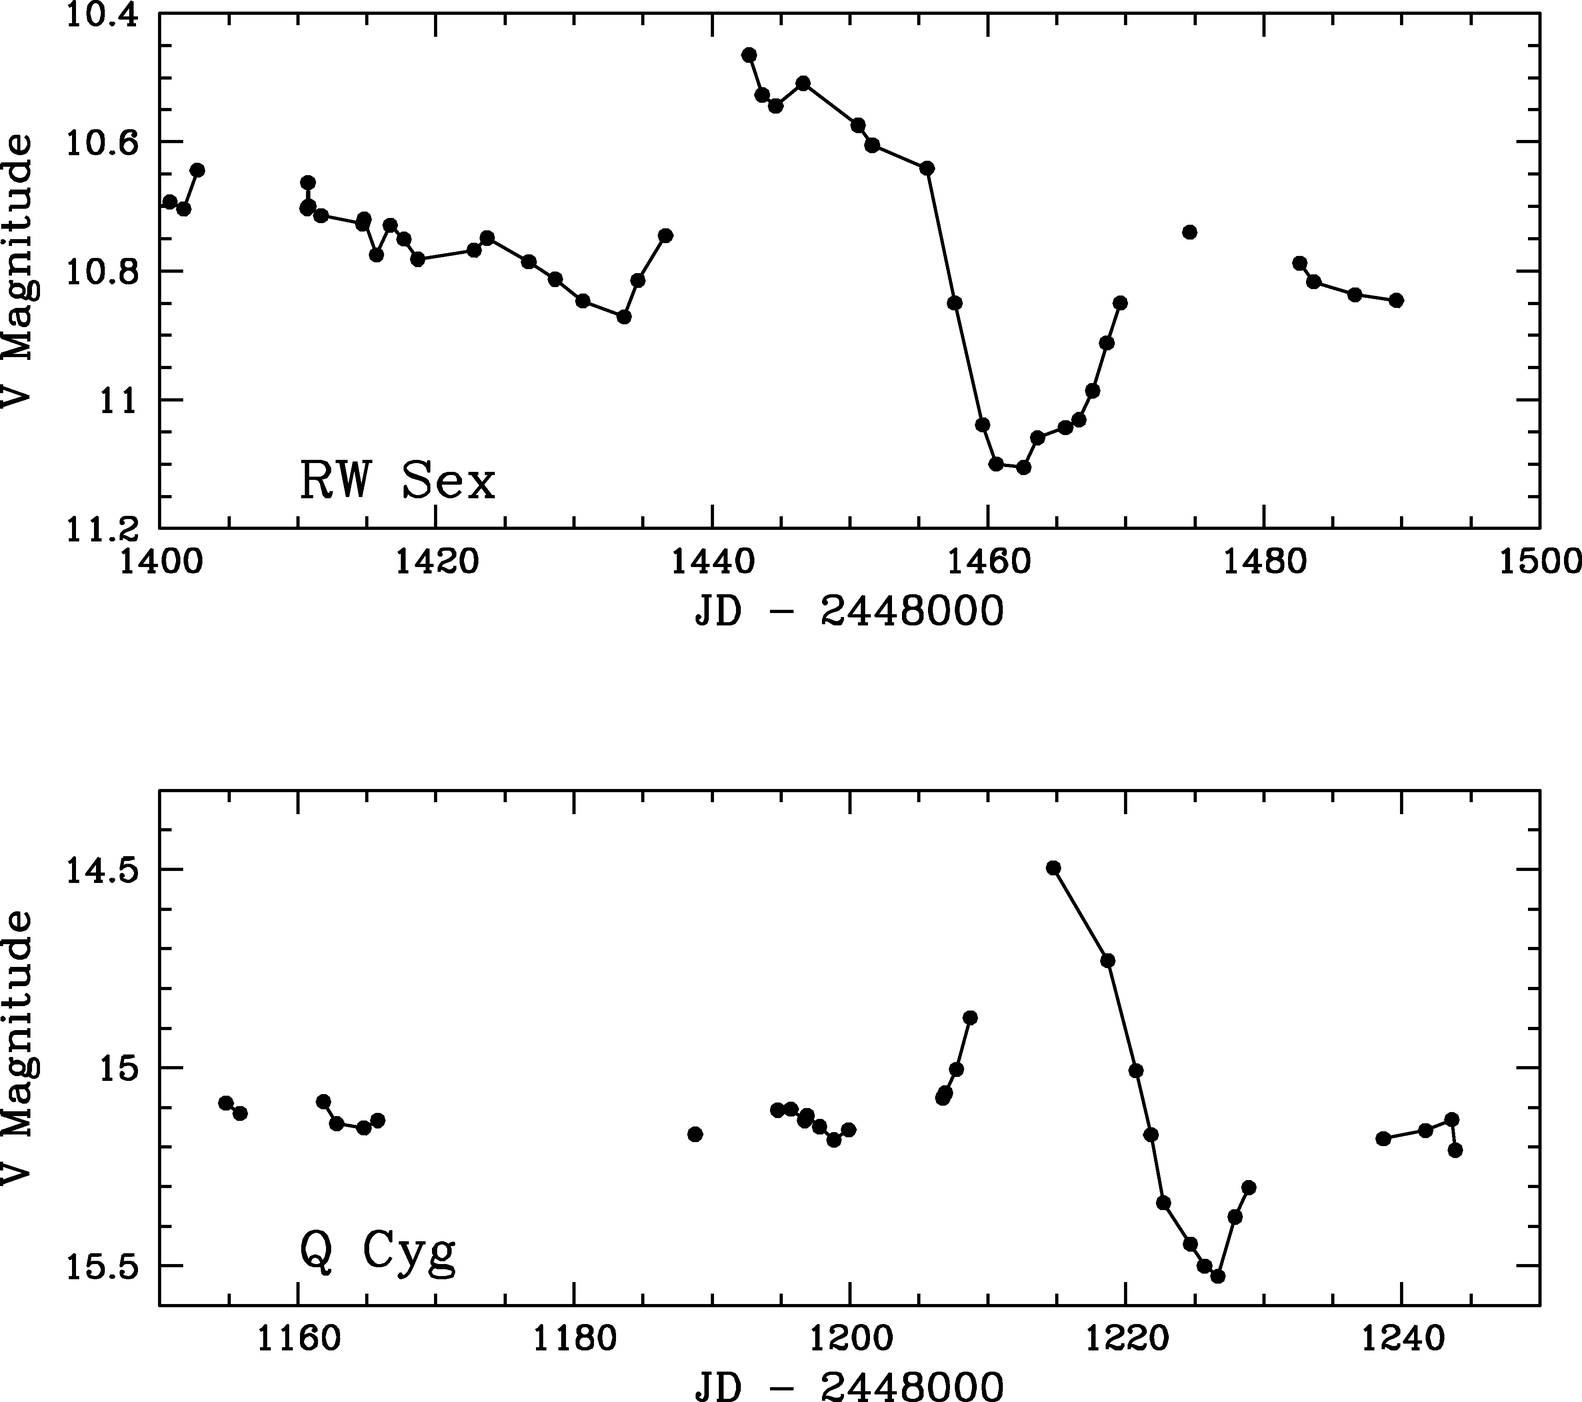
Fig. 11.— Stunted outburst/dip pairs in RW Sex (1994 February–1994 May) and in Q Cyg (1993 January–1993 September). Points closer than 5 days are connected by straight lines.
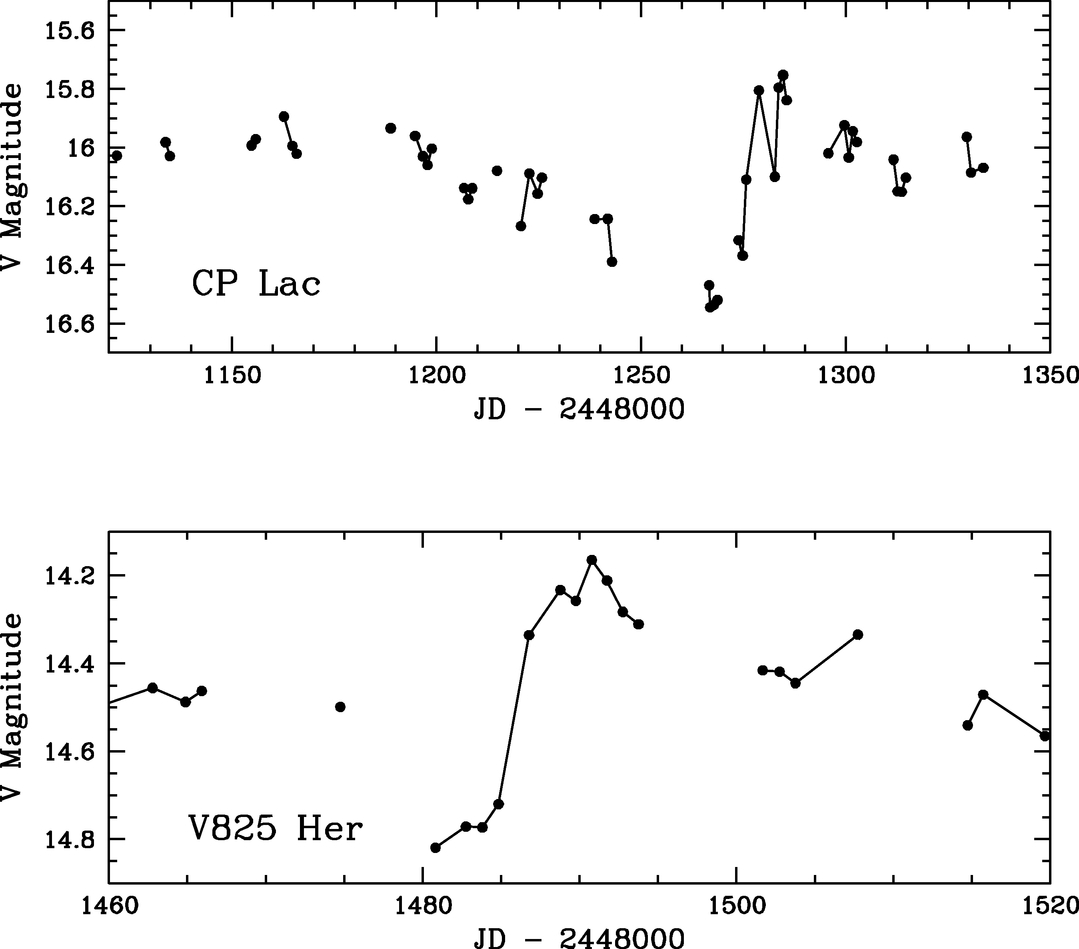
Fig. 12.— Stunted outburst/dip pairs in CP Lac (1993 May–1993 December) and V825 Her (1994 April–1994 June). Points closer than 5 days are connected by straight lines.
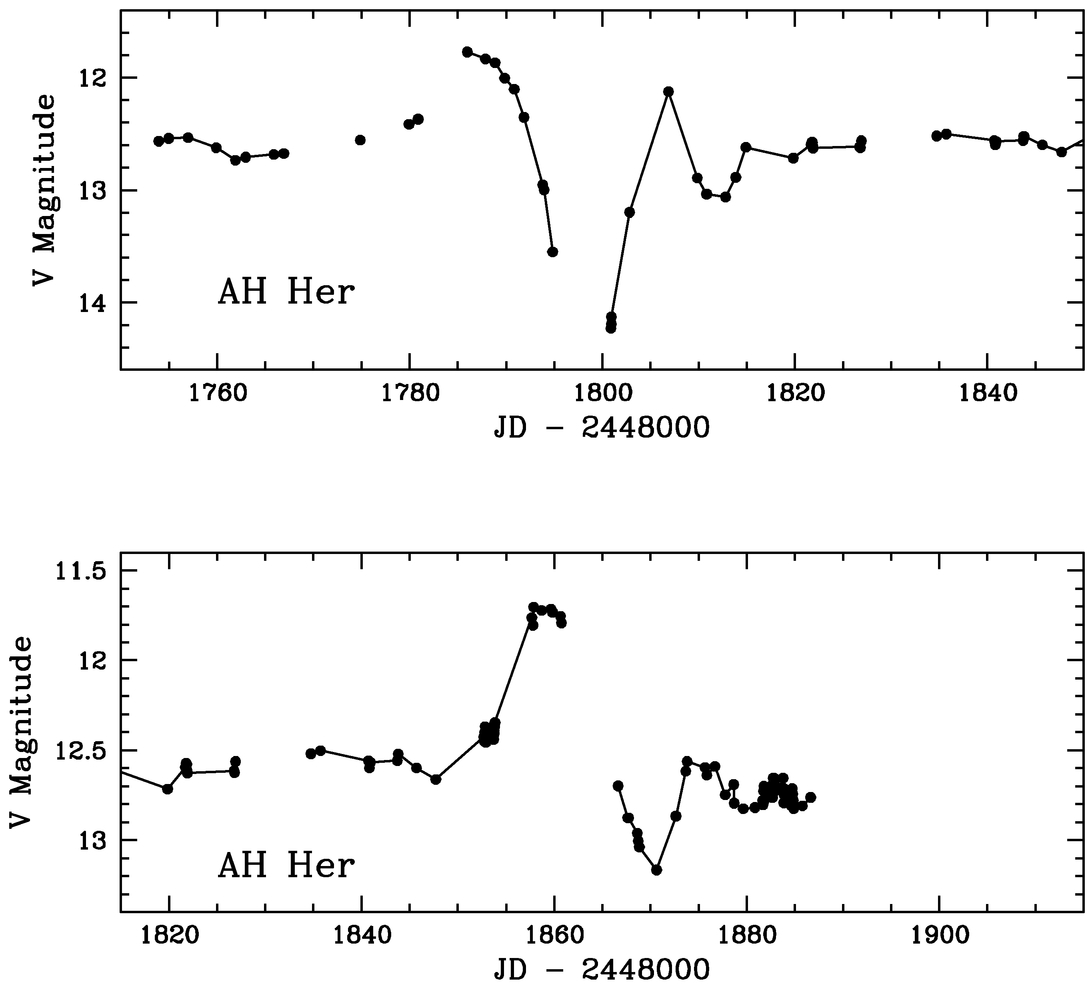
Fig. 13.— Isolated outburst/dip pairs in the Z Cam star AH Her (1995 February–1995 June). Points closer than 5 days are connected by straight lines.
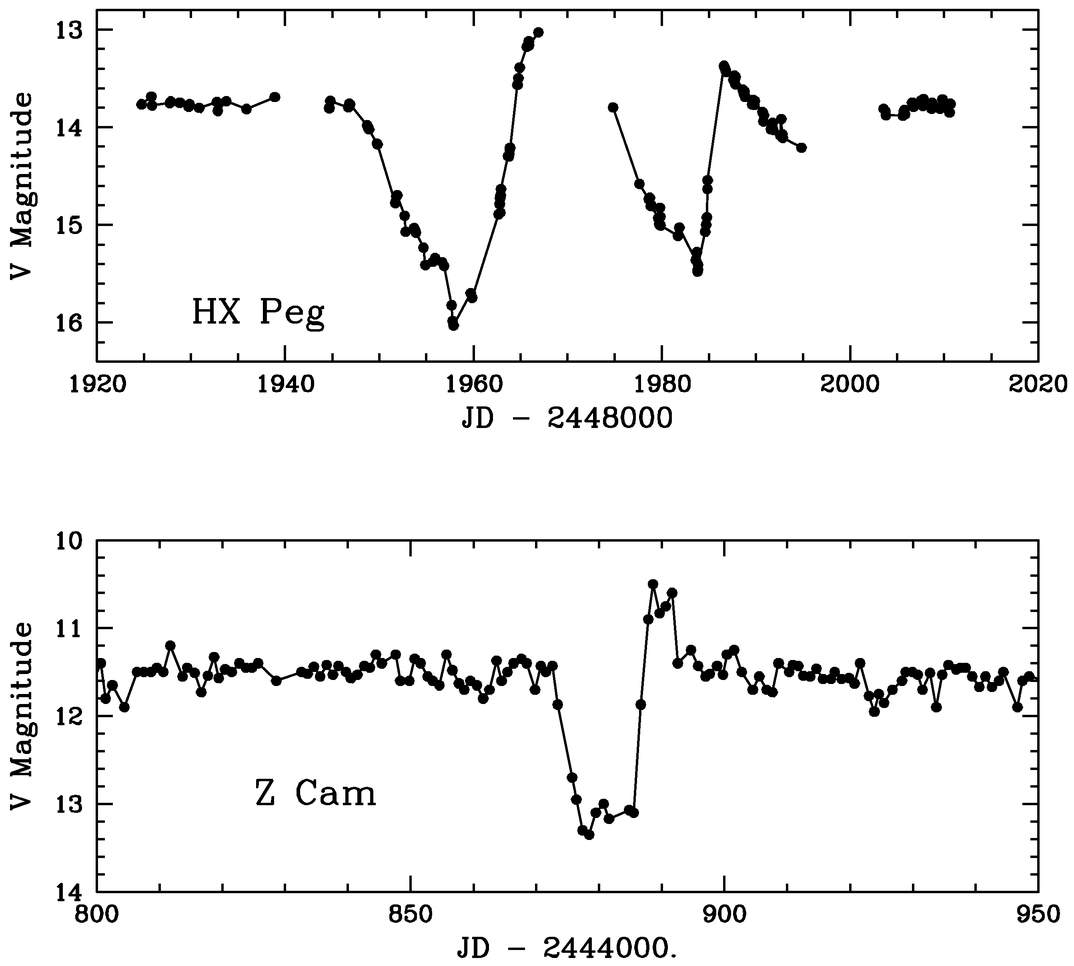
Fig. 14.— Isolated outburst/dip pairs in the Z Cam stars HX Peg (1995 July–1995 October) and Z Cam (1981 July–1981 December). The HX Peg data are from RoboScope, and the Z Cam data are from the AAVSO. Points closer than 5 days are connected by straight lines. The outburst/dip pairs in Figs. 13 and 14 are similar to the stunted outburst/dip pairs in Figs. 11 and 12 but are of larger conventional dwarf nova amplitude in the Z Cam stars.
2.3. Similarities in Outburst Strengths
Stunted outbursts have substantially different mean amplitude than normal DN outbursts, which is of course their primary defining characteristic. Nevertheless, some other amplitude properties are in common.
There is usually significantly less scatter among the amplitudes of stunted outbursts in a given NLCV than the scatter in mean amplitude from system to system. This is particularly apparent for the continuous outbursting systems such as FY Per and DI Lac. Also, Q Cyg has spaced outbursts that are of relatively uniform amplitude. This behavior is a well‐known characteristic of DN outbursts, each DN system having a characteristic mean outburst amplitude that can vary greatly from system to system.
The top panel of Figure 15 shows the distribution of stunted outburst amplitudes from Table 1. The next panel shows the amplitude distribution of dwarf nova outbursts from Warner (1995a), using only U Gem– and Z Cam–type DN. (SU UMa–type DN were omitted because of the presence of superoutbursts.) In HRT98 it was hypothesized that stunted outbursts in NLCVs are DN‐type eruptions of conventional amplitude that have been attenuated by the presence of a relatively constant background light source in the system. In the bottom three panels of Figure 15 we show the conjectured parent distribution of amplitudes for the stunted outbursts in Table 1, assuming background sources that are 3.0, 3.5, and 4.0 mag brighter than the dwarf nova in quiescence. The mean amplitude is best matched to the DN distribution for 3.5 ± 0.5 mag of background light. Although there is considerable scatter, Figure 9.8 of Warner (1995a) shows that, at the same orbital period, NLCVs are about 3 mag brighter than DNs. This could be coincidence, but it does show that the conjectured extra light needed to produce stunted outbursts from DN outbursts is consistent with the extra light in NLCVs that makes them more luminous than DNs. Another way of looking at this relationship is that the total energy of a typical stunted outburst is about the same as the total energy of dwarf nova eruption, because the smaller amplitude (in mag) stunted outbursts are seen against a brighter source. This is a firm similarity between stunted outbursts and DN outbursts and holds regardless of the validity of any hypotheses regarding the existence and nature of "extra" light.
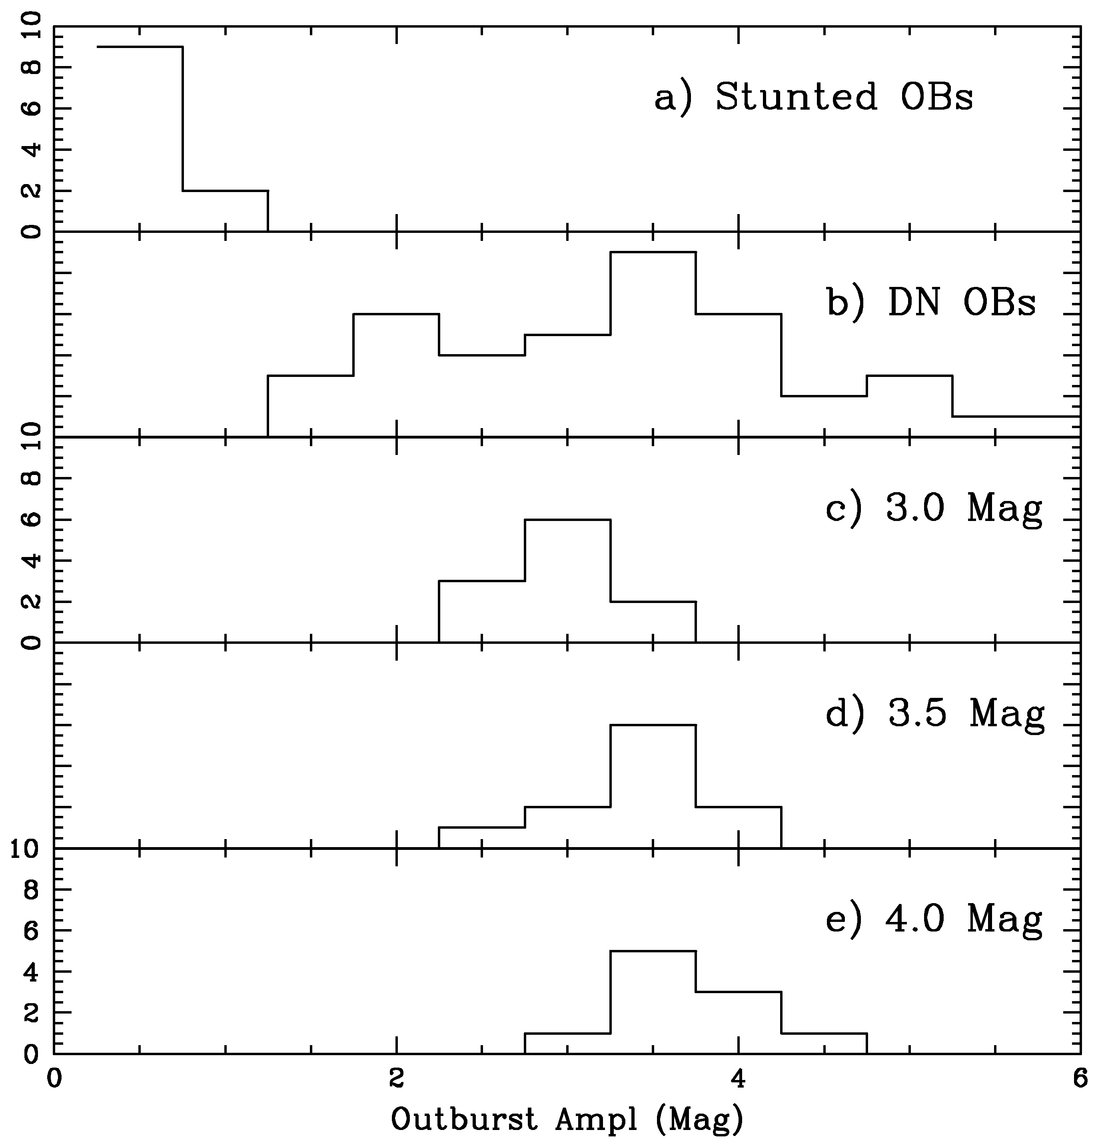
Fig. 15.— Comparison of the distributions of outburst amplitudes for stunted outbursts in NLCVs and eruptions in dwarf novae. (a) The observed stunted outburst amplitude distribution from Table 1. (b) The observed dwarf nova outburst amplitude distribution from Warner (1995a). (c), (d), and (e) show parent distributions of the stunted outburst amplitudes from Table 1, calculated assuming constant background sources that are 3.0, 3.5, and 4.0 mag brighter than the parent quiescence brightness. The best match to the dwarf nova distribution is for a background source that adds 3.5 mag of light to the parent quiescence magnitude.
 |
The widths of the parent distributions in the bottom three panels of Figure 15 are less than the DN distribution width by about a factor of 2. This could reasonably be taken as an important evidence against the idea of "extra" light being responsible for stunted outbursts. However, the distribution of the amplitudes of stunted outbursts could be made more narrow by some combination of the following effects: (1) The distribution of amplitudes of DN eruptions is from well‐sampled data, usually dozens of visual observers. However, the distribution of amplitudes of stunted outbursts is from more poorly sampled RoboScope data, where the peak of the outburst is sometimes missed. (2) Low‐amplitude stunted outbursts could be missed entirely in the RoboScope data, narrowing the apparent distribution. (3) Z Cam systems broaden the DN distribution because their amplitudes are systematically smaller than those in U Gem systems. However, Z Cam systems are brighter than U Gem systems at the same orbital period. Being brighter, a Z Cam system could compete more effectively against a constant background source, so their amplitudes would not be attenuated as effectively. This effect could also narrow the amplitude distribution of the stunted outbursts compared to DNs.
2.4. Summary of the Similarities
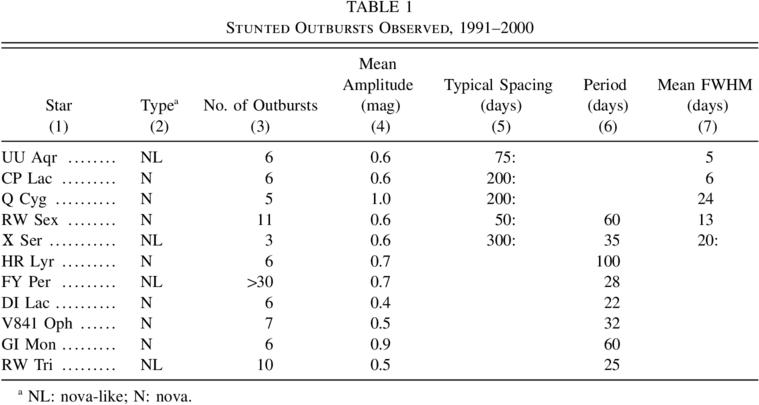
Table 1 summarizes the characteristics of stunted outbursts detected by RoboScope. The data are from HRT98, updated by a few new detections of spaced outbursts, plus the information on continuous stunted outbursts and outburst/dip pairs from this paper. Column (2) denotes nova‐like or old nova type, column (3) is the number of outbursts measured, column (4) is the mean amplitude, column (5) is the typical spacing in days for spaced outbursts, column (6) gives the period in days for continuous outbursts, and column (7) is the mean full width at half‐maximum (FWHM) in days for spaced outbursts. For continuous outbursts the mean FWHM is approximately half the period. Two systems have, at various times, both spaced outbursts and continuous oscillations.
It is seen that stunted outbursts in NLCVs have a range of widths and spacings that are similar to those of DNs, differing only in mean amplitude. Most of the phenomenology of DN outbursts, particularly those of Z Cam systems, are seen to be represented among the stunted outbursts. This includes spaced outbursts, continuous outbursts, and isolated outburst/dip pairs. Like DN eruptions, each NLCV having stunted outbursts appears to have its own characteristic amplitude, which differs from star to star. The periodograms of stunted outbursts and DN eruptions are similar, with most of the power between 15 and 50 days. The coherence and stability of the recurrence intervals of stunted OBs have properties similar to those of DNs, including unexpected coherence over ∼100 cycles for at least one system with stunted outbursts and one system with DN outbursts. Finally, it is noted that NLCVs are more luminous on average than DNs (at the same orbital period) by about 3 mag. The total energy of a 0.7 mag OB in a NLCV is therefore not very different from a typical 3.5 mag outburst on a DN that is 3 mag fainter. This similarity in total energy between stunted outbursts in NLCV and DN eruptions completes a rather compelling set of similarities that argues in favor of stunted outbursts being due to the familiar thermal disk instability, just as in dwarf novae.
2.5. Discussion
This paper argues that, among the various possibilities discussed in HRT98 for the nature of stunted outbursts, additional observations now favor an accretion disk instability seen under unusual circumstances. That circumstance may be an extra source of light which diminishes the apparent amplitude of the disk outburst. Under this hypothesis up to 90% of the visible light in NLCVs is from this background source. Nevertheless, most NLCV disks are concluded to be above M˙crit, because most NLCVs do not have stunted outbursts. However, as discussed in HRT98, the meager literature estimates of M˙ for the NLCV RoboScope program stars do not support the idea that those NLCVs having stunted outbursts are systematically the lower M˙ portion of the NLCV population. Perhaps this situation is due to the hypothesized background source varying in strength from system to system so as to obscure any dependence of the presence of stunted outbursts on M˙; that is, the strength of the background source seems to be uncorrelated with M˙.
Several possibilities for the nature of this background source were briefly discussed in HRT98. We emphasize here a point briefly mentioned in HRT98. Judging from extensive RoboScope data, there is no correlation of the system brightness with the appearance of stunted outbursts, either within a given system or from system to system. This would appear to rule out accretion luminosity as the source of the background light. If the extra light is derived from accretion energy, then a system should become fainter as M˙ falls to make the disk unstable to the thermal instability. This appears to argue against an irradiated, truncated disk (Warner 1995b; Leach et al. 1999) in a high‐M˙ system being somehow responsible for the stunted outburst phenomena. Such a configuration would leave the inner disk in an ionized, high‐viscosity state, which would respond quickly to changes in M˙. Casting an initial wide net, this leaves as possibilities for the postulated background light rotational energy, magnetic energy, radiation from a hot white dwarf, or hydrogen burning on the white dwarf.
An intriguing possibility for the background source is nuclear burning on the white dwarf, for which some qualitative comments can be made. It seems very unlikely that NLCV M˙ values are high enough to allow nuclear burning over a significant portion of the area of the white dwarf. Rather, the nuclear burning, if present, probably takes place at the base of magnetic accretion column(s). The NLCV systems discussed here are certainly not polars with B≳107 G, but may nevertheless have magnetic fields in the range 105–107 G without producing conspicuous signatures of an intermediate polar (Patterson 1994). Supersoft X‐ray binaries (SSBs) are found among several kinds of interacting binaries that are related to CVs (Steiner & Diaz 1998; Patterson et al. 1998; Gänsicke et al. 2000). SSBs are thought to be accreting at rates high enough to permit quasi‐steady nuclear burning (van den Heuvel et al. 1992; Di Stefano & Nelson 1996). Nuclear burning is expected to produce anomalous abundance patterns. Interestingly, during a low state of the VY Scl NLCV system TT Ari, Gänsicke et al. (1999) reported a depression of the C/N ratio on the white dwarf by a factor of 8–10, consistent with thermonuclear processing. This situation may be due to material processed by an earlier nova explosion in the system, captured by the secondary, and returned to the white dwarf via accretion. This is the mechanism proposed for similar anomalous abundance patterns found on the white dwarfs of the dwarf novae VY Hyi (Sion et al. 1995) and U Gem (Sion et al. 1998). However, quasi‐steady nuclear burning cannot be ruled out. In fact, Greiner et al. (1999) have argued that the NLCV V751 Cyg is a transient SSB based on its X‐ray characteristics, and they speculate that other VY Scl stars may also be of this type. In any case, careful modeling will be needed to adequately explore this idea.
Finally, it is worth noting an apparent correlation of the presence of stunted outbursts with the time that has elapsed since the nova explosion. There are 22 old novae on the RoboScope monitoring program. For 14 novae with dates between 1848 and 1936, stunted outbursts can be seen in seven. For those novae between 1937 and 1986, none of the eight have shown stunted outbursts. One of the latter group is Nova Her 1960 (=V446 Her), which now has normal (not stunted) dwarf nova outbursts (Honeycutt et al. 1998a). Regardless of how V446 Her is counted, it appears that most novae must age for a number of decades before stunted outbursts can become apparent.
It is a pleasure to thank Todd Boroson, who managed the KPNO Queue Program when the FY Per spectrum was acquired, the numerous AAVSO observers who contributed to the Z Cam light curve, and the AAVSO staff who prepared the light curve. Jeff Robertson, Todd Hillwig, George Turner, and Brice Adams have been valued participants in keeping RoboScope running and productive. Finally, the helpful comments of the referee are acknowledged. This work was partially supported by NSF grant AST 95‐28169.