
ABSTRACT
We present low‐resolution (∼6 Å), high signal‐to‐noise spectropolarimetric observations obtained with the new William‐Wehlau spectropolarimeter for the apparently brightest Wolf‐Rayet star in the sky, the 78.5 day WR+O binary γ2 Velorum. Quasi‐simultaneous monitoring of all four Stokes parameters I(λ), q(λ), u(λ), and v(λ) was carried out over an interval of 31 nights centered on periastron. All emission lines in our observed wavelength interval (5200–6000 Å) show highly stochastic variations over the whole run. The phase‐dependent behavior of the excess emission in the C iii λ5696 line can be related to the wind‐wind collision phenomenon. Varying features of Stokes q and u are seen across the strong lines, probably as a result of variable electron scattering of mainly continuum light. The spherical symmetry of the WR wind is thus broken by the presence of the O companion and clumping in the WR wind. Similar features in the extended red wing of the C iii λ5696 emission line remain unexplained. No obvious circular line polarization features are seen across any emission line above the 3 σ ∼ 0.03% instrumental level.
Export citation and abstract BibTeX RIS
1. INTRODUCTION
The object γ2 Velorum (WR 11 = HR 3207 = HD 68273; spectral type WC8+O7.5–8 III–II) is the apparently brightest Wolf‐Rayet (WR) star in the sky. It is a nearby binary system (d = 258+41-31 pc: Schaerer, Schmutz, & Grenon 1997; van der Hucht et al. 1997) with an orbital period of 78.53 days (Schmutz et al. 1997, who also give a complete description of the orbit) and has the potential to represent a prototype of wind‐wind interaction for massive stars with strong winds. Between the two stars the winds come to a complete stop at the stagnation point and material flows along a shock cone that wraps around the weaker wind O star (e.g., Stevens, Blondin, & Pollock 1992). The shock region, caused by collision at supersonic wind velocities, creates highly excited material that leads to excess emission via fast radiative cooling of the shocked gas (see, e.g., St‐Louis, Willis, & Stevens 1993). Bartzakos (1998) used modified minimum spectra of the C iii λ5696 line to estimate the collision excess in a number of short‐period (2–16 day) WC+O binaries. For γ2 Vel, such a method has been slow in coming, probably because of its inconveniently long orbit and the presence of short‐term stochastic multiscale structures in the C iii λ5696 line of γ2 Vel (Lépine, Eversberg, & Moffat 1999). It was only after completing this project that we became aware of the spectroscopic study of Schweickhardt et al. (1999).
In this paper we concentrate on (1) the search for periodic line profile variations, following the contradictory reports of Jeffers, Stiff, & Weller (1985 and references therein) and Taylor (1990); (2) the behavior of the C iii λ5696 line during periastron passage, in the anticipation that for WC stars this particular line should be the best indicator of a wind‐wind collision in the optical (Bartzakos 1998); and (3) the search for any manifestation of a magnetic field and deviations from spherical symmetry in the WR wind.
The relatively long orbital period remains a practical handicap for a better understanding of γ2 Vel. For this reason we have attempted to answer some of these questions by observing prominent emission lines mainly around periastron passage, when the orbital configuration changes fastest.
2. OBSERVATIONS AND DATA REDUCTION
The star γ2 Vel was observed during a 5 week run in 1997 February/March with the William‐Wehlau spectropolarimeter (Eversberg et al. 1998b) mounted on the 0.6 m telescope at the University of Toronto Southern Observatory (UTSO) on Las Campanas, Chile. We obtained spectra in all four wavelength‐dependent Stokes parameters I, Q/I≡q, U/I≡u, and V/I≡v during 21 nights between February 18 and March 20 within Δϕ ∼ ± 0.2 of periastron passage (ϕ = 0.00; O star in front at ϕ = 0.03; WR star in front at ϕ = 0.61). Individual spectra in I were obtained every ∼3 minutes, providing a typical signal‐to‐noise ratio of ∼400 pixel−1 in the continuum (∼600 in the strong C iii λ5696, C iv λ5806 emission lines). Using the Garrison spectrograph (Garrison & Beattie 1990), the 3 pixel spectral resolution was about 6 Å (∼320 km s−1) in the wavelength range 5200–6000 Å, covering mainly the He ii λ5411, C iv λ5471, C iii λ5696, C iv λλ5802, 5812, and He i λ5875 emission lines. Unfortunately, the data for nine nights (February 22–March 2) are of no use as a result of problems discovered later with the CCD readout.
As a consequence of the nonperfect behavior (as predictable for a fiber‐fed system) of the polarimeter unit (see Eversberg et al. 1998b, who also give a detailed description of the data calibration procedure), we had to normalize the mean Stokes parameters q(λ), u(λ), and v(λ) to zero, so that only relative line polarization could be obtained. This means that we were not able to estimate the degree and orientation of broadband polarization on the sky. Only relative line polarization and its variability were detectable.
3. RESULTS AND DISCUSSION
With our insufficient orbital coverage and low spectral resolution, we do not attempt to improve the orbital parameters. However, as a quick check we measured the central wavelengths of all prominent WR emission lines by fitting a single Gaussian profile.
Our velocity measurements for C iv λ5471 match best the predicted emission‐line orbit (Schmutz et al. 1997). This is not surprising because this line is most Gaussian‐like in form, unblended and well isolated. C iv λλ5802, 5812 also fits fairly well, although this line is not of pure Gaussian form and is blended. All other moderately strong emission lines tend to follow the general shape of the orbital motion, but with increased amplitude. This increase is especially evident in He i λ5876 and, to a lesser extent, in C iii λ5696 emission. This is primarily caused by the additional emission component changing its position on top of the underlying broad emission line as the stars go through periastron (see below).
Contributing ∼80% of the total continuum visual light (De Marco & Schmutz 1999), the O‐star companion exhibits absorption lines mainly at He ii λ5411, O iii λ5592, and He i λ5875 in our spectra. Our relatively low spectral resolution does not allow a proper study of these lines, which in any case do not appear to show any significant variability in our spectra.
3.1. Stochastic Short‐Term Variations
After co‐adding all nightly spectra to yield a mean for each night and Doppler correcting them into the WR rest frame using the Schmutz et al. orbit, we co‐added all nightly means to a global mean of the whole run. This global mean was then subtracted from the individual spectra in the WR frame, thus allowing us to study short‐term (∼hourly) variations. The resulting gray‐scale plots of these residuals and the global mean are shown in Figures 1–3, for three consecutive intervals in orbital phase. In order to explore the global variability, we calculate the standard deviation of pixel i:
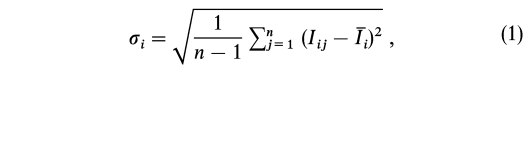
where Iij is the rectified intensity of pixel i of the jth spectrum and I-i is the global mean spectrum at pixel i. The results are shown in Figure 4 (bottom). Inspection of Figures 1–3 allows us to conclude the following:
- 1.C iii λ5696.—The most prominent nightly residuals are found in this line, which is already known to show stochastically emerging subpeaks with gradual motion away from the line center (Lépine et al. 1999: two‐night high‐resolution observations around phase ϕ = 0.26–0.29). Although our data are of lower resolution, we can confirm this kind of stochastic variability over a much longer timescale and far broader phase coverage. The movement of these subpeak features is well established in WR stars (e.g., Lépine 1998; Lépine & Moffat 1999) as well as in the O supergiant ζ Puppis (Eversberg, Lépine, & Moffat 1998a) and interpreted as due to regions of higher density moving radially outward from the star and seen in projection in the line of sight.
- 2.C iv λλ5802, 5812.—In accordance with the idea of wind stratification (Kuhi 1973; Schulte‐Ladbeck et al. 1995, and references therein), C iv λλ5802, 5812 is assumed to be formed closer to the WR star than C iii λ5696. One might expect to detect stochastic variability in C iv λλ5802, 5812 if the whole wind is structured. The variations are indeed detectable in C iv but are slightly smaller than in C iii (Fig. 4). We find no clear correlation between the deviations in C iii λ5696 and C iv λλ5802, 5812, partly because of the blended nature of the C iv line.
- 3.All the other three major observed emission lines are weaker, and the variability is sometimes close to the limit of detectability with our low spectral resolution. The two helium lines He ii λ5411 and He i λ5875 are also affected by absorption of the O‐star component. This absorption is easily detected in He ii λ5411, crossing the emission from blue to red during our run, in agreement with the predicted orbit. For He i λ5875 the O‐component absorption is much less clear. A stochastic component of variability seems to dominate in this line, being loosely correlated with the variations in the C iii λ5696 line. Variability in the C iv λ5471 line is also detectable but without sufficient quality to draw quantitative conclusions. Allowing for statistical fluctuations, the variation profile across the line, σ(λ) (Fig. 4, bottom), roughly follows the same basic shape of the line profile I(λ) itself, with σ(λ)/[I(λ) - Ic] ∼ 5% for C iii λ5696, ∼4% for C iv λλ5802, 5812, ∼10% for He ii λ5411 and He i λ5875, and ∼3% for C iv λ5471. The effect of Poisson statistics for stronger lines is negligible (≲0.5%) compared with the intrinsic line variations.
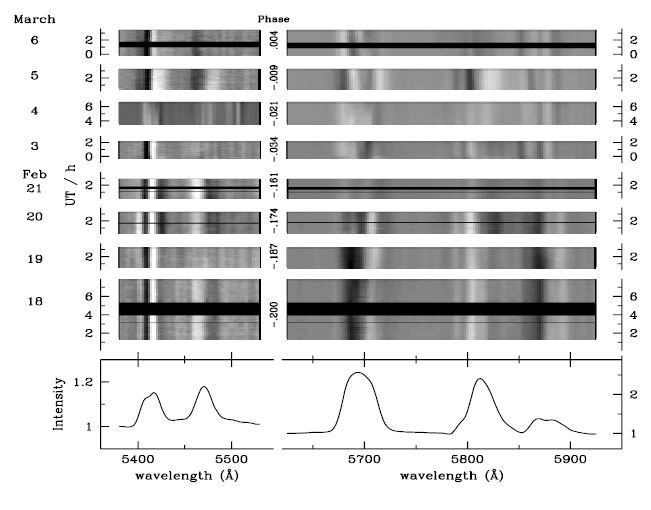
Fig. 1.— Observed spectra of γ2 Vel shifted to the WR frame for the nights of 1997 February 17/18–March 5/6. Top: Gray‐scale plots of residuals from the mean rectified spectrum of the whole observing run plotted in time (stretched appropriately to fill in small time gaps) vs. wavelength. The gray‐scale range is z = 0 ± 0.1 for the wavelengths 5380–5530 Å (left) and z = 0 ± 0.2 for the wavelengths 5620–5920 Å (right), z being the residual in continuum units. Different phases and respective UT dates and times are indicated. Bottom: Global (whole run) mean spectrum in the WR frame.
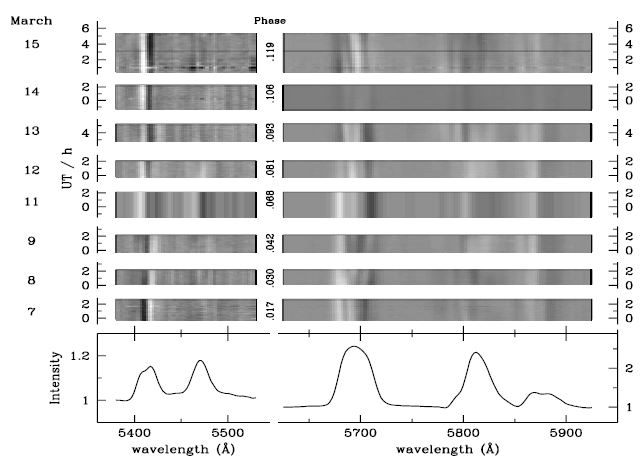
Fig. 2.— Same as Fig. 1 but for the nights 1997 March 6/7–14/15
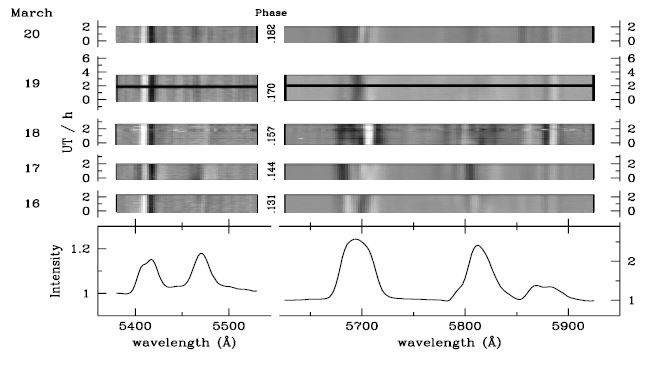
Fig. 3.— Same as Fig. 1 but for the nights 1997 March 15/16–19/20
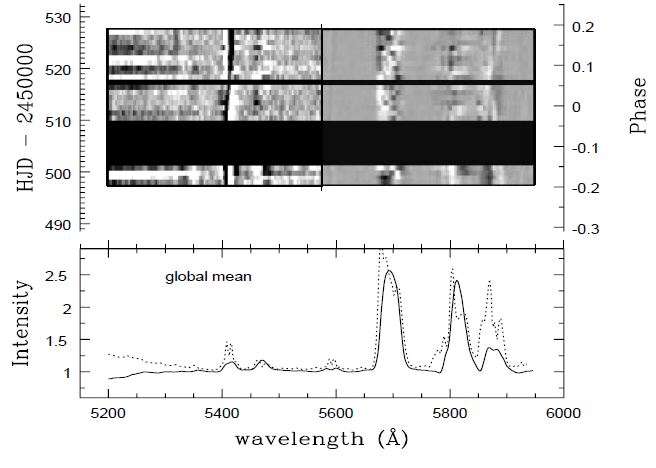
Fig. 4.— Long‐term line variability. Bottom: Mean rectified spectrum (solid line) and standard deviation σ (dashed line) for the whole observing run in the WR frame. The σ profile is expanded by a factor 20 and shifted by 1 in intensity, to match the mean rectified line profile as closely as possible. Top: Gray‐scale plot of residuals from the global mean rectified spectrum of each night plotted in time (stretched appropriately to fill in time gaps) vs. wavelength. The spectra have been Doppler corrected into the WR rest frame by using the orbit determined by Schmutz et al. (1997). The gray‐scale range is z = 0 ± 0.1 for the wavelength interval 5200–5575 Å and z = 0 ± 0.2 for 5575–5950 Å.
3.2. Periodic Short‐Term Variations
Do the observed emission lines show periodic variations on short timescales?
There are numerous, although controversial, reports about short‐term variability in the spectrum of γ2 Vel, summarized in Jeffers et al. (1985): the profiles (or the line flux measured in the narrowband filters centered on prominent emission lines) show rapid, sometimes periodic variations on a typical timescale of 150–200 s. Far longer, P = 1.26 hr and/or P = 2.0 hr, coherent variations were discovered by Taylor (1990) in extensive narrowband photometric data (He ii λ4686 line and adjacent continuum) obtained at the South Pole.
Our data set allows us to search for periodic line profile variations in the relatively broad range, 6 minutes≤P≤15 days, on the high‐quality spectra taken every ∼3 minutes over a typical interval of 2–3 hr in each of 21 nights during the 31 day run. Visual inspection of the individual spectra shows no apparent short‐term (∼minutes) variability. However, the spectra do vary on a much longer (∼hours) timescale.
In order to search for a periodic component in the line profile variations, we have calculated power spectra (PS) using the technique of Scargle (1982). The raw PS were then reprocessed with the CLEAN algorithm in order to remove (reduce) the aliases and spurious features introduced by the unevenly spaced nature of the data (see Roberts, Lehár, & Dreher 1987). The calculations were performed for each wavelength pixel, using intensity readings in the spectra rebinned in a similar manner and Doppler corrected for orbital motion to the WR frame.
We started by analyzing individual nights, each consisting of 40–73 spectra. From here on we refer to the results obtained for the C iii λ5696 emission line only (C iv λλ5802, 5812 behaves similarly). We find no significant, periodic variations in the CLEANed PS over the 50–75 day-1≤ν≤250 day-1 frequency domain, with amplitudes exceeding the 3 σ level of ∼15% of the line intensity. The nightly PS show some rise, roughly as ν−1, toward lower frequencies, ν≤50–75 day−1, with typically three to five broad peaks slightly exceeding the 3 σ level. We disregard these details as true indicators of periodic variations for two reasons: (1) the low‐frequency structures are practically never repeated in consecutive nightly PS; (2) far more important, the peak structure is mimicked by the adjacent continuum. We know that the continuum is not involved in any periodic short‐term activity (Taylor 1990). Thus, we interpret these low‐frequency features as low‐amplitude remnants of imperfectly CLEANed spectral windows, i.e., as artifacts arising from the uneven data sampling and finite lengths of the data records.
With no positive periodic detection in any of the nightly data sets, we combined the observations into blocks of three consecutive nights and repeated the analysis. The results are invariably negative, with no periods of A>3 σ (∼6% of the line intensity) for 50–75 day-1≤ν≤250 day−1. There is some rise in the PS toward lower frequencies, ν≤50–75 day−1, with broad peaks superposed on the ∼ν−1 sloped PS. Even larger blocks of ∼week intervals bring the detectability limit down to A≤3% of the line intensity, with no significant periodicity. The last step is to analyze the complete data set. For this we averaged the spectra of a given night into two to five group averages (depending on the level of variability and the number of spectra for the given night) and calculated the PS for the resulting 54 group means. Again, there is no indication of significant periodicity in the 0.07 day-1≤ν≤10 day−1 frequency interval.
The only positive result we can infer from this exhaustive search is the ∼ν−1 rise in the low‐frequency part of the PS, probably indicating that we have detected aperiodic variations on timescales of Δt≥0.5 hr.
3.3. Long‐Term Variations
To monitor the phase‐locked, long‐term WR line variability through periastron passage, we created nightly mean residuals, plotting them in Figure 4. Significant long‐term variations occur across the lines. All major lines but He ii λ5411 show some excess variability on their blue flanks. This is not explainable by purely stochastic variability due to uniformly distributed clumps in a spherically symmetric wind but can be related to binary‐induced effects (see § 3.4). The strong variations in the He ii line are mainly due to the O‐star absorption feature, clearly detected as moving across the line during our run and producing symmetric peaks in σ(λ) in Figure 4.
In Figure 5 we show the measured nightly averaged equivalent widths, Wλ, for the five prominent emission lines, corrected for the phase‐dependent continuum variations of Marchenko et al. (1998b). As one can see, the C iii λ5696 and He i λ5875 line fluxes slightly increase before and then decrease after periastron passage with a maximum around closest approach, as was previously observed in C iii λ5696 by St‐Louis (1996). In contrast to C iii and He i, the three other lines, all of higher ionization level, show no significant dependence on orbital phase. Additionally, there are large stochastic equivalent width variations in all prominent emission lines far exceeding the measurement errors. The phase‐dependent changes in the C iii λ5696 and He i λ5875 fluxes roughly follow a 1/r dependence, where r is the orbital separation, as expected for the excess emission formed in the wind‐wind collision zone (Stevens et al. 1992).
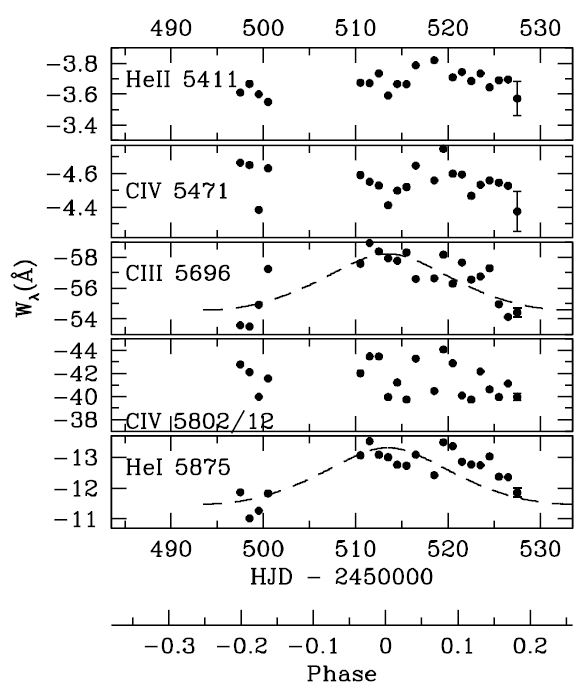
Fig. 5.— Equivalent widths of the nightly average emission lines, corrected for the phase‐dependent continuum variations (Marchenko et al. 1998b). The typical 2 σ errors estimated in accordance with Chalabaev & Maillard (1983) are indicated on the last data point of each plot. Dashed lines represent the relative inverse separation (arbitrary scale and zero point) between the two binary components.
3.4. Ciii Excess
Although both He i λ5875 and C iii λ5696 reveal similar phase‐dependent long‐term variations, here we concentrate on C iii, since it is stronger and less blended than He i: the most recent attempts to quantify the O‐star spectrum point to a O7.5–8 III–II spectral type (Schaerer et al. 1997; De Marco & Schmutz 1999), rejecting the previously suggested classification as a supergiant. For a typical O8 III star one may expect to see only weak, if any, emission at C iii λ5696 (Walborn 1980), especially in view on the absence of any emission in the restored O‐star Hα profile (De Marco & Schmutz 1999). Neglecting the possibility of C iii λ5696 emission from the O star, we may consider the C iii λ5696 emission profile as consisting, in principal, of four different components: (1) emission from a constant, presumably spherically symmetric WR outflow (see below); (2) stochastic subfeatures due to clumping in the WR wind (Lépine 1998); and (3) phase‐dependent excess emission created by colliding wind in a shock cone around the O star and (4) by heating of the WR wind by the O star. Effect 4 is seen even in some binaries with relatively large separation, e.g., the 21 day WN5+O binary WR 141 (Marchenko, Moffat, & Eenens 1998a). We do not consider WR atmospheric eclipses, as such are proved to be important in γ2 Vel (Schweickhardt et al. 1999) only around phases when the WR star is in front; these phases are not covered by our observations.
Disentangling these four components is a delicate problem, although successfully done for components 1 and 3 in several WR+O binaries (e.g., Marchenko et al. 1997; Moffat et al. 1998; Moffat, Marchenko, & Bartzakos 1996; Bartzakos 1998; Bartzakos, Moffat, & Niemela 1995). We have tried to distinguish between the excess emission and the globally spherically symmetric (however, locally clumpy) outflow under the following assumptions:
- 1.Emission arising from sources 3 and 4 is expected to be separation dependent, being weakest at apastron. This is indeed seen for γ2 Vel in Figure 5 as well as in the data of Schweickhardt et al. (1999). In this case the minimum intensity spectrum in the WR frame over an extended observing run for a highly elliptical binary might represent the spherically symmetric WR outflow fairly well.
- 2.In the present data set, the largest projected separation between the two components occurs at ϕ = ±0.2. In a zeroth approximation we use the actual minimum profile of the whole run as a representation (in reality an upper limit) of the spherical wind. We use this on γ2 Vel to test the shock‐cone model developed by Lührs (1991, 1997).
Following this recipe, we Doppler corrected all the spectra of γ2 Vel into the WR rest frame and derived a global minimum spectrum. This minimum spectrum was then subtracted from the nightly mean spectra to obtain nightly excess emission spectra. The resulting gray‐scale plot and the global minimum, mean, and maximum spectra of the whole run for the wavelength interval 5640–5940 Å are shown in Figure 6. As one can clearly see in Figure 6, excess emission above the minimum in C iii λ5696 and, less clearly, He i λ5875 is phase dependent. This feature moves from the red to the blue line flank and back during the run. This excess emission causes large deviations in the RV curves of He i λ5875 and C iii λ5696 from the "normal" orbital motion, as mentioned above.
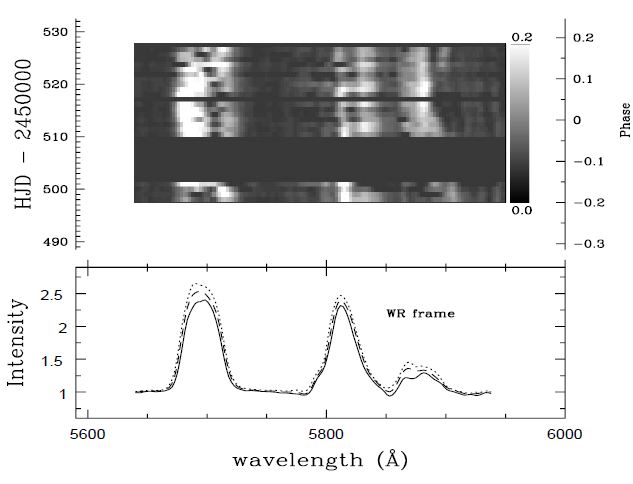
Fig. 6.— Nightly excess emission spectra above the minimum level. Bottom: Global minimum (solid line), mean (dashed line), and maximum (dotted line) profile for the whole observing run in the WR frame. Top: Gray‐scale plot of residuals from the global minimum spectrum of each night plotted in time (stretched appropriately to fill in time gaps) vs. wavelength. The spectra have been Doppler corrected to the WR frame by using the orbit determined by Schmutz et al. (1997). The gray scale ranges over z = 0–0.2, as indicated on the right.
Lührs (1991, 1997) has developed a simple model to describe the phase‐dependent variations of the excess emission in WR+O binaries with circular orbits. Assuming optically thin emission from a hot plasma wrapping around the O‐star component and moving with velocity vs along a cone with opening half‐angle Θ, deflected in the orbital plane by an angle δϕ due to the Coriolis effect associated with orbital motion, one finds (see also Moffat et al. 1998) that the double‐peak excess emission from the cone has an average velocity v- and peak‐to‐peak width 2v* of
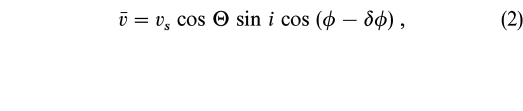
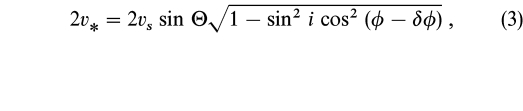
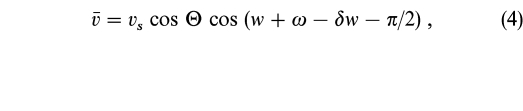
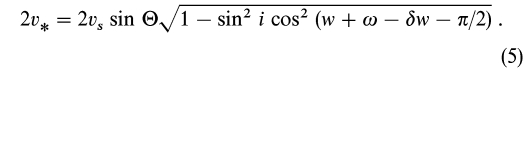
with φ the orbital phase ∈{0,2π} and i the inclination. For the analysis of γ2 Vel with an eccentric orbit we follow Moffat et al. (1998), by replacing φ by w + ω - π/2 and δϕ by δw, with w the true anomaly and ω the usual periastron angle:
In our situation with the high intrinsic noise level of the variations and the uncertainty in the appropriate template profile to extract the excess emission, v- and 2v* are not clearly defined. For this reason we calculated a more robust value of a weighted average line‐of‐sight (LOS) velocity v- with
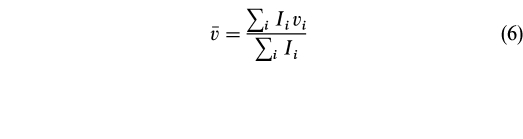
and a weighted average width 2σ to characterize the peak separation, adding a constant 2vc:
with vi the LOS velocity and Ii the residual line intensity at pixel i. The newly introduced constant 2vc reflects the fact that the bow‐shock emission is likely to be significantly broadened as a result of large‐scale turbulence (Walder & Folini 1998) in the wind‐wind collision zone.
To test our procedure we also created a true minimum and various smoothed (boxcar of 3, 5, 7 and 9 pixels) minimum spectra from the γ2 Vel data and a minimum template from the smoothed C iii line of WR 135 (data from Lépine & Moffat 1999). The latter template was produced by normalizing the C iii line of WR 135 in height and width to C iii in γ2 Vel via simple comparison of its lower, less variable part. Note that WR 135 has the same subtype and even wind terminal velocity as the WR component in γ2 Vel. Smoothing of the minimum spectra of γ2 Vel does not significantly change the output results. However, the WR 135 template was found to be unsatisfactory, due to the subtle differences in the uppermost parts of the profiles. Thus, we retain the true minimum (no smoothing) profile of γ2 Vel in our modeling (Fig. 7). As we face the serious problem of the unknown true minimum spectrum, with the additional complication from the presence of large stochastic line variations, we are not able to perform a quantitatively meaningful multiparametric fit to find the values of vc, vs, θ, δw, and i. Instead, whenever possible, we use known or otherwise reasonable values for these parameters.
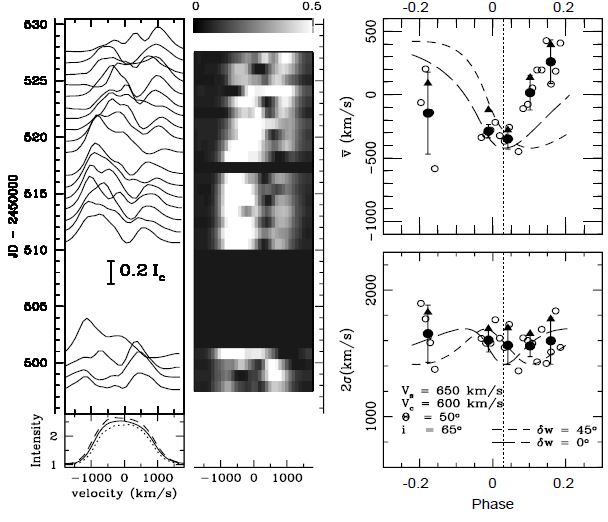
Fig. 7.— Extracted C iii λ5696 excess emission spectra of γ2 Vel for different orbital positions in the observer's frame. Top left: Intensity plot of nightly residuals from the minimum spectrum of the whole observing run plotted in time vs. LOS velocity. Bottom left: Global maximum (long‐dashed line), mean (solid line), and minimum (dotted line) line profile of C iii λ5696. Center: Gray‐scale plot of nightly residuals from the minimum line profile plotted in time (stretched appropriately to fill in time gaps) vs. LOS velocity. The gray‐scale range is z = 0–0.2. Right: Comparison of the observed average velocities (top) and line widths (bottom) of the excess emission with the Lührs model. Open circles: Excess using the global minimum for each night. Filled circles: Average excess emission of four‐night bins (2 σ error bars are indicated). Filled triangles: Average excess emission of four‐night bins including backscattered light. The vertical dotted lines indicate the position when the O star is in front of the WR component. The short‐dashed curves represent the theoretical calculation using the Lührs model with δω = 45°; the long‐dashed curves are for δω = 0°.
The short‐dashed and long‐dashed lines in Figure 7 show the predictions of the Lührs model for two values of δw. Willis, Schild, & Stevens (1995) estimated Θ ∼ 25° from their ROSAT X‐ray observations. In fact, the opening angle might be at least a factor of 2 larger, judging by the appearance of the O‐star high‐velocity absorption ∼0.09 in phase before periastron passage (St‐Louis et al. 1993). Also, the revised M˙ of the WR star [M˙ = (0.7–3.0) × 10-5: Schmutz et al. 1997; Schaerer et al. 1997; Nugis, Crowther, & Willis 1998] leads to Θ = 45°–68°, using the formalism from Eichler & Usov (1993) and Canto, Raga, & Wilkin (1996). The latter value of Θ must be treated as an upper limit because of the reclassification of the O component from O9 I to O8 III (Schaerer et al. 1997), with potential diminishing of M˙(O star). We assume that the Coriolis deflection δw lies somewhere between 0° and 45°, judging by the phase dependence of the X‐ray flux. First, we fix the stream velocity, vs = 650 km s−1, the cone‐opening half‐angle Θ = 25° (Stevens et al. 1996), i = 65°, and two different values of the Coriolis deflection, δw = 0° (long‐dashed line) and δw = 45° (short‐dashed line). Note that the model is not very sensitive to the choice of i within the proposed range i = 65° ± 8° (Schmutz et al. 1997). This leaves us with the only unaccounted for free parameter 2vc. Formally chosen as 2vc ∼ 2σturbulent (up to 400 km s−1 in γ2 Vel: Lépine et al. 1999), it does not apply in practice to the observational data. Obviously, this parameter is heavily biased by the subtraction of a probably inadequate template. Because of the nature of this bias, we expect 2vc to be somewhere between 2vturbulent ∼ 400 km s−1 and 2vshock≅2300–2600 km s−1 (twice the velocity of the WR wind entering the wind‐wind collision zone; see St‐Louis et al. 1993). Indeed, we find 2vc = 1200 km s−1 as a reasonable compromise to match the data.
With the above parameters we find that the modeled variations in v- far exceed the observed amplitude. This can be counteracted by increasing the opening angle Θ. This additionally affects δw, requiring δw≪45°. The possibility of increasing Θ is related to the revised M˙(WR), as mentioned before, and also to the strong wind braking effect (sudden deceleration of the WR wind by the O‐star radiation just before it enters the bow‐shock zone) predicted for this system (Gayley, Owocki, & Cranmer 1997). We therefore change Θ from 25° to 50°, taking this as a tentative estimate. The change brings the calculated v- much closer to the data.
However, despite the qualitative similarity of the observed and modeled v- curves, there are large systematic deviations. The first reason for this might be the unaccounted presence of light from the O star backscattered off the WR wind, especially important around periastron passage. We include this process in our model, however rather schematically, approximating the scattered light by a Gaussian profile of fixed central intensity and half‐width. We also allow for the Doppler shift of this component in accordance with the orbital motion as well as a δw = 45° phase deflection (as an upper limit of the redistributed flux). This deflection is based on the consideration of overheating of the O‐star surface by the X‐ray flux coming from the bow‐shock head (see Gies, Bagnuolo, & Penny 1997). Yet another potential source of deviation between observed and modeled v- curves may arise from the absorption‐like feature which appears to cross the excess emission from red to blue around JD 2,450,525. We have no explanation for this feature.
Inclusion of backscattered light does not remove the disparity between the modeled and observed v-. We have no feasible explanation for these deviations. However, we can conclude that the backscattered light plays a relatively minor role in the observed phase‐related line‐profile variations. We share this conclusion with St‐Louis et al. (1993). Considering the number of assumptions required to obtain the minimum C iii profile, along with the strong profile variations unrelated to the wind‐wind collision, our model provides only a qualitative indication that the wind‐wind collision is likely at work in this system.
Some support for our results comes from an independent study. Recent analysis of optical line emission and its variability in γ2 Vel has been carried out by Schweickhardt et al. (1999). By comparing their data from an extended observing run with a model for occultation effects developed by Auer & Koenigsberger (1994), they conclude that the observed line profile variability around periastron passage in C iii λ4650 (partly blended with C iv λ4658) cannot be explained by occultation. They therefore state that the excess C iii λ4650 emission arises, at least partly, from wind‐wind collision in γ2 Vel.
The most interesting detail readily seen in Figure 2 of Schweickhardt et al. (1999) is the swift change, by as much as 1000 km s−1, of the velocity of the excess emission in C iii λ4650 at φ between −0.15 and −0.10. This is confirmed by our observations in Figure 7, where one sees a ∼500 km s−1 jump in v- for C iii λ5696 at ϕ ∼ -0.15. This phenomenon repeats over many orbital cycles; hence, we discard stochastic wind variability as a cause. We note that around periastron passage, the changing wind momentum balance (see Gayley et al. 1997) may provoke crashing of the WR wind onto the O‐star surface. This may significantly change the mass load into the wind‐wind collision zone as well as its geometry (phase‐variable Θ and reduced δw) and physical conditions, increasing the emissivity from the wind‐wind collision component (note the rise in Wλ of He i and C iii in Fig. 5), thus creating much stronger extra blueshifted emission, and, finally, shifting the WR profile to negative velocities. It is relevant to note that the wind velocity of the O star tends to be lower during periastron passage (Stevens et al. 1996), which might signify an abrupt change in the dynamics of the wind‐wind collision process.
Another detail to be mentioned is the pronounced asymmetry between the ingress‐egress behavior of the excess emission, suggestive of more gradual liftoff of the shock from the O‐star surface after the initial swift crushing. This asymmetry is probably created by the orbital motion of the components, in direct analogy to another highly eccentric colliding‐wind binary, ι Orionis (Pittard 1998).
Now we are able to explain the excess variability in the blue wing of the carbon and He i lines in Figure 4. According to the Lührs model with allowance for crashing of the WR wind onto the O star, strong excess emission is expected to shift to the blue when the O star is approximately in front, i.e., around periastron passage. This introduces larger values for the scatter σ in the blue wing of our data. This is clearly detected in all the five strong emission lines, except He ii λ5411, where the excess emission is masked by the strong O‐star absorption.
3.5. Polarization
The shock cone introduces a deviation from spherical symmetry in the WR wind so that, in principle, it could lead to phase‐dependent intrinsic continuum polarization. However, an even more important source of phase‐dependent continuum polarization is the scatter of O‐star light off free electrons in the WR wind (see St‐Louis et al. 1987 for γ2 Vel and other WC+O binaries). On the other hand, WR emission‐line flux in a binary will be practically unpolarized. This might cause some phase‐dependent variations of polarization occurring at the positions of the emission lines (see Moffat & Piirola 1994). In general, a flattened WR wind can also cause some line depolarization (see Harries, Hillier, & Howarth 1998), which however is not expected to vary with phase in a binary system.
To obtain sufficient accuracy in q, u, and v we co‐added all nightly Stokes parameters, Doppler corrected into the WR rest frame to provide global mean Stokes q, u, and v spectra for the whole run, consisting of ∼80 hr of exposure time in total. The result is shown in Figure 8.
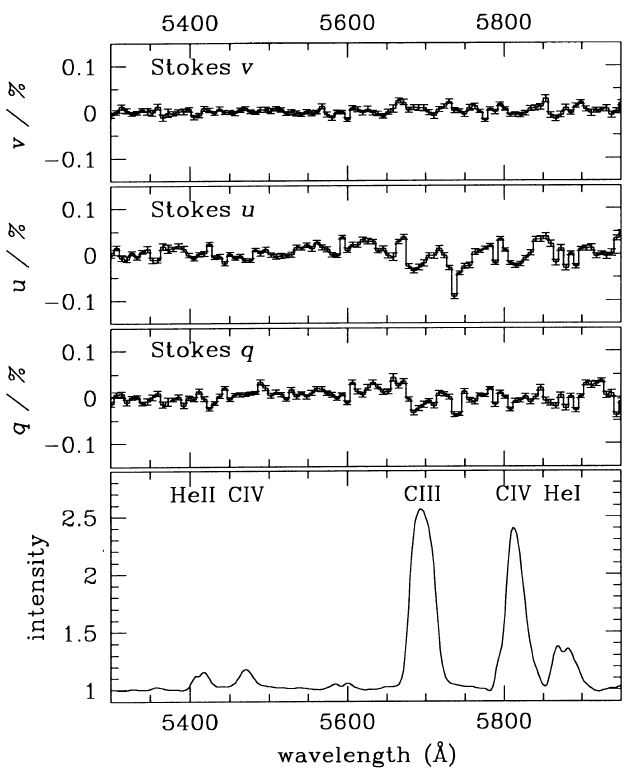
Fig. 8.— Mean rectified intensity spectrum (bottom) and mean Stokes q, u, and v (top) for the whole observing run in the WR frame. The polarimetric data have been binned by a 5 pixel boxcar. Formal 2 σ error bars are indicated.
We draw attention in Figure 8 to the depressions (∼0.05%) in Stokes q and u across the two strong lines of C iii λ5696 and C iv λλ5802, 5812, significantly above the 3 σ noise level, ∼0.03%. We calculate this precision limit from the featureless v(λ) spectrum between 5600 and 5950 Å.3 The He i λ5875 line also shows complex structure, although closer to the noise limit. Phase‐locked q, u variations in the continuum light, clearly seen around periastron passage in broadband polarization (St‐Louis et al. 1987), have probably diluted the line polarization effect, which for q and u is expected to be the largest at quadratures. Additionally, any regular variations across the line profiles are masked by omnipresence of the strong stochastic component. Thus, if there are any phase‐related variations in the Stokes spectra, our data do not reveal them.
We find no significant circular polarization along the whole mean vλ spectrum, in excess of the instrumental level of 3 σ ∼ 0.03%, although there are hints of variability at the blue edges of C iii λ5696, C iv λλ5802, 5812, and He i λ5876. The technique of magnetic field measurement has been described by Landstreet & Borra (1977a, 1977b), Borra & Landstreet (1980), and Landstreet (1977, 1982). Landstreet followed Unno (1956) by using the Milne‐Eddington approximation for the source function with presence of polarized light. For this case he derived
with 〈v〉 = (vred - vblue)/2, where vred and vblue are the fractional polarizations in the red and blue line wings, respectively, z is the Landé factor, and Be is the net effective longitudinal component of the magnetic field in units of gauss. In our case we have no recognizable differences between vred and vblue. For this reason we take 〈v〉≤0.03% (our calculated noise level).
Instead of estimating a magnetic field strength in an absorption‐line star with a visible photosphere, we use this equation for the emission lines from the extended wind in γ2 Vel. By using equation (8) we ignore the Doppler shifts experienced by flux coming from different parts of the stellar wind. On the other hand Mathys (1999) points out that equation (8) requires a correction factor of 4/5 to be applicable for emission‐line stars. By using equation (8) and this correction with the Landé factor z = 1 for this transition (31P0 - 31D), the slope of the line flanks, and the central line intensity of C iii λ5696, we translate the instrumental noise level into an upper limit on the net effective magnetic field in γ2 Vel: Be≤280 G.
4. SUMMARY
We have presented phase‐dependent spectropolarimetry for the WR+O binary γ2 Vel, obtained with the new William‐Wehlau spectropolarimeter. In the wavelength range 5200–6000 Å this includes the dominant lines of He ii λ5411, C iv λ5471, C iii λ5696, C iv λλ5802, 5812, and He i λ5875. All four Stokes parameters I, q, u, and v have been obtained quasi‐simultaneously during an extended run through periastron passage (ϕ = -0.2 to 0.2). We note the following:
- 1.All five observed major emission lines show small‐scale peaks over the broad underlying emission profiles, stochastically changing from night to night and in some nights moving toward the blue/red line wings. These subpeaks are assumed to be a manifestation of localized high‐density regions (clumps, blobs) created by radiative instabilities (Owocki 1994), outwardly propagating in the wind (see Lépine 1998). Their presence in lines of different ionization implies that the whole wind is affected by clumping.
- 2.Measurements of the line equivalent widths also show significant stochastic variability in the stronger lines of C iii λ5696, C iv λλ5802, 5812, and He i λ5875.
- 3.The variation profiles across the lines, σ(λ), roughly follow the shape of the emission‐line profiles themselves, with σλ/(Iλ - Ic) ∼ 3%–10%, depending on the line. This indicates that the whole wind is affected by stochastic variations.
- 4.We find no evidence for a coherent periodic component in the line profile variations of γ2 Vel, from ∼6 minutes to 15 days.
- 5.We make an attempt to disentangle the components of the phase‐dependent, variable emission under certain assumptions. This reveals some interesting wind‐wind collision effects, with a hint of crashing of the WR wind onto the O star during periastron passage.
- 6.We report a weak depolarization effect across the strong emission lines of C iii λ5696 and C iv λλ5802, 5812, which could be related to the phase‐dependent asymmetry created by the O‐star light scattered off by free electrons in the WR wind (Moffat & Piirola 1994).
- 7.No definite circular polarization is detected in the emission lines above the instrumental 3 σ threshold of 0.03%, placing an upper limit on the net effective magnetic field in the WR wind: Be≤280 G.
The authors would like to thank Bob Garrison for the generous allotment of observing time at UTSO, Steve Steeles for his continuous support during the observations at UTSO, and Doug Gies for helpful suggestions. T. E. is grateful for full financial aid from the Evangelisches Studienwerk/Germany, which is supported by the German government, as well as an extended bursary from the astronomy group at the Université de Montréal. A. F. J. M. thanks NSERC (Canada), FCAR (Québec), and the Killam program of the Canada Council for the Arts for financial support.
Footnotes
- 3
We define the noise of pixel i as σi/√N, with the σi as defined in eq. (1) and N as the number of rectified polarization spectra. We assume that the v(λ) spectrum is entirely noise dominated. The photon statistics and observation technique are identical in q, u, and v.