
ABSTRACT
The Space Telescope Imaging Spectrograph (STIS) instrument was installed on the Hubble Space Telescope (HST) during the second servicing mission, in 1997 February. Four bands cover the wavelength range of 115–1000 nm, with spectral resolving powers between 26 and 200,000. Camera modes are used for target acquisition and deep imaging. Correction for HST's spherical aberration and astigmatism is included. The 115–170 nm range is covered by a CsI MAMA (Multianode Microchannel Array) detector and the 165–310 nm range by a Cs2Te MAMA, each with a format of 2048 × 2048 pixels, while the 305–555 and 550–1000 nm ranges are covered by a single CCD with a format of 1024 × 1024 pixels. The multiplexing advantage of using these two‐dimensional detectors compared with the 1 × 512 pixel detectors of the first‐generation spectrographs is 1 or 2 orders of magnitude, depending on the mode used. The relationship between the scientific goals and the instrument specifications and design is discussed.
Export citation and abstract BibTeX RIS
1. INTRODUCTION
The Space Telescope Imaging Spectrograph (STIS) is a general‐purpose spectrograph designed to replace the first‐generation Hubble Space Telescope (HST) spectrographs and greatly enhance the HST spectroscopic capability (see Fig. 1).17 STIS capabilities with approximate resolving powers and spectral ranges include
- 1.low‐resolution spectral imaging (spectral resolving power R = λ/Δλ [FWHM] ∼ 500–1000; long slits and wide apertures; 115–1000 nm covered in four bands);
- 2.medium‐resolution spectral imaging (R ∼ 5000–10,000; long slits; 115–1000 nm covered in 5–57 nm wavelength intervals);
- 3.medium‐resolution echelle spectroscopy (R ∼ 23,000–35,000; short slits; only in the ultraviolet);
- 4.high‐resolution echelle spectroscopy (R ∼ 105,000; short slits; only in the ultraviolet);
- 5.objective spectroscopy (R ∼ 50; wide field; one ultraviolet band, 115–310 nm); and
- 6.broadband imaging (ultraviolet or visible; a few filters available for identification and acquisition of line or continuum sources or for extending the dynamic range of acquisition capability).
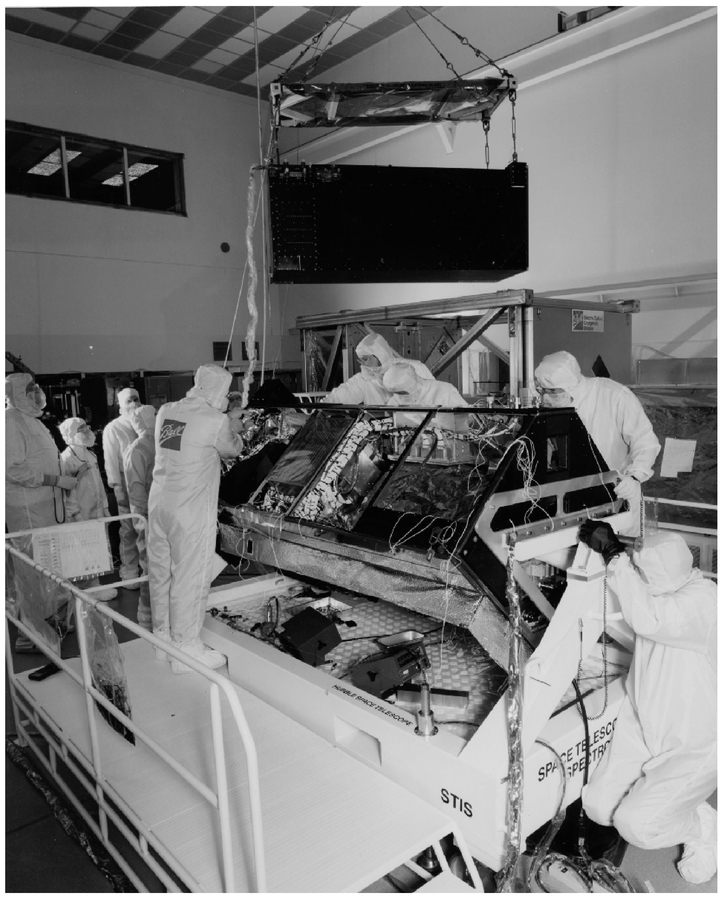
Fig. 1.— The STIS instrument during assembly at Ball Aerospace
The purpose of this paper is to present a thorough description of STIS, so that potential astronomical users can become aware of its capabilities, whether implemented in the suite of modes supported by the STScI initially or later.
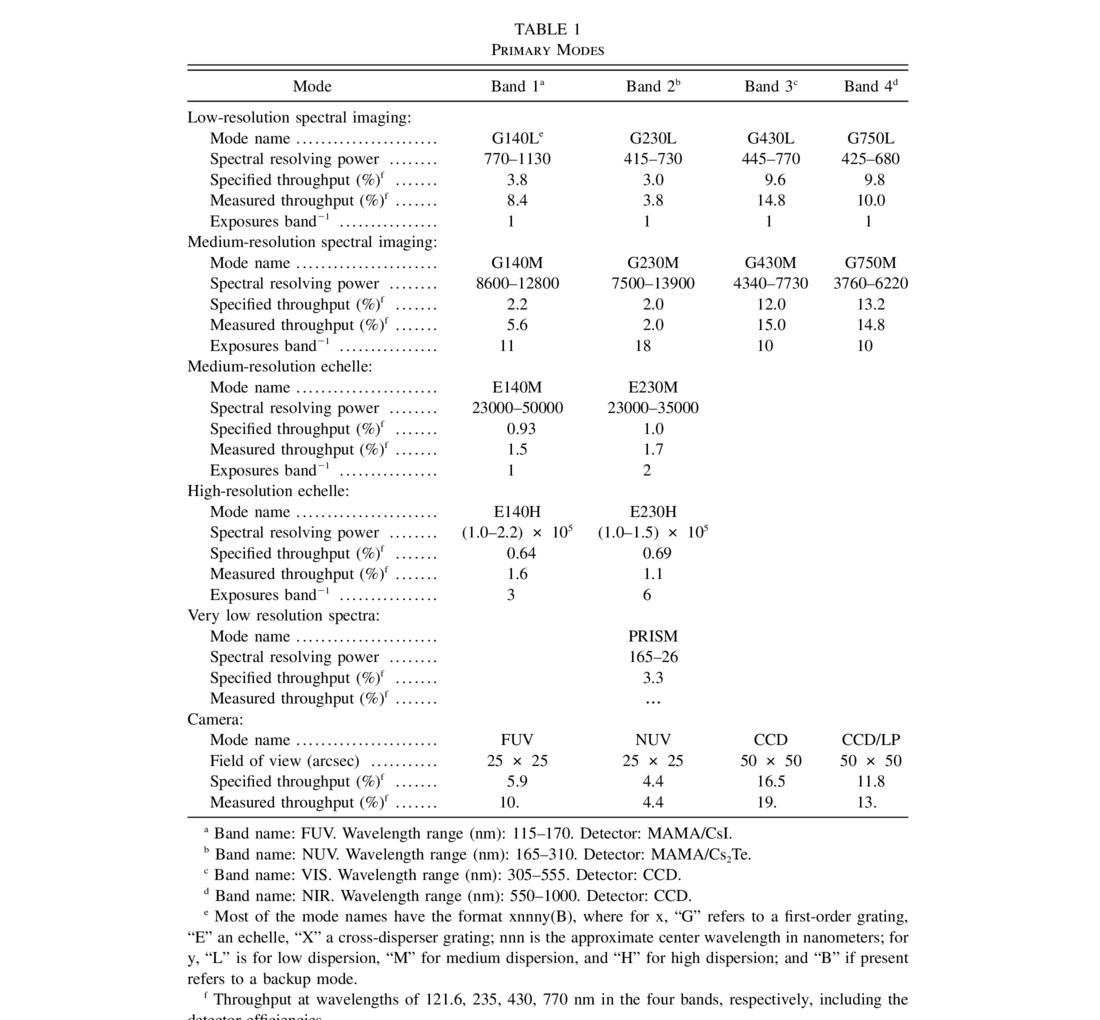
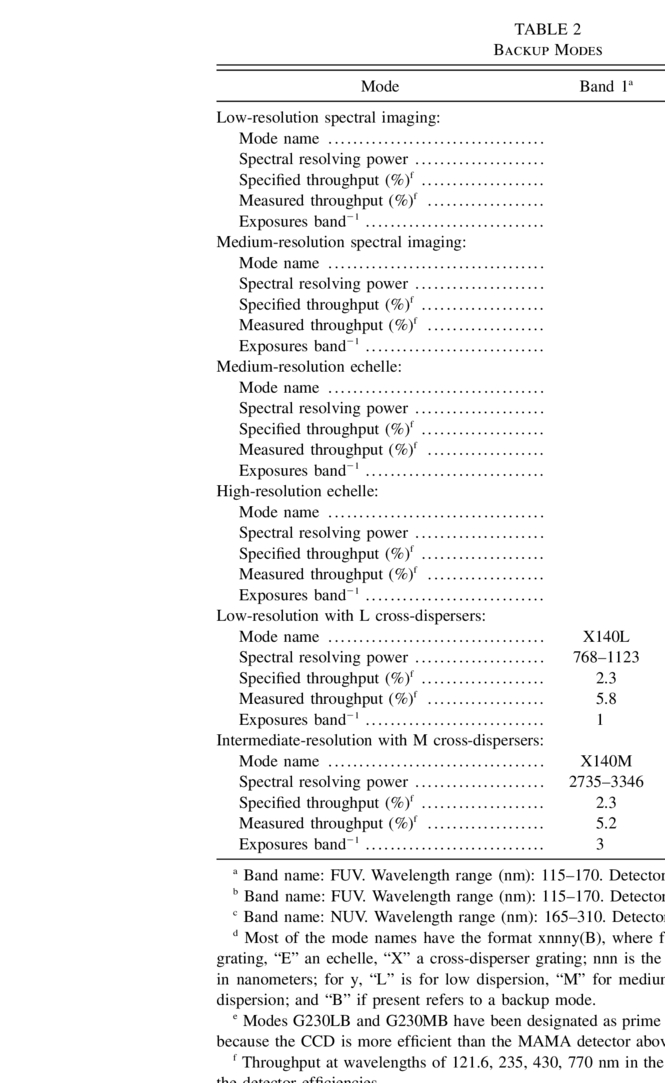
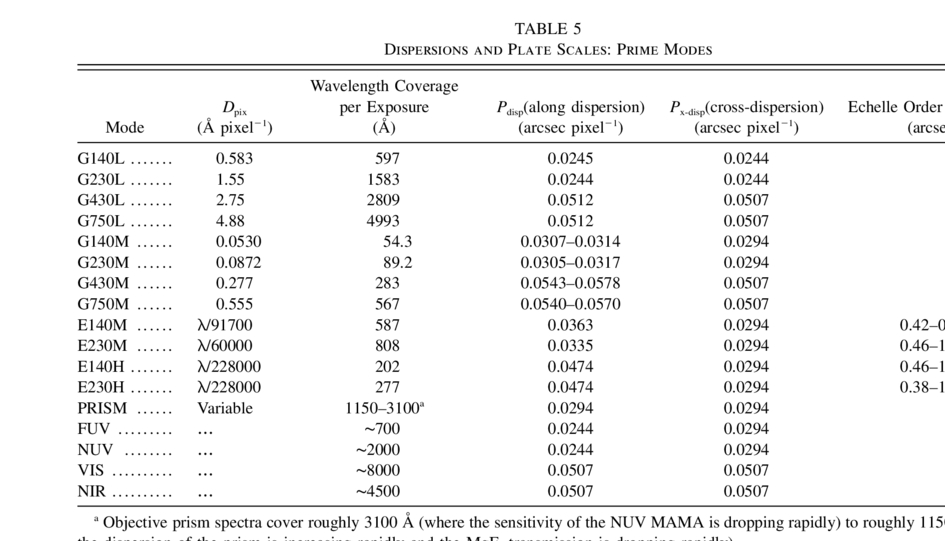
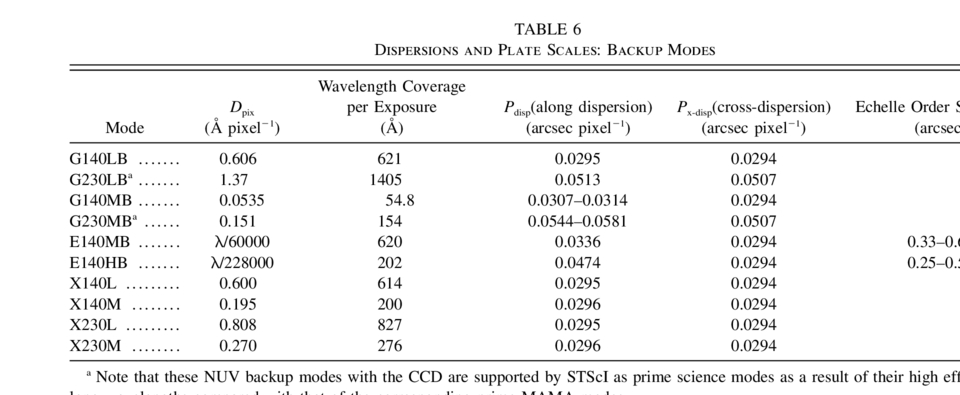
In the imaging spectroscopy and camera modes, the spatial resolution achieved by STIS is 0  06 FWHM in the ultraviolet and 0 12 FWHM in the visible. In the UV, the spatial resolution is limited by the telescope point‐spread function and its focus changes, referred to as breathing, while in the visible, it is limited by the STIS CCD pixel sampling. The available operating modes are shown in Tables 1 and 2, with the resolving powers achieved in ground testing. Table 1 shows the primary modes. Table 2 shows the backup modes, to be used in case of a detector failure or for intermediate resolution.
 |
 |
In § 2 we discuss briefly the scientific program that STIS will address and the relationship of the design specifications to them. The optical design, including spectroscopic and camera modes, and aberration correction are discussed in § 3. The detectors, two Multianode Microchannel Array (MAMA) detectors for the UV and a CCD for the visible, and backup overlap between them, are discussed in § 4. The arrangement of in‐flight wavelength and flat‐field calibration lamps is described in § 5. The functions of each mechanism are described in § 6. The control and data handling electronics and software, including target acquisition, are in discussed § 7. Section 8 contains the structural and thermal design.
A description of observing with the supported modes of STIS, for which the STScI provides calibration, is found in the main section of the STScI STIS Handbook (Baum et al. 1996).18 Also, the available but currently unsupported modes are described as Appendix A of the Handbook, and earlier general descriptions are in Woodgate et al. (1986, 1992). A description of the in‐flight performance as of 1997 July is found in Kimble et al. (1998).
2. SCIENTIFIC PROGRAM
While the detailed scientific rationale is outside the scope of this instrumental paper, it is useful to keep in mind the relationship between the science goals and the instrument design.
The scientific program of the STIS Investigation Definition Team is representative of the many important problems that can be investigated with STIS by the larger HST user community. It includes studies of the dynamics and mass distributions of normal and active galactic nuclei; the evolution of galactic halos, protogalaxies, and the intergalactic medium; the composition, kinematics, and physical processes in various phases of the interstellar medium; the abundances and structure of stellar photospheres and mass‐loss phenomena; the magnetospheres, aeronomy, and stratospheric chemistry of the outer planets; bow shocks and other dynamic phenomena in protostars; the temperature structure within magnetic flux tubes in the outer atmospheres of late‐type stars; and a deeper search for planetary systems forming around nearby stars.
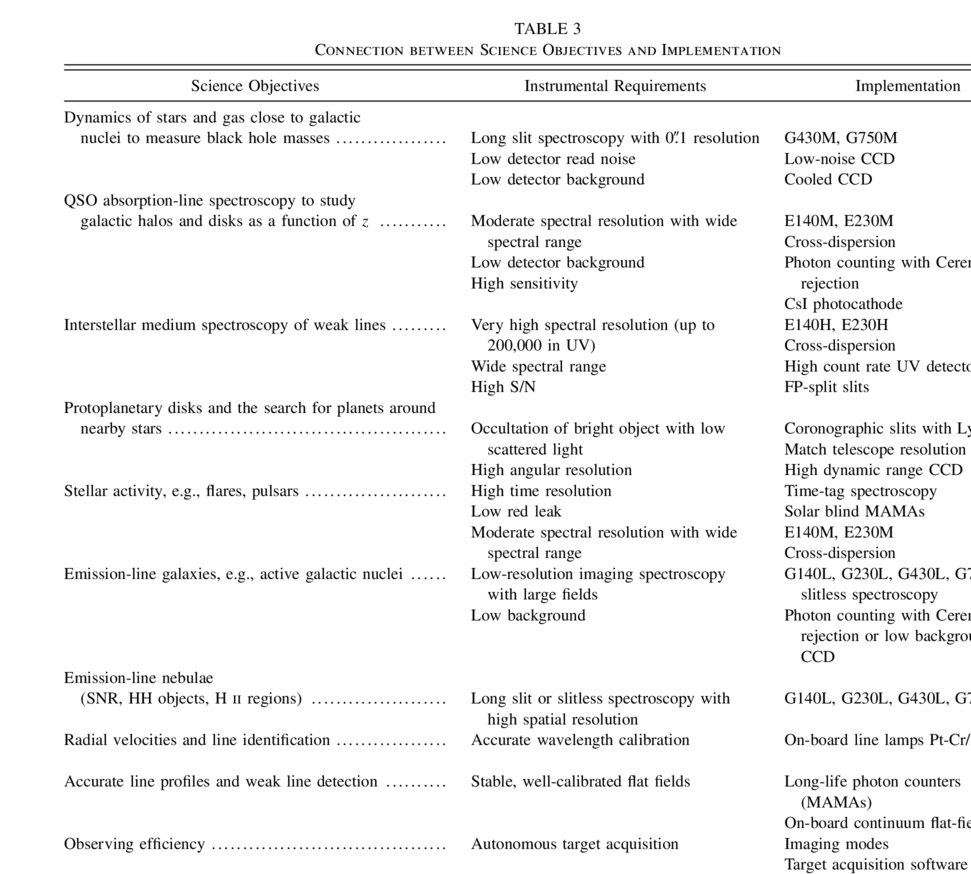
Specific science programs are particularly able to take advantage of the technical advance made possible in the spectrograph by providing spectroscopic grade (high quantum efficiency and low noise) two‐dimensional detectors. They then stand as examples of the scientific rationale for the instrument and therefore as design drivers around which the capabilities are defined and development trades are made. In addition to these, because STIS replaces the two HST one‐dimensional detector spectrographs, it is also highly desirable not to lose or diminish the main capabilities supporting their scientific programs. This relationship is summarized in Table 3, which outlines the relationships between specific scientific objectives, instrument requirements, and their implementation in the design.
 |
In the subsections that follow we summarize the primary science drivers.
2.1. Galaxy Nuclear Dynamics
The measurement of the dynamics of the stars and gas close to the nuclei of nearby galaxies enables the determination of the mass of the central regions, for example, determining the existence and mass of black holes for specific targets. Such measurements can be done efficiently by placing a long slit across the nucleus and taking many spatially distinct spectra in a single observation, to measure the Doppler shift, velocity dispersion, and higher moments of the profile as a function of distance from the nucleus. The HST angular resolution is critical in order to obtain spectra close to the nucleus. A spectral resolving power of at least 5000 is required to measure the velocity dispersions in cold systems. This resolution is available in mode G750M or G430M (Table 1). Because of the low surface brightness at the HST angular resolution, it is necessary that the CCD detector has low read noise and dark noise.
2.2. QSO Absorption‐Line Spectroscopy
The intergalactic medium, intergalactic clouds, halos of galaxies, and galactic disks may be studied as a function of cosmic time using absorption spectra of background QSOs. The last 5–8 Gyr are best studied in the UV where the rich UV spectrum is not redshifted into the visible. Also, relatively nearby absorption features are more easily correlated with detectable objects seen in spatially resolved images. A large wavelength range at medium spectral resolution in one or a few observations is needed to observe a large span of cosmic time and to obtain many spectral diagnostics with sufficient resolution to separate velocity components and to measure accurate line depths for accurate abundance determination. These requirements are met with modes E140M and E230M, by packing many spectral orders onto the two‐dimensional UV detectors. To remain signal limited over the many orbits of exposure time required, the detector background must be very low. This is obtained by reducing the Cerenkov background compared with the first‐generation spectrographs using the natural spatial anticoincidence of the MAMA detectors. The sensitivity in the far‐UV is also enhanced by using an opaque CsI cathode deposited on the microchannel plate of the Band 1 FUV MAMA detector.
The very low MAMA detector background also enables more effective studies of the helium Gunn‐Peterson effect, where the low‐resolution spectra (in mode G140L) remain signal limited over the many orbits required.
2.3. Interstellar Medium
Investigation of the interstellar medium by UV absorption lines in the spectra of distant hot stars requires as high a spectral resolution as possible to separate many clouds closely spaced in velocity and a wide wavelength range to study many atomic and molecular species formed over a wide ionization range. In the high‐resolution echelle modes (E140H and E230H), resolving powers of 140,000–200,000 have been obtained, with 20–30 spectral orders on the detector covering a wide wavelength range at one time.
A high signal‐to‐noise ratio (S/N) is required to detect weak absorption lines from low‐density clouds or rare elements and ions. This requires a large number of continuum counts per resolution element. To obtain many counts in a reasonable observing time requires that the detectors have a high dynamic range. The MAMA detectors use high‐conductance single, curved microchannel plate intensifiers, capable of 200 counts s−1 pixel−1, with electronics that run at 300,000 counts s−1, making these systems the highest dynamic range two‐dimensional photon counting detectors presently available.
Emission‐line nebulae may be observed using up to 500 spatial elements in long‐slit spectra, with 0 05 angular resolution in the UV and 0 1 in the visible.
2.4. Protoplanetary Disks
The sharp image quality of HST when corrected for spherical aberration, and its relatively low scatter compared with ground‐based imaging, enables the observation of faint objects very near to bright ones, particularly when a coronagraph is used. The study of protoplanetary disks around nearby bright stars, including the search for inner boundaries and cleared rings due to planets, will provide examples of the formation of planetary systems other than our own.
STIS provides occulting stops in the focal plane in both imaging and spectroscopic modes. The long slits have bars across them with different widths for occulted spectroscopy. An occulted aperture for imaging is provided with fingers and wedged bars to allow selection of the width. In addition, for the imaging and low‐resolution spectroscopy modes in the visible/near‐IR, partial Lyot stops block the outer edge of the pupil to remove diffracted light and scatter from the outer edge roll‐off phase error of the telescope primary mirror.
2.5. Stellar Activity
The study of stellar activity, particularly stellar flares and pulsars, requires high time resolution. This is accomplished in the UV by tagging each recorded photon from the MAMA detectors with time and position (wavelength). The time resolution retained is 125 ms. The lower background of the MAMAs as described above is also critical to separate stellar flares from Cerenkov events in the detector.
2.6. Emission‐Line Galaxies
In the last few years it has become possible, particularly with the HST image quality, to complement the study of high‐redshift QSO absorption systems with the study of high‐redshift galaxies in emission. With multiband imaging, candidate objects in particular redshift ranges may be selected and their redshifts then measured by spectroscopy. A fairly high fraction of these objects are compact emission‐line galaxies. Such galaxies may be observed directly with STIS using slitless spectroscopy, to determine their redshifts, velocity distributions, line strengths, and line ratios.
The low sky background from space, particularly with HST angular resolution, makes the detection of faint compact (≪1'') emission‐line galaxies much easier than from the ground. STIS slitless spectroscopy in its low spectral resolution modes (R ∼ 500) with its 50'' and 25'' square apertures in the visible and UV, respectively, can be used to search for these galaxies at all redshifts from 0 to 7 (Lyα at 1000 nm). Although the sensitivity of these measurements in the visible will be limited by the zodiacal light, the UV sky background is particularly low because the Sun is much fainter, and the UV measurements will be signal limited for many orbits.
Specific galaxies and clusters will be targeted when STIS is the prime instrument, and this technique will be used as the predominant method for parallel observing for statistical studies. This objective was not used as a design driver but became possible with instrumentation provided for other purposes.
3. OPTICS
The STIS optical design as illustrated in Figure 2 provides for the spectral and imaging modes of operation and compensates for the aberrations present in the HST. To meet the science objectives, the STIS optical design includes the following properties:
- 1.The throughput of the all‐reflective optical system is maximized by eliminating unnecessary reflections, particularly in the UV, where low surface losses are difficult to achieve.
- 2.HST aberrations are corrected forward of the spectrometer entrance, providing sharp imagery at the field‐limiting slits, with in‐flight adjustment capability to accommodate uncertainties in the optical and mechanical interface between STIS and HST.
- 3.Redundant modes of operation are provided to minimize the loss of science in the event of the loss of one or more of the detectors.
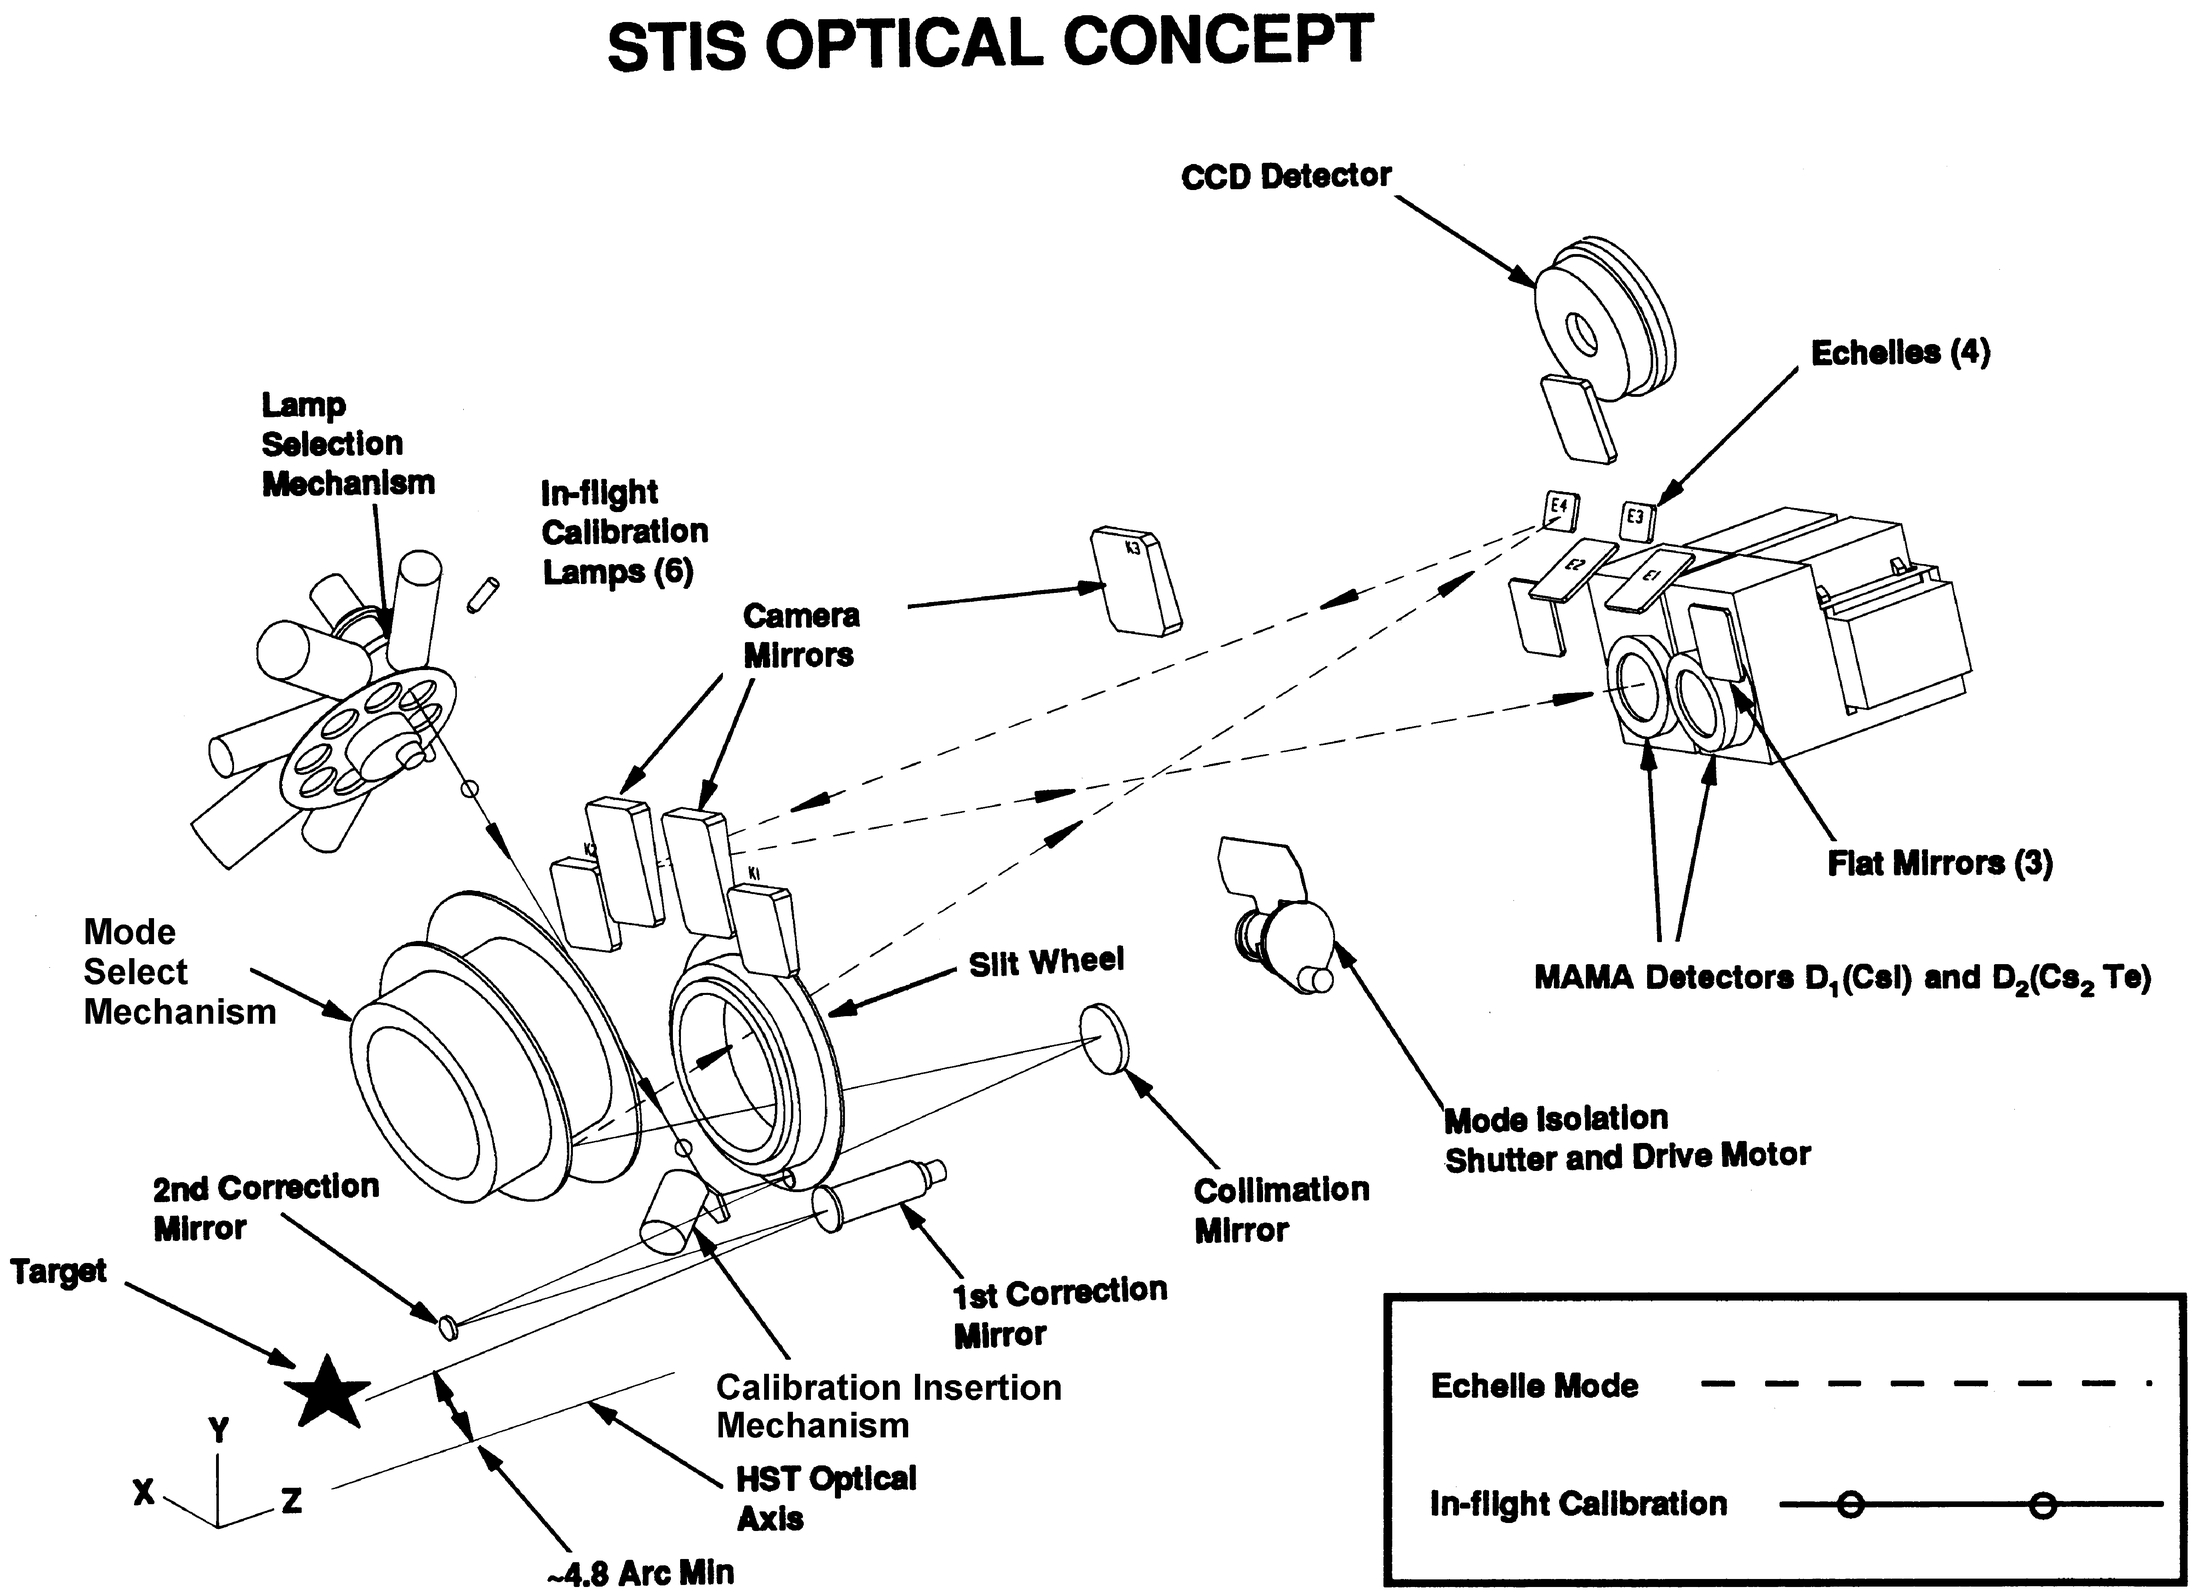
Fig. 2.— Optical layout of STIS. The beam path is common up to the mode select mechanism, the position of which selects the remaining beam path, determining the spectral or imaging mode being used. (Note that the filter wheel shown near the lamps was descoped and not built. Some filters were moved to the slit wheel.)
The STIS optics have been configured into two basic subassemblies. The first is a two‐element reflecting corrector, which eliminates the spherical aberration created by the primary mirror manufacturing error and the off‐axis aberrations present in all Ritchey‐Chrétien telescopes. The corrector is followed by the imaging spectrograph: collimator, grating, and camera elements to provide high‐resolution and high‐efficiency spectroscopy and imaging capability in order to satisfy the science requirements.
3.1. Corrector
The correction of the telescope's spherical aberration and off‐axis astigmatism is performed with a two‐mirror system. The first mirror is a sphere that images the HST pupil onto the second corrector mirror, which is an anamorphic asphere that is slightly toroidal in shape. The anamorphic mirror corrects the spherical aberration and astigmatism and reimages the corrected HST image onto the spectrometer slit wheel, where the selected slit will be positioned. The first mirror is supported on a mechanism providing focus and two‐axis tilt, as described in § 6.3.
3.2. Imaging Spectrograph
Light from the corrected HST image enters the spectrometer through one of the slits on the slit wheel. The slits, which are used to set the required field of view for the various modes of operation, range in size from 50'' × 50'' to 0 1 × 0 025. After passing through the slit wheel, the light is collimated by an off‐axis elliptical mirror. The parallel beam is directed to the grating wheel, which directs the light toward one of the three detectors of interest.
Except for the echelles, gratings are mounted on the grating wheel, which provides mode selection and scan capability and is near an image of the system pupil. By virtue of their location near a pupil, the gratings can be small (25 mm in diameter). This simplifies grating fabrication and supports broad science capabilities by providing for several modes of operation by the interchange of gratings and mirrors.
The spectral modes are configured as either Wadsworth spectrometers (four reflective surfaces including the corrector) or Czerny‐Turner spectrometers (six reflective surfaces including the corrector). Modes G140L and G230L (see Table 1), which are the highest efficiency spectral imagery modes, require Wadsworth configurations in order to provide the highest throughput. In the Wadsworth configuration, light from the collimation mirror is intercepted by an off‐axis parabolic grating located on the grating wheel. From there, the light is dispersed and focused directly onto the detector assemblies. In the Czerny‐Turner configuration, light from the collimation mirror is intercepted by either a plane grating or a prism on the grating wheel. From there, the light is dispersed and directed toward either a fold mirror or an echelle grating near the detector assemblies. The fold mirror/echelle grating directs the light toward the respective camera mirror, which focuses the dispersed energy onto the appropriate detector, as illustrated in Figure 2. Order sorter filters, where needed, are carried with the gratings on the grating wheel and fixed in relative position in front of the relevant gratings. The grating wheel provides for the selection and spectral scanning of the grating, as described in § 6.1.
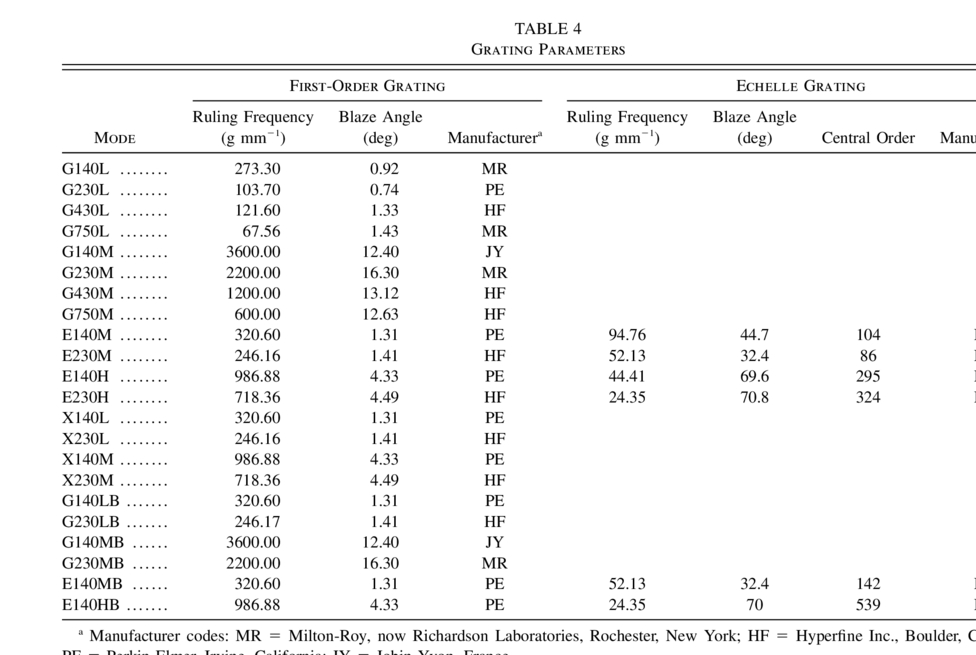
3.3. Diffraction Gratings
The STIS spectrographs use 16 diffraction gratings, 12 of which are used in first order and four of which are echelle gratings used in higher diffraction orders. The first‐order gratings, located on the grating wheel, have grating constants ranging from 67 to 3600 grooves mm−1 and blaze angles ranging from 0  67 to 14 7 (see Tables 4–pasp_110_752_1183tb56). These gratings support 12 of the 13 spectral modes, serving as the dispersing elements in the first‐order spectral imaging modes and as the cross‐dispersers in the four echelle spectroscopy modes. The remaining spectral mode, the objective spectroscopy mode of the near‐UV (NUV), is dispersed by a prism located on the grating wheel. Two of these gratings are replicated on slow off‐axis segments of parabolas using manufacturing techniques developed for the Goddard High‐Resolution Spectrograph (GHRS) cross‐dispersers. The other 10 first‐order gratings are replicated on plane grating blanks. All elements on the grating wheel (gratings, prisms, and mirrors) are about 25 mm in diameter, to cover the 19 mm pupil diameter.
 |
 |
 |
Each of the four echelle spectroscopy modes has a dedicated echelle grating mounted on the optical bench bulkhead supporting the STIS detectors. These plane echelle gratings are the primary dispersing element for their modes and are used in conjunction with the appropriate cross‐disperser grating mounted on the grating wheel. The echelles range in grating constant from 26 to 99 grooves mm−1, in blaze angle from 32° to 70°, and are used in orders ranging from 51 to 432 among the four modes. Two of the echelles are 56 × 30 mm, and two are 56 × 76 mm in size. Each of the 16 gratings was optically coated to optimize its performance over its intended spectral region. Details of the gratings and their testing are provided in Content et al. (1996).
3.4. Selectable Slits
The slit wheel allows the selection of the appropriate slit for the desired science observation (Table 7). The first‐order spectral imaging modes can select from 50'' long slits ranging in width from 0 05 to 2'', which have internal occulting bars for bright object exclusion. Four of these slits are rolled at 45° to provide greater position angle flexibility. Use of these slits doubles the number of roll angles, and therefore the number of scheduling opportunities for obtaining spectra of extended objects along specific axes. For planets, this added flexibility is important, because there are often specific time constraints that must be satisfied for reasons other than those coupled to the permissible roll angle of the telescope and to provide access to polar or equatorial directions. Sixteen slits are available for the six echelle spectroscopy modes. They range in length from 0 10 to 6'' with widths of 0 025, 0 05, 0 10, 0 20, and 0 5. Short slits must be used to separate echelle orders. However, for extended objects that have only emission lines, a much taller slit may be chosen to image the source in one direction and obtain more counts, but with possible overlap in some lines. Camera mode apertures of 50'' × 50'', 25'' × 25'', 6'' × 6'', and 2'' × 2'' are provided. A coronagraphic camera aperture of 50'' × 50'' with internal occulting wedges and fingers is also provided. In UV spectral modes the full STIS spectral resolving power is matched to 0 05–0 09, and in visible/IR modes it is matched to 0 1.
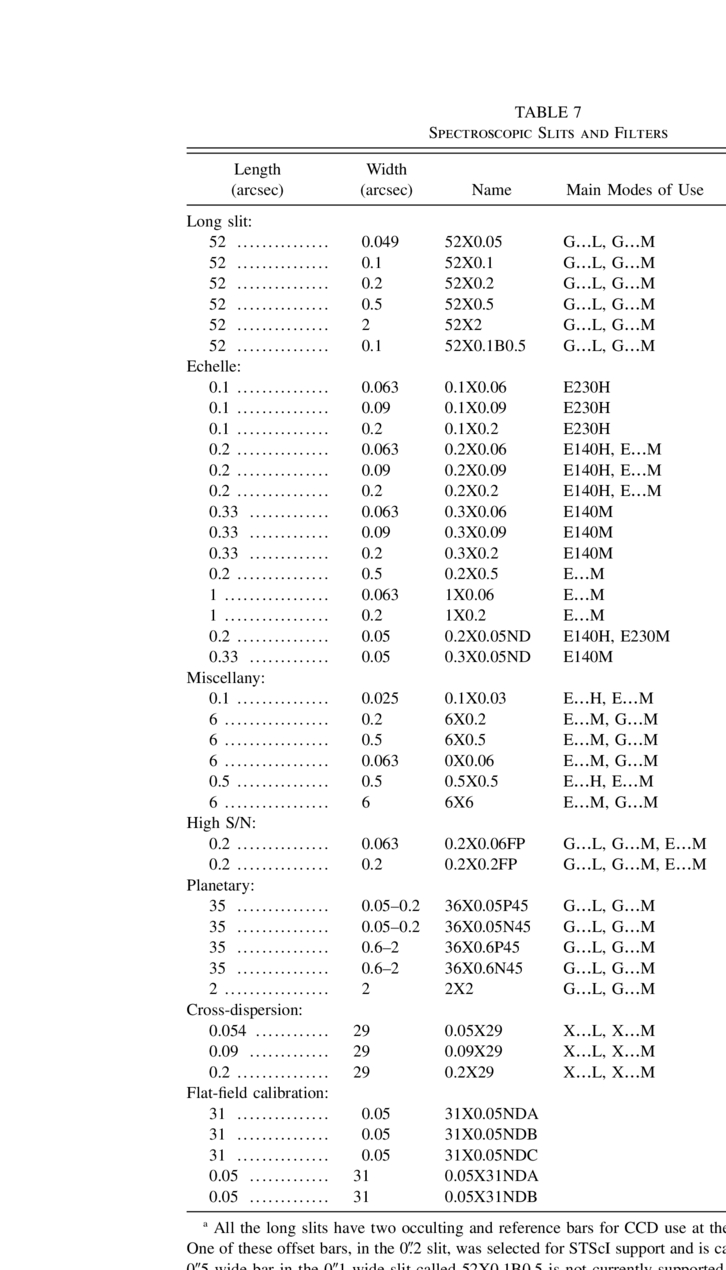 |
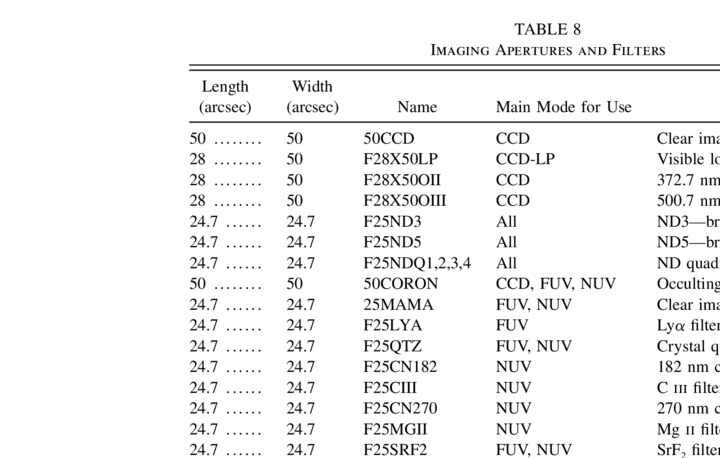
Also attached to the slit wheel are a limited set of filters, primarily in the UV, as shown in Table 8. In addition, neutral density filters are provided for target acquisition, calibration, and spectra and images of very bright targets. The complement of slits, apertures, and filters are shown in Tables 7 and 8. A quadrant sector of the slit wheel, made by Max Levy Autograph, New Jersey, is shown as Figure 4.
 |
4. DETECTORS
STIS uses two detector technologies, MAMAs and CCDs, in order to optimize performance over the instrument wavelength range.
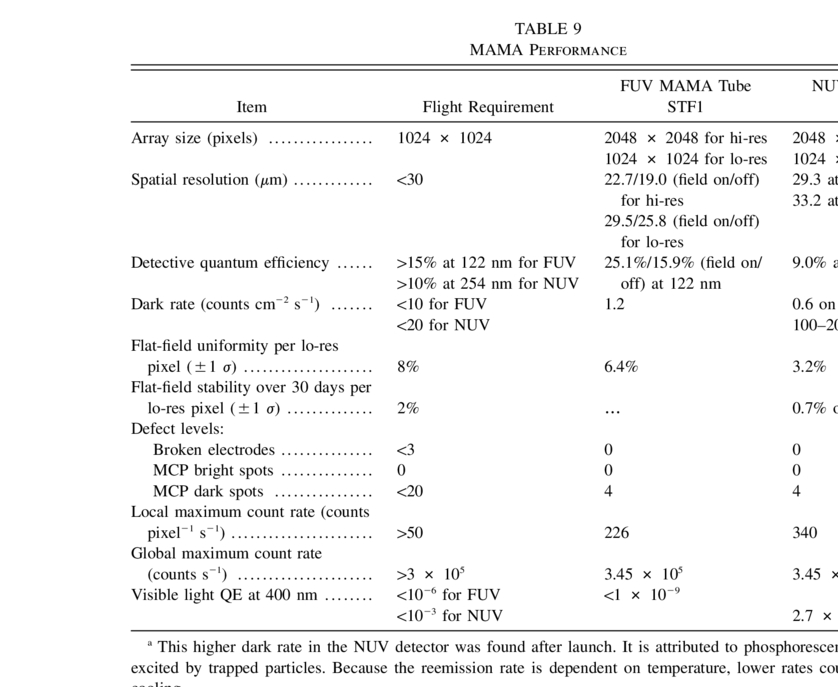
CCDs are well proved to have high performance in the visible and near IR, with quantum efficiencies (QEs) much higher than photocathodes, and with low noise. However, the use of CCDs in the UV, at wavelengths down to 115 nm, would face unsolved difficulties. A detector needing cold operation, such as an astronomical CCD, collects UV‐absorbing contaminants, leading to rapid efficiency degradation. No UV‐stable cold detector has yet been demonstrated down to 115 nm. Initial UV sensitivity could be provided by overcoating a CCD with a fluorescer such as liumogen, with a moderate QE of 20%–30%, similar to a photocathode. However, to observe any objects in the UV other than hot stars, such as cool stars, planets, or galaxies, it is essential to block out the visible flux, which may be up to 109 times higher. Recently developed Woods filters have a peak transmission of only 15%–18%; they provide a relatively narrow wavelength range, and their stability over the expected lifetime of STIS is questionable. Even if stability could eventually be proved, the combined efficiency of CCDs and filters in the UV would be much lower than that of photocathodes. For the ultraviolet, we have therefore selected detectors that use CsI and Cs2Te UV photocathodes, which reject visible photons (see Table 9) and which operate uncooled. For similar QEs, the absence of read noise in photon‐counting detectors makes them more sensitive than CCDs for detecting faint sources. Further comparative discussion of detector types can be found in Joseph (1995).
 |
4.1. MAMA Detectors
The microchannel‐plate–based MAMA detectors combine solar blind, low‐background, photon‐counting capability with large‐format, high spatial resolution imaging. The digital nature of the MAMA readout system, which incorporates physically distinct anode elements for the individual pixels of the array, provides geometrically stable imaging and a high global dynamic range. By operating with microchannel plate (MCP) gains much lower than those required for analog position readout systems, the MAMA offers two additional advantages. First, the low‐charge gain demanded of the single, curved MCP permits a much higher instantaneous local count rate without gain sag (and resulting loss of QE) than do the multiplate configurations that are needed in analog position‐determining applications. Second, the lower charge extracted in each pulse increases the total number of counts that may be accommodated in the detector's lifetime. More detailed descriptions of MAMA concepts and technology are provided in Timothy (1983), Timothy & Bybee (1986), Timothy et al. (1989), Danks et al. (1992), Joseph et al. (1994, 1995) and Joseph (1997).
Each detector consists of an entrance window (MgF2), a photocathode (CsI or Cs2Te), a curved microchannel plate (C‐plate), and an anode array. The components are held in a hermetic stacked Kovar and ceramic body that is indium sealed to a MgF2 window at the front and welded to a Kovar flange on a multilayer ceramic header at the back. The multilayer ceramic header provides support and electrical connections for the "fine‐fine" (see below) coded anode array outputs. High‐voltage connections are made at the annular Kovar rings.
Photons entering a detector are converted to electrons at the photocathode and accelerated into the 12 μm pores of the C‐plate. The C‐plate has an applied voltage across its faces of 2050–2250 V to drive the electrons through the plate, and the secondary emitting properties of the pore surfaces produce a charge cloud of 7 × 10⁵ electrons at the plate exit. The anode array is placed in proximity focus to minimize the dispersion of the charge cloud. The charge is read out of the array through 132 charge amplifiers to a decoder to give the two‐dimensional position and time of arrival of the pulse.
The fine‐fine anode array (Timothy et al. 1989) is a more balanced encoding scheme than the earlier coarse‐fine array and allows a more uniform flat‐field distribution. It also allows encoding of a broad charge cloud distribution (covering up to six anodes in each axis instead of four) to improve charge collection efficiency. This would also allow using a chevron MCP as a backup (but see below).
The C‐plate consists of a thin Pb‐based glass plate honeycombed with small 12 μm pores on 15 μm centers. The plates are hydrogen reduced in a furnace to create a secondary emitting surface in the pores. The pores themselves are curved along their length in the shape of a C, hence the name; the C shape inhibits the migration of ions back through the plate to the photocathode. The single C‐plate is preferred over the backup 2‐plate (chevron) stack, which suffers a much larger gain change as a function of extracted charge compared with a C‐plate. This requires that the fully scrubbed chevron MCP operate at greater than 40% higher voltage than a C‐plate. The use of a C‐plate results in a more rugged tube against gain changes from overexposure and a lower risk because of reduced high voltage. A reason to avoid chevron MCPs is their image structure–dependent maximum local count rates, which are inherent in multiple MCP configurations over a range of image sizes from 25 to 1000 μm. Ion feedback from a chevron MCP would have a significant performance effect on the proximity‐focused MAMA detector, because the ion‐induced event causes the decode logic to reject the primary and feedback events, resulting in reduced detective quantum efficiency (DQE) (Danks et al. 1992; Joseph et al. 1994).
The two MAMA detectors differ slightly in design. The far‐UV Band 1 detector is designed for 115–170 nm and uses a CsI photocathode deposited directly onto the MCP; a field electrode is provided to push any photoelectrons produced by the MCP web into the pores. This detector has a tilted (8 5) entrance window to prevent chromatic aberration in the far‐UV imaging mode. A 90% transmissive chrome layer is evaporated on the inside of the MgF2 window to mitigate any dielectric charging that would cause nonuniformity in the repeller electric field. The field electrode may be turned off to improve resolution, although at the expense of DQE (see Table 9).
The near‐UV Band 2 detector employs a semitransparent Cs2Te photocathode, which provides the long‐wavelength sensitivity (165–310 nm). This cathode is deposited on the inside surface of the reentrant window, because Cs2Te has not yet been demonstrated to be compatible with the surface of an MCP. The cathode is close to the MCP so that electrons emitted from the cathode do not travel sideways far before reaching the MCP. This is referred to as a proximity focus. In all other respects the detectors are identical.
A flight MCP is selected after rigorous testing in a demountable tube assembly where the MCP gain, dark rate, spatial distribution of dark emission, and efficiency are measured. The tube assembly is loaded into a dedicated ion pumped vacuum processing station and is baked at 300°C to create pressures of less than 10−9 torr throughout the remainder of tube processing. The MCP is UV scrubbed for 25 days until the gain change per coulomb of extracted charge is less than 10%. In the FUV tube, 800 nm of CsI is evaporated onto the MCP at normal incidence, while in the NUV tube the semitransparent Cs2Te photocathode is remotely deposited on the reentrant MgF2 window. The MgF2 window is sealed to the tube body using a hot indium seal.
The anode array is produced by Ball Aerospace Corporation, with the fine‐fine array design deposited in tungsten/gold/titanium to prevent processing defects introduced in previous fabrication methods. The array detects incoming charge clouds by triggering between two and six charge amplifiers connected to these anodes, and these signals are decoded to provide positional addresses in x and y.
The imaging electronics include application‐specific integrated circuitry (ASIC) for the amplifier/discriminators and for the decoders to minimize the weight and volume requirements of the detector package. These designs successfully meet the 3 × 10⁵ events s−1 global count rate requirement while requiring low input power. The charge amplifier design also includes suppression circuitry for preventing damage due to extraneous high‐voltage surges at the input.
MAMA events can be stored in memory as an accumulating image in the standard integration mode. Alternatively, in time‐tag mode, the time and location of each photon event can be recorded explicitly. The logic can also be programmed to select a subarray in either integration or time‐tagging mode for better utilization of the on‐board memory and telemetry. A modified form of the accumulation mode is one where changing Doppler shifts due to the observatory's orbital motion can be added as an address shift before storing in memory.
The MAMA format is normally read out to the ground as 2048 × 2048 samples. For highest resolution, the full format should be retained. For highest S/N, particularly without flat‐fielding, the data can be binned in orbit or on the ground to 1024 × 1024. Each axis can be binned separately, for example, in a spectral mode for maintaining spectral resolution while improving S/N. The 2048 × 2048 format is achieved by coding the least significant bit to indicate whether an odd or even number of anodes were triggered, thereby interpolating between the 25 μm pixels (Kasle 1988; Joseph et al. 1995).
The MAMA detectors are fabricated in‐house by Ball Aerospace, the STIS Prime Contractor. Table 9 shows the measured performance of the flight detectors compared with their specifications.
4.2. CCD Detector
The CCD detector, a 1024 × 1024 pixel device from Scientific Instrument Technologies (SITe), extends the STIS wavelength range through the visible portion of the spectrum, covering 305–1000 nm. It is a backside‐illuminated, buried‐channel device operating in the inverted mode, with an overscan region included for bias removal (Orbock, Delamere, & Blouke 1989). The dark current is reduced by 1–2 orders of magnitude using dopants called multiphase pinned (MPP) implants that allow the substrate voltage to be inverted, which prevents surface states from leaking charge into the depletion region. Amplifier noise improvements are achieved by applying the lightly‐doped drain (LDD) technology, which reduces the parasitic capacitance associated with the output transistor. A narrow channel implant called a minichannel improves the charge transfer efficiency for low‐level charges by reducing the exposure of carriers to traps in the lattice structure. SITe proprietary backside processing and silicon nitride antireflection coatings are used to maintain the quantum efficiency at wavelengths shorter than 400 nm (Kimble et al. 1994).
The CCD is cooled to −83°C by a thermoelectric cooler (TEC) in order to achieve low dark current with the MPP design and inverted operation. The cooler and CCD are enclosed in a sealed housing, constructed of molybdenum to serve as a radiation shield against protons in the South Atlantic Anomaly (SAA). The external housing includes an SiO2 window that will operate near the instrument temperature of +12 to +25°C. The housing is evacuated and sealed so that all cold components prone to the condensation of optical contaminants can be protected from the external environment. The heat pumped away from the CCD is dumped via conductive straps to a radiator mounted on the STIS enclosure.
During nonintegration periods, basic "flush" operations will be used to condition the CCD, with continual readout or flushing the normal mode, in order to prevent the buildup of unwanted charge. Nineteen pixels of leading and trailing overscan data per row and 20 rows of parallel overscan also may be used for background removal.
Integration periods are selectable in increments of 0.1 s up to 60 minutes. For long total integration times, several shorter exposures should generally be taken to permit the removal (through vetoing) of cosmic‐ray hits.
The design of the CCD and associated electronics provides both operational flexibility and redundancy. There are four readout amplifiers, one in each corner of the detector. Each amplifier is read out through an independent analog signal processing chain, and the STIS flight software supports full‐frame or rectangular‐subarray readout with any of the four amplifiers, as well as two‐ and four‐amplifier readout modes. The device architecture and clock driver design ensure that no single electronics failure can cause the loss of the full array. The full array can be read out despite the loss of any single wire connection to the CCD or the loss of any serial clock driver. If a parallel clock driver fails, half of the spatial field would be lost, but the spectroscopic modes are oriented so that full‐wavelength coverage would be retained.
The readout electronics have selectable gain to provide for differences in image intensity beyond a dynamic range of 65,000 (16 bits). The gain is selectable from 1 electron bit−1 to 8 electrons bit−1. In addition, by combining or "binning" pixels on‐chip before readout, extremely low surface brightness image data can be accommodated. This will be used, for example, in spectroscopy of faint galaxies. Data from selectable rectangular portions of the image, or subarrays, may be read out, to reduce the readout time. This is used for example in target acquisition.
Doppler correction for spacecraft motion is provided primarily by timely dumps of image or subarray data to memory or to the spacecraft. Because the highest spectral resolution offered by STIS in the visible is only 10,000, Doppler correction is less critical than for the high‐resolution MAMA modes.
Several methods are planned to deal with radiation damage effects. Minichannel implants in the parallel channels, and inverted MPP operation, minimize the effects of both lattice dislocations and ionization damage. To offset residual effects of long‐term degradation, the design provides the capability to vary clock timing and phasing, to operate at lower temperatures, and to change critical voltage levels. Approximately once each month, the TEC is turned off for 12 hr to anneal the lowest energy traps accumulated. This was successful in removing approximately 80% of the hot pixels for Wide Field and Planetary Camera 2 (WFPC2). For STIS, the CCD temperature during annealing is approximately −5°C.
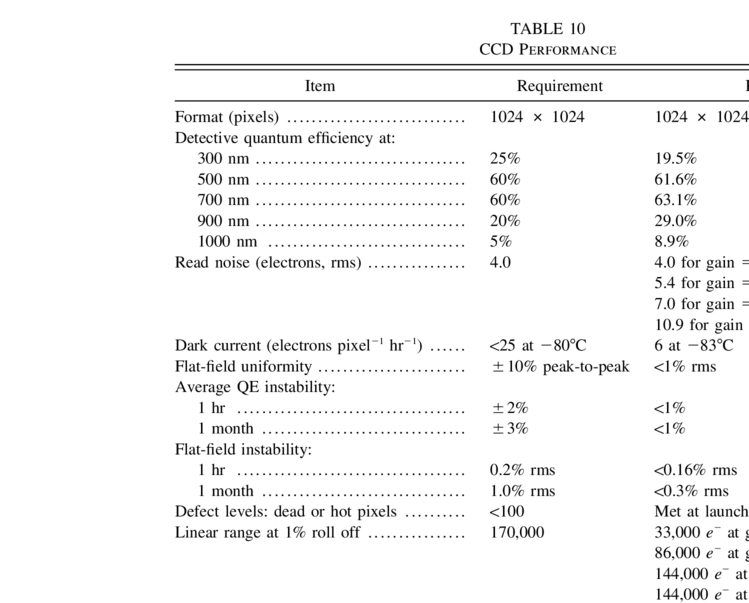
CCD performance characteristics are shown in Table 10.
 |
4.3. Detector Backup Arrangement
If either MAMA detector were to fail, then another detector can provide partial backup. If the FUV MAMA failed completely, then the NUV MAMA can provide similar spectral resolving powers using the modes shown in Table 2 as G140LB, G140MB, E140MB, and E140HB. The latter two modes use the primary NUV echelles, but illuminate them with FUV cross‐dispersers. These modes would have about half the efficiency of the normal FUV modes, because the Cs2Te MAMA has about half the efficiency of the CsI MAMA in the FUV, and there would be less long‐wavelength scatter protection for cool sources. If the NUV MAMA were to fail completely, then the CCD can provide partial redundancy through the G230LB and G230MB modes, which are already supported as prime modes because the CCD is more efficient than the MAMA above 250 nm. These modes have less long‐wavelength scatter protection than the prime NUV MAMA modes. The NUV echelle modes would be lost if the NUV MAMA failed.
5. CALIBRATION SYSTEM
Calibration lamps are provided for wavelength calibration and flat fields.
Three Pt/Cr‐Ne hollow‐cathode lamps similar to those flown on the Faint Object Spectrograph provide wavelength calibration of the spectral modes and provide slit reference illumination for target acquisition. Together they cover the 115–1000 nm wavelength range, overlapping each other, but generally with Pt covering 115–300 nm, Cr covering 300–500 nm, and Ne covering 500–1000 nm (Sansonetti et al. 1992; Kelly 1987). Their spectral lines are sharp enough to provide in‐flight measurement of the spectral resolution, except for the highest resolution modes, E140H and E230H, where the hyperfine structure of195Pt is partially resolved. To provide a range of brightnesses, these wavelength calibration lamps can be operated at three current levels, 3.8, 10, and 20 mA.
Three flat‐field continuum lamp types are provided. Continuum spectra reasonably free of lines are required to measure the pixel‐to‐pixel sensitivity variations across the detectors (called flat fields) close to the wavelengths of use. The near‐UV (165–310 nm) can be illuminated by a deuterium radio‐frequency (RF) excited lamp, modified from the design used by WFPC2. The far‐UV (115–170 nm) can be illuminated by a similar krypton RF lamp down to 128 nm. The krypton lamp is followed by an SrF2 filter, and the deuterium lamp is followed by a fused quartz ND1 filter. These filters remove strong lines to smooth the spectra and reduce the beam intensities to reduce photopolymerization of the following optics. The visible and near‐IR (305–1000 nm) is covered by four tungsten bulbs in a single housing. These bulbs can be operated singly or in specific paired combinations.
The lamps are organized into two independent optical subsystems: the hole‐in‐the‐mirror (HITM) system, and the insertion mirror (IM) system.
The HITM system contains two of the Pt/Cr‐Ne wavelength calibration lamps. Their beams are combined by UV‐optimized MgF2 beam splitters and delivered through a hole in the second corrector mirror. A pupil is formed at the second corrector mirror, which contains the reverse spherical aberration to the telescope primary mirror as well as a correction for astigmatism. In the shadow of the telescope secondary mirror image, a hole was put in the corrector. This allows a narrow beam from the spectral line lamps (f/185) to be input along the spectrograph axis without requiring a moving mechanism. The Pt/Cr‐Ne lamps in the HITM subsystem provide reliable spectral formats for dispersion and wavelength offset determination, as well as target acquisition illumination.
The IM system contains the remaining Pt/Cr‐Ne spectral line lamp and the continuum flat‐field lamps. Beams from the continuum lamps are combined by UV‐optimized MgF2 beam splitters into a single beam, and then transferred via an elliptical mirror, a spherical mirror, and fold flats to a fold‐flat mirror on a mechanism (the calibration insertion mechanism, or CIM). The Pt/Cr‐Ne lamp beam is combined with the same optics as the continuum lamp beams with the exception of a reimaging toroidal mirror immediately downstream of the Pt/Cr‐Ne lamp. The CIM can be inserted into the beam from the telescope to deliver a beam into the spectrograph from the same direction as an external celestial source. This beam slightly overfills the f/24 cone from the telescope. The elliptical mirror collects the light from the lamps and focuses the lamp images onto the spherical mirror, which focuses the image of the elliptical mirror onto the slit wheel. For the UV, this provides as uniform a source as possible at the entrance aperture to the spectrograph without suffering the light losses of a diffuser, and with approximately the correct cone angle, for optimal flat‐fielding. For the visible, there is sufficient light that a diffuser is incorporated in the tungsten lamp assembly prior to the reflective relay system described.
In order to provide useful calibration exposure times over the range of instrument modes, where the dispersion range multiplied by the efficiency range is greater than 106, and to provide for expected substantial degradation of lamp intensities, particularly of the continuum flat‐field lamps in the UV, several slits and a range of neutral density filters are dedicated to the calibration system. As the lamps get dimmer, probably mostly due to polymerization of contaminants on their windows from their own strong UV flux, less dense neutral‐density filters may be used, and eventually increasingly wider clear slits can be used to provide sufficient flux for calibration measurements.
Initial results for the S/N achieved in the UV with the MAMA detectors are found in Kaiser et al. (1998).
6. MECHANISMS
There are eight mechanisms in STIS: the mode select mechanism, the slit wheel, the CCD shutter, the corrector mechanism, the external shutter, the calibration insertion mechanism, the mode isolation shutter, and the echelle blocker.
All the mechanisms have electrical redundancy by being controllable from either of two electrical sides through redundant motor windings.
6.1. Mode Select Mechanism (MSM)
This mechanism, also called the nutating grating wheel, performs the primary selection of the operating mode (Fig. 3). It moves the selected mode‐defining optic—grating, mirror, or prism—into the optical beam and tilts that optic to the correct angle to direct the beam to the following optic.
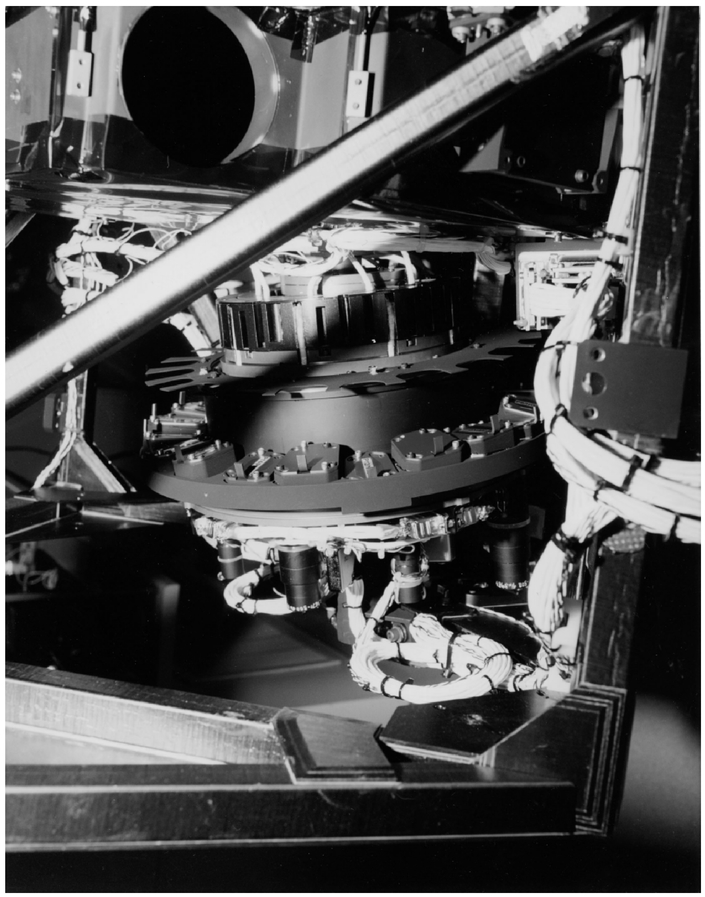
Fig. 3.— The mode select mechanism, showing the first‐order gratings, mirrors, and a prism. The mechanism inserts the selected optic in the beam and tilts it toward the subsequent optic or detector and selects the wavelength.
This function is accomplished with three concentric nested cylinders. One cylinder rotation moves the optic, one of 21 on a ring, into the beam. The other two cylinders, whose axes are tilted by 2 5 with respect to the first and to each other, operate together to tilt the ring to the selected angle and can reach any azimuth within a 5° radius.
The tilt is used to select the observing wavelength for those modes where the whole bandpass does not fall on the detector for one tilt angle. These are three of the four echelle modes (E140H, E230M, and E230H) and all four medium‐resolution long‐slit modes (G140M, G230M, G430M, and G750M).
In addition, the tilt has been used to provide the precise final centering for the wavelength and slit position on the detector for all the modes after more coarse angular shimming of the optics.
Partial mechanical redundancy is built into the design in that if one cylinder failed, then the two tilted cylinders can be set with their tilts in opposition to allow access to every mode in the untilted position. This would provide full capability for those modes where tilting is not required and a limited wavelength range for the others.
6.2. Slit Wheel
The other primary mechanism is the slit wheel (Fig. 4), which provides 65 apertures or slits, for limiting the field for spectroscopic or imaging functions, as described in § 3.4.
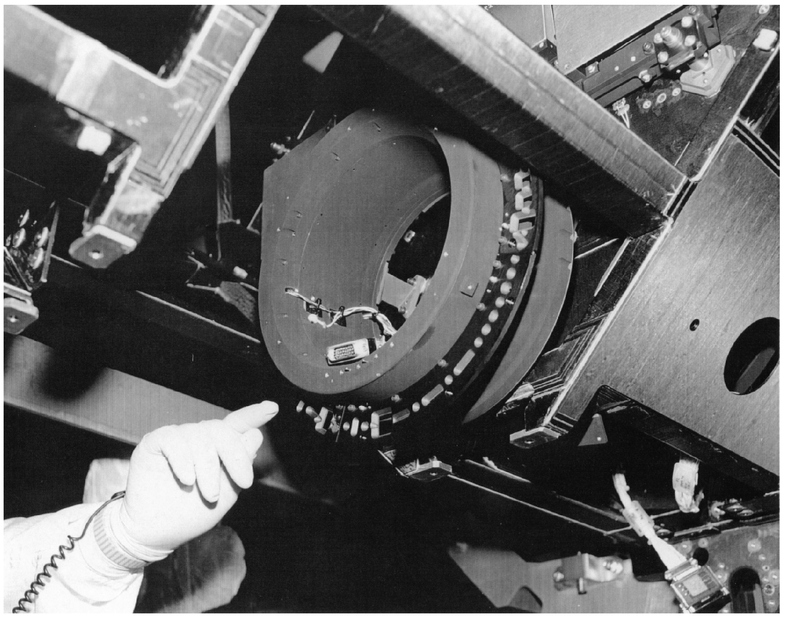
Fig. 4.— The slit wheel. The slit wheel contains four segments, each with a different pattern of slits or apertures, totalling 65 slits from which the slit in use is selected by turning the wheel.
For each spectral mode selected using the MSM, an appropriate slit or aperture may be chosen.
6.3. Corrector Mechanism
To achieve full science capability, the first corrector mirror is independently focusable over a ±5 mm range with 30 μm accuracy and 15 μm stability to focus STIS to the HST Optical Telescope Assembly (OTA). The first corrector mirror also requires two‐axis tilt adjustment over a ±10' range with 5'' accuracy, to center the HST exit pupil on the second corrector mirror. This corrects the aberration with 0 1 (1 σ) stability over a science observation to maintain the OTA pointing axis stable to 4 mas.
6.4. Other Mechanisms
The CIM contains a 45° mirror that it can insert into the beam from the telescope after the second corrector mirror and before the slit wheel, to block the telescope beam and replace it with a beam from one of the lamps from the IM system described above. As part of a bright object protection operational scheme, the CIM is also used to shutter either the external source or the internal lamp source around MSM and slit wheel motions, to protect the MAMA detectors, which have no shutters, from excessive light.
An external shutter was placed in front of the instrument to protect the corrector mirrors from excessive UV illumination. This is particularly important early in the flight before contaminants have evaporated from the new hardware on the spacecraft. This shutter is closed except while observing an external target.
Because the both CIM and the external shutter can block the main beam, it is essential that the mechanisms do not fail. They are therefore fully redundant mechanically, with separate nested bearings, each with motors and encoders that can be controlled from either electrical side of the instrument. If a failure should occur, the mirror or shutter would be removed from the beam using the backup methods.
The mode isolation shutter and the echelle blocker work together to minimize stray light by blocking the optical paths not in use to the MAMA detector in use.
A shutter covers the CCD during readout to prevent smearing. It can provide exposure times as short as 0.1 s and has a blade on a wheel shaped to provide uniform illumination across the CCD surface.
7. CONTROL AND DATA HANDLING
7.1. Electronics
7.1.1. Electrical Subsystem
The HST Science Instrument Control and Data Handling (C&DH) system is a fully redundant system (side A and side B) that provides power, and data and command handling, for STIS. The STIS electrical system is redundant, consisting of side 1 and side 2, which are each able to receive power, and data and command handling, from either side of the HST C&DH. Each side of STIS can control the entire instrument independent of the other side. STIS side 1 is the primary side of operation. Redundant electrical systems make STIS practically immune to single electrical fault failures, including the one that occurred in the GHRS and was fixed during HST Servicing Mission 1. There is limited cross strapping between side 1 and 2 to reduce the likelihood of having to switch to side 2 in the case of a single failure, making STIS somewhat immune to dual failures.
Command and data handling from HST is supplied to STIS via the redundant remote interface units (RIUs) A and B installed in STIS. STIS side 1 or side 2 can be controlled from RIU A or RIU B. The normal mode of operation is RIU A to main electronics box (MEB) side 1. In addition to passing commands to the STIS electronics and computer, the RIU drives the external shutter directly.
Each MEB contains a control section, a support electronics section, a MAMA interface electronics, and a low‐voltage power supply.
7.1.2. Control and Support Electronics Sections
The control section (CS) receives commands from the RIU and either acts on that command (e.g., dump science data from memory to HST) or controls another section of STIS (e.g., rotate a mechanism). The CS gathers data from the detectors, performs any data manipulation, then formats and temporarily stores the data before sending the data to the science data formatter in HST. The heart of the CS section is the CPU containing an Intel 80386 microprocessor. The CS contains a science data buffer able to hold 16 Mbytes of data in static read addressable memory (SRAM). This is enough storage to hold two MAMA images or seven CCD images plus overscan. The CS receives hardware engineering data from the support electronics section (SES), presents a portion of this data to the RIU for transfer to HST, and merges the other portion to be included as header information in the science data. The CS contains programmable read‐only memory (PROM) for boot software code, and 2 Mbytes of electrically erasable PROM (EEPROM) and error‐correcting RAM for storing the operational software code. The operational software code is maintainable from the ground because it is stored in EEPROM. Changes can be made to the software in RAM in order to limit the number of write cycles to the EEPROM.
The SES acts on commands from the CS and RIU and is responsible for controlling seven of the eight mechanisms within STIS, collecting engineering data and digitizing it, controlling the calibration lamps, and controlling and setting the CCD TEC temperature.
7.1.3. MAMA Interface Electronics
The MAMA interface electronics (MIE) consist of the circuitry necessary to receive decoded address data and a strobe from the MAMA, attach a time tag or Doppler correction if required, and store the resulting data at the proper address in CS buffer memory. When the MIE is commanded into subarray mode, the address data received is checked for its inclusion in the subarray; if not the data is discarded. The MIE receives the exposure time from the CS and notifies the CS when the exposure is complete. The core of the MIE is the Intel 80386 microprocessor with associated EEPROM and RAM. The software code located in the MIE is changeable on orbit. When storing the MAMA address data, the MIE takes over the CS bus to store the data into buffer memory by way of direct memory access.
7.1.4. MAMA Detector Electronics
The MAMA tube assembly is housed with the MAMA detector electronics to assist in maintaining low noise in the MAMA science data. The MAMA detector electronics relieve the CS CPU from repetitive tasks of collecting MAMA data and provide the ability to capture photon events at a maximum rate of 300,000 events s−1. The MAMA detector electronics consist of a low‐voltage power supply, high‐voltage power supply, control electronics, the charge amplifier/discriminator, and decode circuitry. The low‐voltage power supply provides power to the MAMA detector control electronics (MCE), high‐voltage power supply, and charge amplifier/decode circuitry. The discriminator threshold and high‐voltage power supply are programmable by the control electronics. A hardware bright scene detection circuit disables the detector high voltage when an equivalent global rate exceeds 106 counts s−1. The MCE incorporates precision counters that are used to protect the detector from global and local overillumination, as well as providing a diagnostic tool for monitoring detector health. The MCE is centered around a 80C51 microprocessor with embedded, unmodifiable software code. Commands are received by the MCE from the CS communications board to setup exposures (e.g., turn on and set high‐voltage levels) and for sending MAMA engineering telemetry to the CS.
In orbit, an optical isolator in each MCE was found to be sensitive to high‐energy particles. This could cause partial resetting of the MCE, which has a slight probability of leading to dangerous overvoltage of the detector. The CS software was modified to remove this danger, and MAMA high voltage is not being turned on within the block of South Atlantic Anomaly (SAA) passages.
The core of the MAMA detector electronics is the charge amplifier/discriminator and decode circuitry. This circuitry receives data from the MAMA tube and determines the unique pixel address for each photon event. Within the MAMA tube, there are a total of 132 anodes, which uniquely map a 2048 × 2048, 12.5 μm pixel region of the MCP. This region is called the active area of the array, and the imaging events are recorded within this boundary. Each of the 132 anodes is connected to a charge amplifier/discriminator. When an event occurs that has enough charge to exceed the discriminator threshold, a logic level pulse is produced. The MAMA decoder is connected to the output of 132 discriminators and determines the address for the valid event produced in the MAMA tube. This address data is sent to the CS MIE for further processing and storage. Photon counts are accumulated and integrated in time within the CS buffer memory based on their pixel location. Each amplifier/discriminator is implemented as a bipolar ASIC, and the x and y decoders are each ASICs (Kasle 1988).
7.1.5. CCD Electronics Box
A state machine receives commands from the CS and configures the CCD timing patterns, bias voltages, clock voltages, and offset voltage levels for all exposures. The state machine contains 32 Kbytes SRAM and 32 Kbytes EEPROM to hold timing patterns. The CS can modify the timing patterns by writing into SRAM and EEPROM over the serial command link.
In addition to the CEB electronics, two small preamplifier boards are located at the CCD package to maintain low noise for timing patterns into the CCD and analog data output from the CCD. Each of the CCD's four output channels are fed to a low‐noise preamplifier. The four preamplifier outputs are fed to the CEB analog signal processing board where they are digitized to 16 bit accuracy and sent to the CS buffer.
7.2. Software and Operations
The operations of the three STIS detectors and seven of the eight mechanisms (the external shutter is the exception) are controlled by software executing out of one of the microprocessors within the instrument. There are two Intel 80386 microprocessors, referred to hereafter as the CS processor and the MIE processor, respectively. Additionally, there is an 80C51 microcontroller, which handles the MCE and a timing state machine (TSM), which executes CCD timing patterns.
The STIS control section provides one of the two interfaces between STIS and the spacecraft, the other being command and telemetry routed directly to STIS hardware via a dedicated RIU. The software operating within the CS processor interacts, through dedicated channels in the RIU, with STIS software operating out of the spacecraft's command and data handling computer, the NSSC‐1. The STIS command language is macro based. The CS responds to specific macro commands by executing a sequence of commands to perform a specific function, such as move a mechanism or start an exposure. The CS also sends telemetry back to the NSSC‐1 computer, in the form of normal and special engineering data. Through this telemetry, STIS can request spacecraft maneuvers during target acquisition, keep the NSSC‐1 informed that STIS is still operating properly, and request action from the NSSC‐1 in case of instrument anomalies.
STIS flight software (FSW) resides in the EEPROM section of STIS internal memory, with a small image of startup (boot) code resident in PROM. When the STIS MEB is turned on, the CS will execute initially out of PROM. Once successfully in the boot state, the operate image will be downloaded from EEPROM into a dedicated section of internal memory. This section has active error correcting and detecting circuitry, to ensure that the operating code is not corrupted while the instrument is operating. In addition to the operating code, tables of calibration values will also be downloaded from EEPROM. These are items such as limits on voltages, temperatures, and other values checked in the internal telemetry sampling tasks, as well as the mechanism positions, brightness limits, and other items that the ground system may wish to modify periodically. The operate code image for the MIE also resides in EEPROM; the CS will transfer it to MIE RAM when the MIE is commanded to its operate state. CCD voltages and exposure timing patterns are kept in EEPROM as well. The CS and MIE operate software is fully modifiable in flight. Boot code is nonmodifiable. Also, there is software in the MCE PROM, which is also nonmodifiable.
When commanded, the STIS control section software can move seven of the STIS mechanisms to the requested positions. In the case of the MSM, the FSW will determine the three cylinder resolver positions required for the proper positioning of the optic based on the optic's mnemonic and the commanded wavelength. For the slit wheel, echelle blocker, mode isolation shutter, and calibration insertion mechanism, the FSW sends the required number of steps to move the controlling stepper motor, based on the commanded position. For all these mechanisms, the FSW will check the final position against the commanded position and issue an error message if they do not match within tolerance. The corrector mechanism is commanded in a fashion similar to the stepper motor mechanisms, but all positioning is relative and there is no closed loop control. The CS FSW also manages the STIS internal calibration lamps.
The STIS CS FSW manages the 16 Mbytes of buffer memory available for the temporary storage of data. These data can be science data collected by one of the three STIS detectors, engineering diagnostic data by which the FSW can get better time sampling of the engineering telemetry from a specific piece of STIS hardware, or memory dumps from the CS or the MIE or the CCD TSM. Data from multiple exposures may reside in buffer memory at one time and may be sent to the spacecraft data recorder while another exposure is in progress. In MAMA time‐tag mode, data can be dumped to the spacecraft while an exposure is in progress in order to allow enough available memory to store incoming events. The FSW will suspend processing of events in time‐tag mode if no space in buffer memory is available. Note that for each exposure, the FSW will create a science data header, which contains the commanded exposure setup value and snapshots of engineering telemetry before and after the exposure. The header is stored in the error detection and correction section of memory, to prevent corruption of its contents, in particular, programmatic information by which the ground system will identify the data.
The STIS control section is limited in the execution of parallel activities. Internal telemetry is constantly being monitored, but only single command tasks can be executed at one time. Although this greatly simplified the STIS flight software, it forces a typical command sequence, such as the execution of an exposure, into a sequential string of activities, such as moving the slit wheel to the desired aperture, moving the MSM to put the optic into place, setting up buffer memory for and exposure, starting the exposure, and performing postexposure cleanup.
Detector control is somewhat different for the CCD than it is for the MAMA detectors. The CCD TSM is powered on by direct command via the RIU. The control section FSW ensures proper TSM function by resetting the TSM. As mentioned above, the CCD setup voltages are configured by command from the CS to the CCD electronics. The final step of configuration is for CS to command the TSM to execute an infinite flush pattern, while waiting to start a CCD exposure. Although the MAMA detector low‐voltage power is controlled via the RIU, the CS controls the configuration of the MAMA charge amplifiers, decode configuration, and high voltage by commands sent to the MCE processor. MAMA detector high voltage is controlled by a sequence of commands issued by the CS to the MCE. The voltage is ramped in steps, and the CS monitors the detector voltage, current, and dark rate at each step. Out‐of‐limits conditions result in the disabling of high voltage. During high‐voltage operations, the CS will command the MCE to perform a continual check of the detector global count rate. The MCE FSW responds to violations of count rate limits by disabling high voltage.
Taking an exposure with one of the STIS detectors requires the interaction of the STIS CS processor with the device controlling the detector. In the case of the CCD, the CS will load the timing pattern for the type of exposure commanded into the CCD TSM. The TSM will execute the timing pattern, which includes control of the CCD shutter and the final clocking of the accumulated charge out of the CCD chip. The resulting data, after being processed through an analog‐to‐digital converter, is transferred via a FIFO to a previously allotted section of CS buffer memory. For the MAMA detectors, the control is somewhat different. The CS will command the MIE to initiate an exposure, which will then be controlled by code executing within the MIE processor. The MIE FSW will receive events from the MAMA detectors via a FIFO device. As the MIE pulls events from the FIFO, it will transfer them, in blocks of 32, directly to buffer memory by way of a bus shared with the CS, using a map of address space defined in the exposure setup. In accum mode, the MIE will increment a 16 bit register at a specific address in buffer memory every time a count is received from a single location on the detector. Note that the mapping can be modified during accum mode to account for Doppler shifting. In time‐tag mode, the MIE will transfer each event as a 32 bit quantity, including 22 bits of spatial information and a 10 bit time stamp, into buffer memory. In time‐tag mode, the FSW keeps track of address pointers, as memory is filled by incoming events, or cleared when data is dumped to the spacecraft. For all MAMA exposures, the CS will command the MIE to perform a local rate check. This is a "quick‐look" image that, unlike normal MAMA data, is not transferred directly to buffer memory. The MIE FSW will check the image for violations of the local count rate limits and request the CS to shutter the detector using the calibration insertion mechanism if the limits have been violated.
7.2.1. Target Acquisition
Target acquisition is described in more detail by Becker, Kraemer, & Kimble (1998). The STIS flight software has the capability of executing several types of autonomous target acquisitions. These can be divided into two modes: (1) finding a target in a detector field of view and placing it in a spectroscopic slit, and (2) centering the target within a slit. The former is called "target location" and the latter is called a "peakup."
Although target acquisition can be carried out with any of the three STIS detectors, the CCD is primary for both modes of target acquisition. In order to avoid confusion in measuring target location and flux, images taken during target acquisition are corrected for hot pixels and cosmic‐ray hits and have a bias level subtracted.
The FSW can execute three different types of target location. The first is the location of a point source. The sequence is as follows. An initial image of the field is taken in undispersed light through one of the imaging apertures. In order to save time, this image is taken as a subarray, rather than a full‐field image. The subarray size is large enough to allow for initial pointing error when the target is slewed into the STIS aperture. While the image resides in buffer memory, the FSW checks through address space to find the 3 × 3 set of pixels with maximum flux. This set is called a "checkbox." The FSW then calculates the flux‐weighted centroid of this brightest box to get the target location. The FSW then requests a spacecraft slew to place the target in the expected slit center. A postslew image is then retaken, and the target is located by the process described above. The slit wheel is moved to place the spectroscopic slit in place. The slit is back‐illuminated with one of the calibration line lamps and an image is taken. The FSW finds the slit center position via a threshold centroid, which corrects for errors that would occur if the target were already in the slit when it was illuminated. A final slew is then requested to move the target into the center of the slit. Diffuse acquisition is similar, but the observer can adjust the size of the checkbox; the subarray will be increased accordingly. Planetary acquisitions are similar to the diffuse acquisition but, instead of determining the target position via flux weighted centroid, a thresholded centroid is used. This minimizes errors that could occur if the albedo across the target varies significantly (e.g., the Jovian moon Io).
Although the target locate process is quite accurate (better than 0 05 for a point source), the peakup mode is necessary to center the target in the smaller STIS spectroscopic slits. The peakup requires scanning the slit across the source and taking subarray images at each dwell point. The slews between dwell points are requested by the STIS FSW. Once the full dwell pattern is executed, the FSW calculates the flux‐weighted centroid of the set of dwell points and calculates the pointing correction necessary to place the target at this point. A slew request is then issued, and a final confirmation image is taken at the resulting point. Instead of determining the final pointing via a centroid, the FSW can also be commanded to return to the brightest dwell point. Different scan patterns are used for different slits. Linear scans can be executed in either dimension for smaller slits, while the scans are in the dispersion direction for peakups in the long slits. For the smallest square slits, a spiral dwell pattern may be executed. Peakups may be executed in either imaging or dispersed modes. The demonstrated peakup accuracy has been ∼0 01. It is not recommended to try peaking up in slits wider than 0 2, because the peakup algorithm may actually degrade the accuracy of the centering resulting from the target locate for these wider slits.
In order to perform occulted observing, the FSW can be commanded to center targets behind occulting bars, in either the long slits or the special occulting aperture. At its simplest, this can consist of a normal target locate, followed by a ground commanded offset to place the target behind the bar. For the most accurate positioning, a "peakdown" can be executed. This is similar to the peakup, but instead of finding the point of maximum brightness, the FSW will find the point of minimum brightness and position the target accordingly.
8. STRUCTURAL AND THERMAL DESIGN
The optics, mechanisms, and detectors are supported on a graphite/epoxy optical bench with a low coefficient of thermal expansion to minimize image motion and focus change with temperature. Three pairs of heaters are provided on a thermal shelf above the optical bench, intended to maintain the optical bench temperature to within ±2°C in each of three zones along the bench. The bench is kinematically mounted within the graphite/epoxy enclosure, which in turn is kinematically mounted on latches within the spacecraft.
The enclosure also supports the electronics, outside the thermally protected optical bench area. Three vents at the back of the enclosure allow pressure relief at launch and outgassing afterward. The two vents in the optical bench region contain optical baffles to control any stray light from the aft shroud.
The thermal design was intended to control and stabilize the optical bench temperature. It was modified less than a year before launch following predictions that the aft shroud would get much hotter than previously predicted because of the degradation of its outer optical properties from solar UV and because of the additional power used by STIS and NICMOS operating in parallel. The priority shifted to removing heat from STIS. Heat pipes were added between the MAMA detectors and the aft bulkhead, and copper radiator plates were added to the aft bulkhead to distribute the heat. Radiator plates were added to the MEBs, insulation was removed from the thermal shelf, and conducting braids were added to calibration lamps. Also, connection blocks were added to the aft bulkhead for future connection of additional cooling.
9. SUMMARY
We have described the STIS instrument design and its scientific rationale. The STIS in‐orbit performance as of 1997 July is summarized in Kimble et al. (1998).
STIS will enable more thorough investigations of problems ranging from the detection of protoplanetary disks, measurement of the masses of black holes, to the composition of matter in and between galaxies and the activity of the earliest galaxies.
The design is centered around the use of the two‐dimensional detectors most appropriate for their wavelength ranges—with development of their performance characteristics within the program—and developing and using mechanisms where required to capitalize on the versatility enabled by the small optical pupil size, which is itself enabled by the sharpness of the HST image.
We thank the large number of people, particularly at Ball Aerospace and the HST Project Office, who have contributed to the building and testing of STIS over the years, and the STS‐82 astronauts who installed STIS into the HST. The building of STIS was supported by funding from NASA HQ via the GSFC HST Project Office.
Footnotes
- 17
Current information about STIS is found at the Investigation Definition Team's World Wide Web site at http://hires.gsfc.nasa.gov/stis/stispage.html.
- 18
The STScI STIS Handbook is found on the World Wide Web at http://www.stsci.edu/ftp/instrument_news/STIS/topstis.html.