The interaction of magnetic fields and convection is investigated in the context of the coronal heating problem. We study the motions of photospheric magnetic elements using a time series of high-resolution G-band and continuum filtergrams obtained at the Swedish Vacuum Solar Telescope at La Palma. The G-band images show bright points arranged in linear structures ("filigree") located in the lanes between neighboring granule cells. We measure the motions of these bright points using an object tracking technique, and we determine the autocorrelation function describing the temporal variation of the bright point velocity. The correlation time of the velocity is about 100 s. To understand the processes that determine the spatial distribution of the bright points, we perform simulations of horizontal motions of magnetic flux elements in response to solar granulation flows. Models of the granulation flow are derived from the observed granulation intensity images using a simple two-dimensional model that includes both inertia and horizontal temperature gradients; the magnetic flux elements are assumed to be passively advected by this granulation flow. The results suggest that this passive advection model is in reasonable agreement with the observations, indicating that on a timescale of 1 hr the flux tubes are not strongly affected by their anchoring at large depth. Finally, we use potential-field modeling to extrapolate the magnetic and velocity fields to larger height. We find that the velocity in the chromosphere can be locally enhanced at the separatrix surfaces between neighboring flux tubes. The predicted velocities are several km s-1, significantly larger than those of the photospheric flux tubes. The implications of these results for coronal heating are discussed.
Subject headings:convection![]() Sun: corona
Sun: corona![]() Sun: granulation
Sun: granulation![]() Sun: magnetic fields
Sun: magnetic fields
1 Present address: Stockholm Observatory, SE-133 36 Saltsjöbaden, Sweden.
Observations of the Sun in X-rays show that the corona is heated to several million degrees, and that magnetic fields play a key role in this heating process (e.g., Vaiana & Rosner 1978; Golub et al. 1980; Pallavicini et al. 1981; Kano & Tsuneta 1995, 1996; Shimizu & Tsuneta 1997; Yoshida & Tsuneta 1996; Falconer et al. 1997). The energy source for this heating must lie in the turbulent convection zone below the photosphere. The interaction of the magnetic field with convective flows produces two types of magnetic disturbances. First, the buffeting of magnetic flux tubes by the granulation flow generates transverse magnetohydrodynamic (MHD) waves (e.g. Steiner, Knölker, & Schüssler 1994), which propagate upward along the magnetic flux tubes and dissipate their energy in the chromosphere or corona (see Ofman, Klimchuk, & Davila 1998 and references therein). Second, in coronal loops the random motions of the footpoints produce twisting and braiding of coronal field lines, which generates field-aligned DC electric currents that can be dissipated resistively (Parker 1972, 1983; Tucker 1973; Rosner et al. 1978; Sturrock & Uchida 1981; Heyvaerts & Priest 1984; van Ballegooijen 1985, 1986, 1990a; Milano, Gomez, & Martens 1997). The main difference between these processes is that plasma inertia plays a key role in MHD wave propagation, but it is not important for the dynamics of field-aligned currents. Therefore, magnetic heating mechanisms can be crudely classified as either wave-heating or current-heating mechanisms (for reviews of coronal heating theory, see Narain & Ulmschneider 1990, 1996; Zirker 1993).
The relationship between coronal heating and the dynamics of photospheric magnetic structures is not well understood. Van Ballegooijen (1985, 1986) proposed that the slow twisting and braiding of coronal field lines by horizontal footpoint motions leads to a cascade of magnetic energy within coronal loops. The heating rate predicted by this model is ![]()
![]() B
B D/(4
D/(4![]() L
L ), where B0 is the coronal field strength, L is the loop length, and D is the diffusion constant describing the random walk of photospheric flux elements. The latter is given by D
![]() u
u ![]()
 , where u0 is the typical velocity of the magnetic elements, and
 ![]() 0 is the velocity coherence time. Observations of the spreading of active regions indicate that D is in the range 150 to 425 km2 s-1 (DeVore et al. 1985), but such values of D yield coronal heating rates that are a factor of
0 is the velocity coherence time. Observations of the spreading of active regions indicate that D is in the range 150 to 425 km2 s-1 (DeVore et al. 1985), but such values of D yield coronal heating rates that are a factor of ![]() 40 too small compared to observed radiative and conductive loss rates (van Ballegooijen 1986). We suggest that there may exist short-period motions with velocities of 1
40 too small compared to observed radiative and conductive loss rates (van Ballegooijen 1986). We suggest that there may exist short-period motions with velocities of 1![]() 2 km s-1 that contribute to coronal heating but do not contribute to the spreading of active-region flux on timescales of days to months (i.e., the motions cannot be described by a random walk). Short-period motions of magnetic elements have indeed been observed (e.g., Berger & Title 1996), but the characteristics of such motions are not well understood, and it is unclear whether the velocities are sufficient to explain the observed coronal heating.
2 km s-1 that contribute to coronal heating but do not contribute to the spreading of active-region flux on timescales of days to months (i.e., the motions cannot be described by a random walk). Short-period motions of magnetic elements have indeed been observed (e.g., Berger & Title 1996), but the characteristics of such motions are not well understood, and it is unclear whether the velocities are sufficient to explain the observed coronal heating.
A number of authors have developed three-dimensional simulation models of the magnetic structure and heating of solar coronal loops (e.g., van Ballegooijen 1988, 1990b; Mikic, Schnack, & Van Hoven 1989; Longcope & Sudan 1994; Hendrix et al. 1996; Galsgaard & Nordlund 1996). In these simulations, an initially uniform field connecting two parallel plates is considered (the plates represent the photosphere at the two ends of a coronal loop). The footpoints at the boundary plates are subjected to a series of randomly phased, sinusoidal flow patterns. The flows are incompressible, so that the component of magnetic field perpendicular to each boundary plate remains uniform. This is obviously not a good model of the actual conditions in the solar photosphere. Observations indicate that the photospheric magnetic field is highly intermittent, consisting of discrete flux elements with nearly field-free gas in between (e.g., Title, Tarbell, & Topka 1987; Title et al. 1992). The solar convection plays a key role in producing these flux elements, which are mainly located at the boundaries between granulation cells. This concentration of flux into discrete elements probably has important consequences for coronal heating; if the magnetic field consists of a bundle of topologically distinct flux tubes, then the random motions of these flux tubes in the photosphere will create tangential discontinuities at the interfaces between the tubes in the corona (Parker 1972; Glencross 1975, 1980; Rosner et al. 1978; Sturrock & Uchida 1981; Démoulin & Priest 1997). Clearly, to understand where and how the corona is heated, it is necessary to study the dynamics of photospheric flux elements and to develop coronal heating models that take the presence of such flux elements into account.
In this paper we focus on the first part of this problem, namely, the dynamics of magnetic flux elements in the photosphere and chromosphere. We analyze observations of G-band bright points obtained at the Swedish Vacuum Solar Telescope (SVST) on La Palma, and derive the autocorrelation function describing the temporal variations of the bright-point velocity. We find that the velocity changes on a timescale of about 100 s. We develop an empirical model of the granulation flow and simulate the horizontal motions of flux tubes, assuming that they are passively advected by the granulation flow. By comparing the results of these simulations with the observed spatial distributions and velocities of G-band bright points, we show that this passive advection model is in reasonable agreement with the observations. Finally, we use potential-field modeling to extrapolate the magnetic and velocity fields to larger heights (up to 1500 km in the chromosphere). The results indicate that the spreading of the flux tubes with height and their interactions with each other produce plasma flows in the chromosphere with velocities of several km s-1, much faster than the velocities of the underlying photospheric flux tubes. This suggests that the coronal heating rate can be significantly enhanced by the three-dimensional geometry of the flux tubes in the photosphere and chromosphere.
Observations of the Sun with high spatial resolution show network bright points (Muller 1983, 1985, 1994; Muller & Keil 1983; Muller & Roudier 1984, 1992) and "filigree" (Dunn & Zirker 1973; Mehltretter 1974; Berger et al. 1995), which are small bright features located within the intergranular lanes. The bright points and filigree are seen in the wings of strong spectral lines such as H![]() and Ca II H and K, in lines formed in the photosphere, and even at continuum wavelengths (with reduced contrast). The widths of these structures is 100
and Ca II H and K, in lines formed in the photosphere, and even at continuum wavelengths (with reduced contrast). The widths of these structures is 100![]() 200 km, at the limit of resolution of ground-based solar telescopes. The bright points are associated with regions of strong magnetic field (Chapman & Sheeley 1968; Simon et al. 1988; Title et al. 1987, 1989, 1992; Keller 1992) and correspond to magnetic flux tubes of kilogauss field strength that stand nearly vertically in the solar atmosphere (Stenflo 1973; Stenflo & Harvey 1985; Sanchez Almeida & Martinez Pillet 1994; see also the review by Solanki 1993). The granules near network bright points are smaller and more numerous than near a normal intergranular space (Muller, Roudier, & Hulot 1989). The filigree produce abnormal granulation patterns (Dunn & Zirker 1973), and appear to be chains of bright points that fill the intergranular lanes (von der Lühe 1994).
200 km, at the limit of resolution of ground-based solar telescopes. The bright points are associated with regions of strong magnetic field (Chapman & Sheeley 1968; Simon et al. 1988; Title et al. 1987, 1989, 1992; Keller 1992) and correspond to magnetic flux tubes of kilogauss field strength that stand nearly vertically in the solar atmosphere (Stenflo 1973; Stenflo & Harvey 1985; Sanchez Almeida & Martinez Pillet 1994; see also the review by Solanki 1993). The granules near network bright points are smaller and more numerous than near a normal intergranular space (Muller, Roudier, & Hulot 1989). The filigree produce abnormal granulation patterns (Dunn & Zirker 1973), and appear to be chains of bright points that fill the intergranular lanes (von der Lühe 1994).
The dynamical behavior of bright points has been studied by a number of authors. Muller (1983) found that facular points on the quiet Sun are predominantly located in patches at the periphery of supergranule cells, indicating that the magnetic elements are advected by the supergranular flow. The bright points always first appear in the dark spaces at the junction of several granules, never inside a granule nor in the space between only two granules. As the granulation pattern evolves, the bright points remain in the intergranular spaces throughout their lifetime, but not necessarily at the junction of several granules, as at the time of their first appearance. New bright points have a tendency to appear adjacent to existing points, and 15% of the bright points seem to split into two points that move apart until a separation of 1![]() to 1
to 1![]() 5 is reached. Muller et al. (1994) measured velocities of 29 isolated bright points and found a mean speed of 1.4 km s-1. Strous (1994) studied bright points in a growing active region. Using line-center images taken in Fe I 5576 Å, he found velocities between 0.26 km s-1 and 0.62 km s-1. Berger & Title (1996) measured velocities of 1
5 is reached. Muller et al. (1994) measured velocities of 29 isolated bright points and found a mean speed of 1.4 km s-1. Strous (1994) studied bright points in a growing active region. Using line-center images taken in Fe I 5576 Å, he found velocities between 0.26 km s-1 and 0.62 km s-1. Berger & Title (1996) measured velocities of 1![]() 5 km s-1 for G-band bright points in the "moat" around a sunspot; they showed that the motions are constrained to the intergranular lanes and are primarily driven by the evolution of the granulation pattern. They found that the bright points continually split and merge, with a mean time between splitting events of a few hundred seconds. Berger et al. (1998) observed a similar rapid splitting and merging of bright points in an enhanced network region.
5 km s-1 for G-band bright points in the "moat" around a sunspot; they showed that the motions are constrained to the intergranular lanes and are primarily driven by the evolution of the granulation pattern. They found that the bright points continually split and merge, with a mean time between splitting events of a few hundred seconds. Berger et al. (1998) observed a similar rapid splitting and merging of bright points in an enhanced network region.
In the present paper, we use observational data from the SVST on La Palma to derive time-dependent granulation flow fields and to simulate the horizontal motions of magnetic elements in the photosphere. The data were collected on 1995 October 5 between 10:57 and 12:08 UT. Observations were made simultaneously with two CCD cameras: one used a 12 Å bandpass interference filter with a center wavelength of 4305 Å (G band), and the other used a 54 Å bandpass filter with a center wavelength of 4686 Å. Frame selection was based on the G-band images: only the three best frames in each 20 s evaluation period were retained for analysis. Both cameras were equipped with phase-diversity beam splitters, which put two images on each CCD with a difference in focus position. The images were corrected for seeing effects using partitioned phase-diverse speckle restoration, and were carefully coaligned using image destretching techniques. The data were spacetime filtered to remove the effects of solar p-mode oscillations. The result is a time series of 180 images with very high spatial resolution, covering a period of about 70 minutes. The image scale is 0![]() 083 pixel-1, and the mean time between frames is
083 pixel-1, and the mean time between frames is ![]() t = 23.5 s.
t = 23.5 s.
The field of view (FOV) is a 29![]() × 29
× 29![]() area near the solar disk center, containing an enhanced network region. This region is the same as the network FOV described by Löfdahl et al. (1998), and we refer the reader to their paper for a detailed description of the observation and image restoration procedures. The data used here are in essence an early version of these data (Löfdahl 1996).
area near the solar disk center, containing an enhanced network region. This region is the same as the network FOV described by Löfdahl et al. (1998), and we refer the reader to their paper for a detailed description of the observation and image restoration procedures. The data used here are in essence an early version of these data (Löfdahl 1996).
Berger et al. (1998) analyzed the network FOV, where magnetic elements are seen as bright points with high contrast in the G band (which includes the molecular bandhead of CH) and with reduced contrast in the 4686 Å band (which contains continuum and many absorption lines). The solar granulation shows up with nearly equal contrast in both types of images. The bright points are generally located in the dark intergranular lanes. Subtraction of the G-band and 4686 Å images yields a difference image that shows the bright points and surrounding diffuse emission with unprecedented clarity. Berger et al. (1998) identified bright points using a threshold technique applied to these difference images. They define a "magnetic region" as the area within their FOV that is covered by bright points at any time during the movie. Using local correlation tracking (LCT) with subfields of 0![]() 4, they measure a mean granulation flow velocity of 0.641 km s-1 inside this magnetic region and 0.997 km s-1 in the surrounding quiet region. They also followed the motions of bright points using an object tracking technique, and found that the bright points have a broad velocity distribution that peaks at 0.1 km s-1 but extends to several km s-1, the mean velocity is 0.815 km s-1. The bright points continually split up and merge; the average time between merging and splitting events is 220 s. Some objects can be followed for the entire 70 minute duration of the movie.
4, they measure a mean granulation flow velocity of 0.641 km s-1 inside this magnetic region and 0.997 km s-1 in the surrounding quiet region. They also followed the motions of bright points using an object tracking technique, and found that the bright points have a broad velocity distribution that peaks at 0.1 km s-1 but extends to several km s-1, the mean velocity is 0.815 km s-1. The bright points continually split up and merge; the average time between merging and splitting events is 220 s. Some objects can be followed for the entire 70 minute duration of the movie.
Following Berger et al. (1998), we construct a time series of magnetic difference images ("magnetic image" for short) by subtracting the 4686 Å continuum images from the corresponding G-band images:

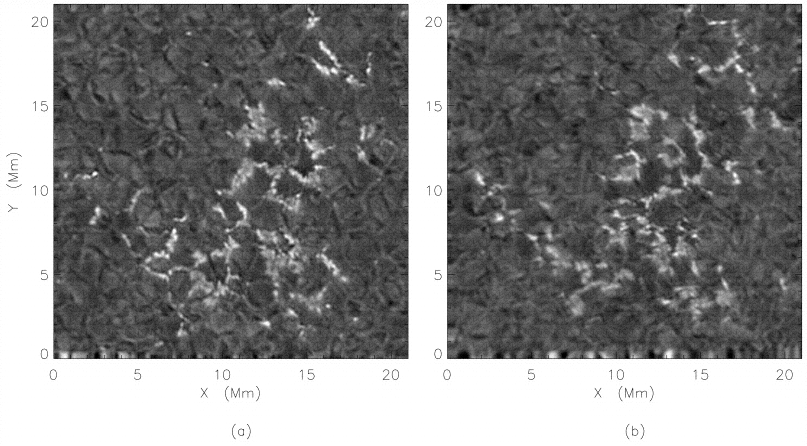
where x and y are horizontal coordinates on the Sun, t is the time, and I4305 and I4686 are intensities normalized to the mean intensity in nonmagnetic areas of the frame. Examples of such difference images are shown in Figures 1a and 1b (frames 40 and 177 of the time sequence). Note that the bright points form linear structures that fill the intergranular lanes and sometimes surround the granules on all sides. We compute magnetic masks by smoothing the Imagn images in space and time (running average over five frames) and applying a 2 ![]() threshold. These masks define the general areas where the bright points are located.
threshold. These masks define the general areas where the bright points are located.
 Fig. 1
We also construct granulation intensity images Iconv(x, y, t) by removing the bright points from the 4686 Å images as much as possible. This is done by subtracting a multiple of the magnetic image from the 4686 Å image:

where b0 ![]() 0.5. Scatter plots of Imagn versus Iconv confirm that most magnetic features are located in regions with low Iconv (i.e., in the intergranular lanes).
0.5. Scatter plots of Imagn versus Iconv confirm that most magnetic features are located in regions with low Iconv (i.e., in the intergranular lanes).
One of the difficulties in measuring the positions of G-band bright points is that they often have complex shapes, so that their positions are not always well defined. Moreover, the bright points frequently split up and merge, making it difficult to track bright points for long periods of time (Berger et al. 1998). To overcome these problems, we developed a new tracking technique that uses small but finite-size "corks" as tracers of bright points. The corks are small circular disks that move about on the photospheric plane but are not allowed to overlap each other. Each bright feature in the magnetic images is associated with a cluster of such corks; small clusters represent small, isolated bright points, and large clusters represent larger bright points with complex shapes or groups of bright points that are too closely spaced to be unambiguously separated. The advantage of this method is that the cork clusters can adjust their shapes to the actual shapes of the bright points, and the clusters can split up and merge, just like the real bright points.
In the present study we use 1400 corks, each with a radius r0 = 60 km, equal to the pixel size of the current data set. The method for computing cork positions is as follows. The initial positions are chosen at random from within the magnetic mask for frame 3, the first frame for which such a time-averaged mask can be computed (see § 2). The corks are advected by an artificial flow field  (x, y, t) that is proportional to the gradient of intensity in the magnetic image (
 ![]()
![]() Imagn), i.e., the corks are driven to the brightest regions in the image. As a result, clusters of corks collect at the bright points and follow the bright points as the brightness pattern evolves. The positions of the corks are advanced with a time step equal to one half of the time between frames in the movie (
Imagn), i.e., the corks are driven to the brightest regions in the image. As a result, clusters of corks collect at the bright points and follow the bright points as the brightness pattern evolves. The positions of the corks are advanced with a time step equal to one half of the time between frames in the movie (![]() t = 23.5 s). In each time step, we first advect the corks according to the artificial flow field, and then correct the positions to avoid cork overlap. This correction is performed iteratively; we first search for partially overlapping corks (i.e., pairs of corks with separations less than 2r0), and for each overlapping pair we correct the positions by moving the two corks apart in opposite directions along their separation line until the corks just touch each other. We then repeat the search to check whether any new overlapping pairs occurred as a result of the previous corrections, and if necessary we correct the positions again. This process is repeated until there are no overlapping corks before proceeding to the next time step. In this way we follow the corks until frame 177, near the end of the time sequence.
t = 23.5 s). In each time step, we first advect the corks according to the artificial flow field, and then correct the positions to avoid cork overlap. This correction is performed iteratively; we first search for partially overlapping corks (i.e., pairs of corks with separations less than 2r0), and for each overlapping pair we correct the positions by moving the two corks apart in opposite directions along their separation line until the corks just touch each other. We then repeat the search to check whether any new overlapping pairs occurred as a result of the previous corrections, and if necessary we correct the positions again. This process is repeated until there are no overlapping corks before proceeding to the next time step. In this way we follow the corks until frame 177, near the end of the time sequence.
The intensity of the bright points varies with time, and some bright points fade away, leaving the associated corks with nowhere to go. Therefore, on every fifth frame we remove corks that fall outside the magnetic mask (see § 2), and we reinsert new corks at other randomly chosen (unoccupied) locations within the mask. Typically, about 5% of the 1400 corks are replaced every fifth frame, and the total number of corks present over the entire time interval is 3827. Hence, the corks have lifetimes of Nk, which are multiples of 5 frames and range from 5 to 175 frames (here k is the cork index: k = 1, ![]() , 3827). In this way, we obtain cork positions (xk,n, yk,n) and velocities (vx,k,n, vy,k,n) as a function of time for each cork, where n is the time index (n = 1,
, 3827). In this way, we obtain cork positions (xk,n, yk,n) and velocities (vx,k,n, vy,k,n) as a function of time for each cork, where n is the time index (n = 1, ![]() , Nk). These cork velocities represent measurements of the velocities of the bright points.
, Nk). These cork velocities represent measurements of the velocities of the bright points.
Figures 2a and 2b show the spatial distributions of corks for frames 40 and 177 plotted over the corresponding granulation image. Note that the corks form dense clusters located in the intergranular lanes. Comparison with Figures 1a and 1b shows that the spatial distribution of the corks closely resembles the distribution of the bright points.
 Fig. 2
The random motions of the photospheric flux tubes produce MHD waves and other disturbances that propagate into the upper solar atmosphere and contribute to chromospheric and coronal heating. Models of wave generation (e.g. Choudhuri, Dikpati, & Banerjee 1993) predict that short-period motions are much more effective in generating waves than long-period motions. Therefore, it is of interest to determine the velocity autocorrelation function that describes how the velocity of a bright point varies with time. The autocorrelation of velocity vx,k,n over a time delay tm = m![]() t is given by
t is given by

and similarly for Cy, k,m. By averaging these functions for all corks with lifetimes Nk > m, we obtain mean autocorrelations 
 and
and  .
.
Figure 3 shows the mean autocorrelations and as functions of delay time tm for tm < 1000 s. Note that the autocorrelation decreases monotonically with time, i.e., there is no evidence for any specific periodicities in the bright-point motion. The autocorrelation decreases rapidly with time over the first few frames and more slowly thereafter. The initial decrease is probably due to measurement noise, but the more gradual decrease on a timescale of a few hundred seconds is probably real. We find that the data can be fitted with the function

where the first term represents the measurement noise, the second term describes random motions with a correlation time ![]() 0 = 100 s, and the last term describes motions with correlation times exceeding 1000 s. The effectiveness of these random motions in generating flux tube waves will be discussed § 6.
0 = 100 s, and the last term describes motions with correlation times exceeding 1000 s. The effectiveness of these random motions in generating flux tube waves will be discussed § 6.
 Fig. 3
Since we removed corks that fall outside the magnetic mask on every fifth frame (![]() 120 s), our results may be somewhat biased toward long-lived bright points that remain above the intensity threshold of the masks for long periods of time. However, typically only 5% of the corks are removed. Therefore, this bias should have only a minor effect on the autocorrelation function for delay times less than 1000 s.
120 s), our results may be somewhat biased toward long-lived bright points that remain above the intensity threshold of the masks for long periods of time. However, typically only 5% of the corks are removed. Therefore, this bias should have only a minor effect on the autocorrelation function for delay times less than 1000 s.
The measurement errors represented by the first term in equation (4) are probably due to telescope guiding errors and residual seeing effects. To reduce this effect, we computed mean cork velocities averaged over blocks of five frames (![]() 120 s). The average of these mean velocities is vx,avg = -57 m s-1 and vy,avg = +13 m s-1, and the standard deviation is vx,rms = 379 m s-1 and vy,rms = 385 m s-1. Note that the averaging time is comparable to the timescale of the random motions; therefore, the above values are likely to underestimate the true velocities on the Sun. Clearly, to measure bright-point velocities more accurately, improved observations with shorter sampling times (
120 s). The average of these mean velocities is vx,avg = -57 m s-1 and vy,avg = +13 m s-1, and the standard deviation is vx,rms = 379 m s-1 and vy,rms = 385 m s-1. Note that the averaging time is comparable to the timescale of the random motions; therefore, the above values are likely to underestimate the true velocities on the Sun. Clearly, to measure bright-point velocities more accurately, improved observations with shorter sampling times (![]() 10 s) are required.
10 s) are required.
Models of the interaction of magnetic fields with convection show that the magnetic flux tubes are expelled by the granulation flow (e.g., Schmidt et al. 1985). Convection models without a magnetic field indicate that at depths greater than a few 100 km, the convection consists of cool plumes of rapidly downflowing plasma embedded in a connected region of warm gentle upflow (Stein & Nordlund 1989, 1994, 1998; Chan & Sofia 1986; Cattaneo et al. 1991; Rast et al. 1993). The plumes are usually located below the vertices of the intergranular lanes visible at the solar surface. Magnetoconvection simulations predict that the magnetic field is swept into these downflow plumes (Nordlund & Stein 1989, 1990; Stein, Brandenburg, & Nordlund 1992; Nordlund et al. 1992). In weak field regions (average magnetic flux density <50 G), the magnetic field will likely be concentrated into discrete vertical flux tubes located within the downflow plumes, consistent with observations of network bright points at vertices of intergranular lanes. On the other hand, in strong field regions (B ![]() 500 G) the magnetic field may fill the intergranular lanes, acting as rigid walls that force the connected downflows to extend much deeper than in the field-free case (Stein et al. 1992).
500 G) the magnetic field may fill the intergranular lanes, acting as rigid walls that force the connected downflows to extend much deeper than in the field-free case (Stein et al. 1992).
The photospheric flux elements are driven by granulation flows which push the elements into the intergranular lanes. Berger et al. (1998) used local correlation tracking (LCT) to derive horizontal flow fields from a time series of granulation intensity images. A disadvantage of this LCT technique is that it is insensitive to stationary flows, and therefore cannot detect the more or less steady flow of plasma from the centers of granules to the intergranular lanes. LCT can detect such flows only if they are very fragmented and the spatial resolution is sufficient to resolve the fragments as they are advected from the center of the granule to the boundary. In this paper we use a different technique, which does not require the presence of such fine-scale structures.
We develop a two-dimensional model of the granulation flow velocity ![]() [vx(x, y, t), vy(x, y, t)] at a fixed geometrical height just below the photosphere. The model is based on the assumption that the vertical component of vorticity is small, so that the velocity can be approximated by
[vx(x, y, t), vy(x, y, t)] at a fixed geometrical height just below the photosphere. The model is based on the assumption that the vertical component of vorticity is small, so that the velocity can be approximated by

where ![]() (x, y, t) is the flow potential. We assume that
(x, y, t) is the flow potential. We assume that ![]() (x, y, t) is well correlated with the emergent intensity Iconv(x, y, t) as defined in equation (2). The quantity
(x, y, t) is well correlated with the emergent intensity Iconv(x, y, t) as defined in equation (2). The quantity ![]() is positive in the bright granules and negative in the dark intergranular lanes; hence, -
is positive in the bright granules and negative in the dark intergranular lanes; hence, -![]()
![]() represents the radial outflow from the cell centers to the lanes. The acceleration of the plasma is given by:
represents the radial outflow from the cell centers to the lanes. The acceleration of the plasma is given by:

where T(x, y, t) represents the temperature, ![]() is the turbulent viscosity (
is the turbulent viscosity (![]() = 70 km2 s-1), and the third "frictional" term describes the decay of the granular velocity after a granule has disappeared from the temperature field (decay time
= 70 km2 s-1), and the third "frictional" term describes the decay of the granular velocity after a granule has disappeared from the temperature field (decay time ![]() f = 300 s). The observed intensity emerges from a surface layer that is not flat but lies at a larger geometrical height in the granules than in the lanes. Since the height difference is only a few tens of kilometers, we assume that the surface temperature and the temperature at constant height are closely correlated, so that the latter can be approximated as T(x, y, t)
f = 300 s). The observed intensity emerges from a surface layer that is not flat but lies at a larger geometrical height in the granules than in the lanes. Since the height difference is only a few tens of kilometers, we assume that the surface temperature and the temperature at constant height are closely correlated, so that the latter can be approximated as T(x, y, t) ![]() c1Iconv(x, y, t), where c1 is a proportionality constant. Inserting this into equation (6) and using equation (5), we obtain
c1Iconv(x, y, t), where c1 is a proportionality constant. Inserting this into equation (6) and using equation (5), we obtain

where the constant is chosen such that the average of ![]() over the image vanishes at all times. The constant c1 is determined by comparing the computed flow velocities with those found in the three-dimensional granulation simulations of Stein & Nordlund (1994). At a depth of 40 km in Stein & Nordlund's model, the irrotational component of horizontal velocity (i.e., after removal of vortical flows) has an rms value vx,rms
over the image vanishes at all times. The constant c1 is determined by comparing the computed flow velocities with those found in the three-dimensional granulation simulations of Stein & Nordlund (1994). At a depth of 40 km in Stein & Nordlund's model, the irrotational component of horizontal velocity (i.e., after removal of vortical flows) has an rms value vx,rms ![]() vy,rms
vy,rms ![]() 1.60 km s-1. We adjusted c1 to obtain essentially the same value in the present model.
1.60 km s-1. We adjusted c1 to obtain essentially the same value in the present model.
Figure 4 shows the velocity in a subarea of frame 40 as computed with the above two-dimensional model. Note that the velocity changes rapidly across the intergranular lanes. To illustrate this effect more clearly, Figure 5a shows the divergence of the velocity field for the full frame: the bright regions correspond to diverging upflows (granules), and the dark regions correspond to converging downflows (intergranular lanes). Note that the lanes are quite narrow; their width w is much smaller than the size of the granules. In our model this width is controlled by the "viscosity" parameter ![]() , and is given by w
, and is given by w ![]()
![]() /v0, where v0 is the velocity of the converging flows on either side of the lane (typically, v0
/v0, where v0 is the velocity of the converging flows on either side of the lane (typically, v0 ![]() 2 km s-1). With
2 km s-1). With ![]() = 70 km2 s-1, we predict w
= 70 km2 s-1, we predict w ![]() 35 km, but because of the numerical diffusion, the lanes in our model are actually somewhat wider, w = 100 km. For comparison, Figure 5b shows the divergence of the horizontal velocity at a depth of 40 km as derived from the more realistic three-dimensional simulations of Stein & Nordlund (1994). The results are displayed on the same spatial scale and resolution as the La Palma data. Note that the widths of the lanes in Figures 5a and 5b are quite similar. However, these figures also show some important differences, in particular the presence of small regions of converging flow at the edges of granules in the three-dimensional simulations. For a detailed discussion of such three-dimensional simulation results, see Stein & Nordlund (1998).
35 km, but because of the numerical diffusion, the lanes in our model are actually somewhat wider, w = 100 km. For comparison, Figure 5b shows the divergence of the horizontal velocity at a depth of 40 km as derived from the more realistic three-dimensional simulations of Stein & Nordlund (1994). The results are displayed on the same spatial scale and resolution as the La Palma data. Note that the widths of the lanes in Figures 5a and 5b are quite similar. However, these figures also show some important differences, in particular the presence of small regions of converging flow at the edges of granules in the three-dimensional simulations. For a detailed discussion of such three-dimensional simulation results, see Stein & Nordlund (1998).
 Fig. 4
  Fig. 5
We use the above granulation flow field to simulate the horizontal motions of magnetic elements in the photosphere. The magnetic field is modeled as a collection of cylindrical flux tubes that stand vertically in the solar atmosphere, each having a radius of r0 = 60 km. Each flux tube is a rigid structure that is passively advected by the granulation flow, i.e., we neglect the possible effects of the anchoring of the flux tubes at larger depth. The rigidity of the flux tubes simulates the fact that the magnetic field strength B cannot exceed the value for equipartition of the magnetic pressure with the external gas pressure in the lower photosphere. Assuming B = 1500 G and r0 = 60 km, each flux tube has a magnetic flux of 1.7 × 10¹⁷ Mx. The flux tubes behave like rigid corks that float on the granulation flow; converging flows produce densely packed cork clusters that repesent larger magnetic elements with shapes determined by the flow. The motions of 1400 corks are followed from frame 3 to frame 177, which corresponds to about 7 granulation lifetimes. The procedure for dealing with overlapping corks is the same as in § 3, and the initial positions of the corks are also the same, i.e., the corks are initially located at the positions of the bright points. However, in the present case we do not replace corks as they move away from the bright points; all 1400 corks keep their identity for the full duration of the simulation.
Figure 6 shows the cork positions for frames 40 and 177 superposed on the corresponding convective intensity patterns. Note that the corks collect predominantly in clusters at the vertices where several intergranular lanes intersect. Linear structures extend from the clusters out into the intergranular lanes. This is due to the narrow width of the velocity lanes, which prevents the corks from all collecting at the vertex points. In contrast, in models with broader lanes (not shown), most of the magnetic elements collect in a few large clusters. Although the present model does not reproduce the exact locations of all bright points in the final frame, the qualitative agreement between observed and predicted patterns is quite good (compare Figs. 6 and 2). In particular, the model shows linear structures similar to the observed filigree.
 Fig. 6
The magnetic flux tubes on the Sun expand with increasing height in the photosphere, and above some height the neighboring flux tubes merge to fill the available volume. This merging of the flux tubes generally occurs in the chromosphere at a height of about 1000 km or less (depending on the horizontal distance between the flux tubes). Since the magnetic field is nearly "frozen into" the plasma, the horizontal motions of the photospheric flux tubes induce plasma flows in the chromosphere and above. One expects transverse MHD waves to be excited in the flux tubes by granular buffeting and sudden footpoint motions, and these waves may grow to considerable amplitudes higher up in the chromosphere.
In this section, we use potential-field modeling to compute the velocity of the field lines in a quasi-statically evolving field configuration, i.e., we neglect the effect of the MHD waves. We assume that the magnetic field is embedded in a massless ideal plasma; this allows us to use the MHD equations to compute the velocity field. The model assumes that the magnetic field inside the flux tubes can be approximated as a potential field from the discrete point sources;

The sources are located at depth d0 = 160 km below the photosphere, and their horizontal coordinates xk(t) and yk(t) are functions of time. All sources have the same strength and polarity. To obtain a well-defined canopy height, we assume that each source is the sum of a monopole and a vertically oriented dipole:

where Rk ![]() [(x - xk)2 + (y - yk)2 + (z + d0)2]1/2 is the distance to a source, and a0 is a parameter that determines the ratio of monopole and dipole strengths. Using equation (11), one can show that the magnetic field from a single source has a set of field lines that emerge from the source and become horizontal at large distances, reaching a height, z = a0. We identify these field lines with a magnetic canopy that forms the boundary between the flux tube and its surroundings. In the present paper we use a canopy height a0 = 1000 km.
[(x - xk)2 + (y - yk)2 + (z + d0)2]1/2 is the distance to a source, and a0 is a parameter that determines the ratio of monopole and dipole strengths. Using equation (11), one can show that the magnetic field from a single source has a set of field lines that emerge from the source and become horizontal at large distances, reaching a height, z = a0. We identify these field lines with a magnetic canopy that forms the boundary between the flux tube and its surroundings. In the present paper we use a canopy height a0 = 1000 km.
To obtain tubelike structures in a configuration with multiple sources, we trace magnetic field lines downward from a height h0 = 1500 km, i.e., well above the canopy height. We ignore the closed field lines (in between the flux tubes) that emerge from the sources but do not reach above the canopy height. This is equivalent to assuming that the flux tubes are embedded in a field-free photosphere.
The velocity field is computed as follows. The frozen-in condition implies  +
+ ![]()
 = 0, where (
 , t) is the field-line velocity and (, t) is the electric field. From Faraday's law, we obtain

where k(, t) is the induction electric field from a single source,

and k(t) ![]() dk/dt is the source velocity. Equation (12) implies that the electric field can be written in the form
dk/dt is the source velocity. Equation (12) implies that the electric field can be written in the form

where ![]() (, t) is an unknown scalar function. The frozen-in condition implies
(, t) is an unknown scalar function. The frozen-in condition implies ![]() = 0, which yields the following first-order partial differential equation for
= 0, which yields the following first-order partial differential equation for ![]() (, t):
(, t):

For simplicity, we take as a boundary condition ![]() (x, y, 0, t) = 0 at the photosphere. The right-hand side of equation (15) can be directly computed from the known positions and velocities of the magnetic sources; therefore, we can determine
(x, y, 0, t) = 0 at the photosphere. The right-hand side of equation (15) can be directly computed from the known positions and velocities of the magnetic sources; therefore, we can determine ![]() (, t) at an arbitrary point by numerically integrating equation (15) along the field line until we reach the photosphere, and then adjust
(, t) at an arbitrary point by numerically integrating equation (15) along the field line until we reach the photosphere, and then adjust ![]() along that field line in accordance with the boundary condition. To compute the electric field, we actually trace five neighboring field lines anchored in the same subphotospheric source, and then compute the partial derivatives
along that field line in accordance with the boundary condition. To compute the electric field, we actually trace five neighboring field lines anchored in the same subphotospheric source, and then compute the partial derivatives ![]()
![]() /
/![]() x and
x and ![]()
![]() /
/![]() y by numerical differentiation. This yields the horizontal components of the electric field, Ex and Ey, from equation (14); the vertical component is found using
y by numerical differentiation. This yields the horizontal components of the electric field, Ex and Ey, from equation (14); the vertical component is found using ![]() = 0. Finally, we compute the field-line velocity using =
= 0. Finally, we compute the field-line velocity using = ![]() /||2. Note that this velocity is by definition perpendicular to the magnetic field.
/||2. Note that this velocity is by definition perpendicular to the magnetic field.
To illustrate the method, we first consider the case with only two magnetic sources. The sources are located at (x1, y1) = (-1000, 0) km and (x2, y2) = (+1000, 0) km, so that there is a single magnetic null point located at a height z0 = 329 km above the midpoint between the two sources (x = y = 0). Figure 7 shows a perspective view of the magnetic field lines for this case. Note that the field lines in x < 0 are connected to source 1, while those in x > 0 are connected to source 2; the plane x = 0 is the separatrix surface between the two flux tubes. The field lines within this separatrix surface fan out more or less radially from the null point, i.e., the separatrix surface is a fan plane. Field lines that approach the null point along the x direction are diverted in all directions parallel to the fan plane.
 Fig. 7
Now assume that source 1 is moving with velocity 1 km s-1 in the -y direction, and source 2 is moving with the same velocity in the +y direction, i.e., perpendicular to the line connecting the two sources. Figure 8 shows the predicted chromospheric velocity at height 1500 km for this case. Note that the velocities directly above the sources are indeed about 1 km s-1, but as we approach the separatrix surface (x = 0), the magnitude of the velocity increases dramatically. Apparently, the movement of the flux tubes past each other produces large velocities near the separatrix plane. Simulations with higher resolution indicate that |vy| increases without bound as x ![]() 0. This effect is due to the three-dimensional geometry of the magnetic field near the null point; the motion of the magnetic sources causes field lines to sweep past the null point in the y-direction, producing rapid motion of field lines in the vicinity of the fan plane. In Appendix A we show that the functional dependence of the velocity near the separatrix surface is determined by the eigenvalues of the magnetic gradient tensor at the null point.
0. This effect is due to the three-dimensional geometry of the magnetic field near the null point; the motion of the magnetic sources causes field lines to sweep past the null point in the y-direction, producing rapid motion of field lines in the vicinity of the fan plane. In Appendix A we show that the functional dependence of the velocity near the separatrix surface is determined by the eigenvalues of the magnetic gradient tensor at the null point.
 Fig. 8
In the present model, we assume for simplicity that ![]() (x, y, 0, t) = 0, which implies that the flux tubes exhibit no rotational motion about their vertical axes. As two neighboring flux tubes move relative to each other, the line connecting the two flux tubes rotates with time, but this rotation is not compensated by a corresponding rotation of the individual flux tubes. This leads to enhanced velocities at the separatrix surface, as discussed above. Of course, if the flux tubes were to rotate at the same rate as their relative motion, then the chromospheric velocity enhancement at the separatrix plane would not occur. Hence, if there are only two flux tubes, it is possible to avoid such velocity enhancements by a suitable choice of rotation rates for the individual flux tubes. However, on the Sun there are multiple flux tubes that randomly move among each other. Each flux tube has several neighbors, and the different lines connecting a flux tube with its neighbors generally rotate at different rates. Therefore, in general it is not possible to eliminate all chromospheric velocity enhancements by suitable choice of the flux tube's rotation rate.
(x, y, 0, t) = 0, which implies that the flux tubes exhibit no rotational motion about their vertical axes. As two neighboring flux tubes move relative to each other, the line connecting the two flux tubes rotates with time, but this rotation is not compensated by a corresponding rotation of the individual flux tubes. This leads to enhanced velocities at the separatrix surface, as discussed above. Of course, if the flux tubes were to rotate at the same rate as their relative motion, then the chromospheric velocity enhancement at the separatrix plane would not occur. Hence, if there are only two flux tubes, it is possible to avoid such velocity enhancements by a suitable choice of rotation rates for the individual flux tubes. However, on the Sun there are multiple flux tubes that randomly move among each other. Each flux tube has several neighbors, and the different lines connecting a flux tube with its neighbors generally rotate at different rates. Therefore, in general it is not possible to eliminate all chromospheric velocity enhancements by suitable choice of the flux tube's rotation rate.
We now use the above method to predict the magnetic field and velocity field above the observed network region. The positions of the magnetic sources are taken from the simulation given in § 4. Figure 9 shows a perspective view of field lines for a small area in frame 40. The horizontal size of the region is 3000 km, and its location within frame 40 is indicated by the white box in Figure 6a. Note that each field line can be traced to a particular cork at z = 0.
 Fig. 9
Figure 10a shows the horizontal component of velocity in the chromosphere (h0 = 1500 km) as computed with the above method. Figure 10b shows the boundaries between different flux tubes at this height, i.e., each domain is connected to one particular cork at z = 0. Note that the predicted chromospheric velocities are several km s-1, much larger than the assumed velocities of the magnetic sources below the photosphere. This amplification is partly due to the spreading of the flux tubes with height, which enhances the rotational motion of neighboring flux tubes around each other (van Ballegooijen 1986). However, Figure 10b shows that the largest velocities occur near separatrix surfaces where neighboring flux tubes slide past each other. Therefore, most of the effect is due to the magnetic null points, which enhance the velocities of field lines passing in their vicinity. In fact, in some regions the field-line velocities are so large that the plasma inertia cannot be neglected and the potential-field model breaks down. Clearly, to obtain an accurate description of such flows a more realistic MHD model of interacting flux tubes is needed.
 Fig. 10
The simulations in § 4 show that the observed velocities and spatial distribution of the G-band bright points are consistent with passive advection by the solar granulation flow; we find no evidence for deep-seated flows other than the inferred granulation flow. This may be because the time sequence used here is too short to detect the effects of such deep-seated flows. Alternatively, the subsurface flux tubes may be subject to continual stretching and bending by these flows without any immediate consequences for the motions of magnetic elements at the visible surface.
To reproduce the observed "filigree" structures, we had to take into account that the photospheric flux elements are nearly incompressible (B ![]() 1500 G) and that the intergranular lanes are very narrow (w
1500 G) and that the intergranular lanes are very narrow (w ![]() 100 km). In contrast, in models with broader lanes, most of the magnetic elements collect in a few large clusters at the vertices where several lanes intersect. Therefore, the observed filigree structures provide indirect evidence for the existence of narrow intergranular lanes with widths
100 km). In contrast, in models with broader lanes, most of the magnetic elements collect in a few large clusters at the vertices where several lanes intersect. Therefore, the observed filigree structures provide indirect evidence for the existence of narrow intergranular lanes with widths ![]() 100 km. Note that the present granulation flow model is based on the observed granulation pattern, and therefore includes the effects of the magnetic field on the granulation flow (longer lifetime of granules, reduced cell size).
100 km. Note that the present granulation flow model is based on the observed granulation pattern, and therefore includes the effects of the magnetic field on the granulation flow (longer lifetime of granules, reduced cell size).
Three-dimensional models of solar convection (e.g., Stein & Nordlund 1994, 1998) show the presence of small-scale vortical flows within the intergranular lanes on scales ![]() 100 km. Such small-scale flows likely play an important role in breaking up the filigree into distinct magnetic elements, as is observed in high-resolution G-band images. Indeed, bright points sometimes exhibit rotational motions about each other (Berger & Title 1996). In the present paper, we neglected the vorticity of the granulation flow and its effects on the dynamics of flux tubes. The reason for this is that the observational data do not provide information about the vorticity of granulation flows on small spatial scales. Using correlation tracking, it is possible to measure vorticity on length scales of several granules (e.g., Wang et al. 1995), but such large-scale vorticity probably has little effect on the small-scale structure and dynamics of magnetic elements within the intergranular lanes. Clearly, future modeling of flux tube dynamics will need to take vortical flows into account, and work along these lines is in progress (Nordlund & Stein, in preparation). To measure small-scale vortical flows directly (other than by tracking magnetic elements) will require observations with higher spatial and temporal resolution than are presently available.
100 km. Such small-scale flows likely play an important role in breaking up the filigree into distinct magnetic elements, as is observed in high-resolution G-band images. Indeed, bright points sometimes exhibit rotational motions about each other (Berger & Title 1996). In the present paper, we neglected the vorticity of the granulation flow and its effects on the dynamics of flux tubes. The reason for this is that the observational data do not provide information about the vorticity of granulation flows on small spatial scales. Using correlation tracking, it is possible to measure vorticity on length scales of several granules (e.g., Wang et al. 1995), but such large-scale vorticity probably has little effect on the small-scale structure and dynamics of magnetic elements within the intergranular lanes. Clearly, future modeling of flux tube dynamics will need to take vortical flows into account, and work along these lines is in progress (Nordlund & Stein, in preparation). To measure small-scale vortical flows directly (other than by tracking magnetic elements) will require observations with higher spatial and temporal resolution than are presently available.
How effective are the observed motions in generating MHD waves? In § 3 we show that the autocorrelation function of the bright point velocity is approximately given by

where ![]() 2
2 ![]() 0.12 km2 s-2 and
0.12 km2 s-2 and ![]() 0
0 ![]() 100 s. The velocity power spectrum is obtained by taking the Fourier transform of the autocorrelation function
100 s. The velocity power spectrum is obtained by taking the Fourier transform of the autocorrelation function

Hence, most of the power is contained in frequencies ![]() <
<![]()

![]() 0.01 rad s-1. This is significantly less than the acoustic cutoff frequency in the photosphere, which is given by
0.01 rad s-1. This is significantly less than the acoustic cutoff frequency in the photosphere, which is given by ![]() ac = c/(2H)
ac = c/(2H) ![]() 0.03 rad s-1, where c
0.03 rad s-1, where c ![]() 7 km s-1 is the sound speed and H
7 km s-1 is the sound speed and H ![]() 115 km is the pressure scale height. Therefore, it is doubtful that the observed motions are very effective in generating longitudinal tubes waves, which are evanescent at these frequencies.
115 km is the pressure scale height. Therefore, it is doubtful that the observed motions are very effective in generating longitudinal tubes waves, which are evanescent at these frequencies.
A number of authors have proposed that the corona is heated by transverse tube waves (Hollweg 1984; Choudhuri, Auffret, & Priest 1993; Choudhuri et al. 1993). Muller et al. (1994) measure a mean speed of network bright points of 1.4 km s-1 and conclude that there is sufficient energy in these motions to heat the quiet corona. However, it is not clear that the observed velocity is entirely due to transverse waves; part of the mean velocity must be due to long-period motions that are not effective in generating transverse tube waves. The cutoff frequency for transverse tube waves is given by

where g is the acceleration of gravity, ![]() = 8
= 8![]() pi/B2 is the ratio of gas pressure and magnetic pressure, and the thin flux tube approximation has been used (Spruit 1981). Using
pi/B2 is the ratio of gas pressure and magnetic pressure, and the thin flux tube approximation has been used (Spruit 1981). Using ![]() = 0.3, we find
= 0.3, we find ![]() c = 0.0135 rad s-1. If we assume that only the high-frequency modes with |
c = 0.0135 rad s-1. If we assume that only the high-frequency modes with |![]() | >
| > ![]() c can generate transverse waves, then the amplitude of these waves is given by
c can generate transverse waves, then the amplitude of these waves is given by

which yields ut ![]() 0.18 km s-1. The energy flux in such waves is given by F=
0.18 km s-1. The energy flux in such waves is given by F=![]() u
u v
v , where
 ![]() is the mass density, and vA
is the mass density, and vA ![]() (4
(4![]()
![]() )1/2 is the Alfvén speed. Using
)1/2 is the Alfvén speed. Using ![]() = 7 × 10⁻⁸ gr cm-3 for the density within the tubes in the low photosphere, we find that the energy transported by these waves per unit magnetic flux is F/B=u[
= 7 × 10⁻⁸ gr cm-3 for the density within the tubes in the low photosphere, we find that the energy transported by these waves per unit magnetic flux is F/B=u[![]() /(4
/(4![]() )]
)] =2.3×10
 ergs cm-2 s-1 G-1. Hence, in plage regions with magnetic flux density
 ![]() 50 G, we expect a mean energy flux
50 G, we expect a mean energy flux ![]() 106 ergs cm-2 s-1. This is comparable to the observed radiative and conductive losses from the corona above plage regions (Withbroe & Noyes 1977).
106 ergs cm-2 s-1. This is comparable to the observed radiative and conductive losses from the corona above plage regions (Withbroe & Noyes 1977).
Extrapolations of magnetic and velocity fields to larger heights (see § 5) show that the chromospheric velocity can be locally much larger than the horizontal velocities of the flux tubes in the photosphere. This enhancement is due to the three-dimensional geometry of the flux tubes and the dynamics of field lines near magnetic null points where different flux tubes interact. This result may have important implications for models of coronal heating. First, the coronal heating rate varies as the square of the footpoint velocity; hence, the velocity enhancement found here could significantly increase the coronal heating rate. Second, the enhanced velocities are localized near separatrix surfaces, and therefore could affect the way in which electric currents build up at such surfaces (Glencross 1975, 1980; Démoulin & Priest 1997). Finally, the predicted chromospheric velocities are so large that plasma inertia cannot be neglected; quasi-static potential-field models cannot accurately describe the flows that occur where neighboring flux tubes interact. Clearly, to understand how magnetic energy is stored and dissipated in the corona, a more realistic dynamical model of interacting flux tubes is needed.
The observational data used in this study were kindly provided by R. A. Shine of Lockheed-Martin, and were obtained at the SVST, which is operated by the Swedish Royal Academy of Sciences at the Spanish Observatorio del Roque de los Muchados of the Instituto de Astrophysíca de Canarias (IAC). We thank T. E. Berger for many discussions regarding the data analysis, and the referee for useful suggestions which significantly improved the presentation. This work was supported by NASA grant NAGW-2545 to the Smithsonian Astrophysical Observatory.
We introduce a coordinate reference frame (x, y, z), with the origin located at a magnetic null point and the axes aligned with the eigenvectors of the magnetic gradient tensor, ![]() Bi/
Bi/![]() xj. Then, apart from a constant factor, the potential field near the null point can be written as
xj. Then, apart from a constant factor, the potential field near the null point can be written as

where a is a dimensionless parameter describing the ratio of x and y eigenvalues. We assume that a lies in the range 0 < a < 1, so that x = 0 is the fan plane. Now suppose that the plasma velocity is constant in time and is parallel to the fan plane, =v (x)
(x) . The induction equation
 ![]() × ( × ) = 0 yields dvy/dx = -avy(x)/x, which has the solution vy(x)
× ( × ) = 0 yields dvy/dx = -avy(x)/x, which has the solution vy(x) ![]() x-a. Since a > 0, the velocity |vy| increases without bound as we approach the fan plane (x
x-a. Since a > 0, the velocity |vy| increases without bound as we approach the fan plane (x ![]() 0). This singularity is not present in the two-dimensional case (a = 0).
0). This singularity is not present in the two-dimensional case (a = 0).
 Full image (268kb) | Discussion in text
 Full image (313kb) | Discussion in text
 Full image (39kb) | Discussion in text
 Full image (171kb) | Discussion in text
 Full image (310kb) | Discussion in text
 Full image (314kb) | Discussion in text
 Full image (79kb) | Discussion in text
 Full image (62kb) | Discussion in text
 Full image (80kb) | Discussion in text
 Full image (105kb) | Discussion in text