

Abstract
The world not only continues to build new coal-fired power plants, but built more new coal plants in the past decade than in any previous decade. Worldwide, an average of 89 gigawatts per year (GW yr–1) of new coal generating capacity was added between 2010 and 2012, 23 GW yr–1 more than in the 2000–2009 time period and 56 GW yr–1 more than in the 1990–1999 time period. Natural gas plants show a similar pattern. Assuming these plants operate for 40 years, the fossil-fuel burning plants built in 2012 will emit approximately 19 billion tons of CO2 (Gt CO2) over their lifetimes, versus 14 Gt CO2 actually emitted by all operating fossil fuel power plants in 2012. We find that total committed emissions related to the power sector are growing at a rate of about 4% per year, and reached 307 (with an estimated uncertainty of 192–439) Gt CO2 in 2012. These facts are not well known in the energy policy community, where annual emissions receive far more attention than future emissions related to new capital investments. This paper demonstrates the potential for 'commitment accounting' to inform public policy by quantifying future emissions implied by current investments.
Export citation and abstract BibTeX RIS

Content from this work may be used under the terms of the Creative Commons Attribution 3.0 licence. Any further distribution of this work must maintain attribution to the author(s) and the title of the work, journal citation and DOI.
1. Introduction
Each year, governments and firms estimate and report CO2 emissions from the burning of fossil fuels, and their efforts to slow climate change are measured against these annual emissions [1, 2]. Ultimately, though, the magnitude of warming we experience will not be determined by emissions in any one year, but by cumulative CO2 emissions [3, 4]. Thus, climate scientists and energy-economic modelers have developed hundreds of plausible scenarios of future emissions [5–7] and used them to identify emissions pathways that might achieve climate policy goals [8–10]. Such scenarios are powerful tools for connecting emissions and warming to trajectories of population growth, economic development, and energy use. However, these trajectories are constrained by tremendous socio-economic inertia (e.g., existing energy, transport and built infrastructures) that limits the rate at which CO2 emissions can be reduced and climate change avoided [11–15].
In 2010, Davis et al quantified an important component of socio-economic inertia by estimating the future emissions expected from all existing fossil fuel-burning infrastructure worldwide, naming these 'committed' emissions [16]. That paper provided a single data point (commitments as of 2009), but lacked the context perhaps most important to policymakers: how these committed emissions have changed over time. Here we provide that context. We show that, despite international efforts to reduce CO2 emissions, total remaining commitments in the global power sector have not declined in a single year since 1950 and are in fact growing rapidly (by an average of 4% per year 2000–2012).
The annual 'commitment accounting' that we demonstrate here offers policymakers an opportunity to evaluate historical trends and to quantify the long-term consequences of current actions in a new way. A focus on committed emissions allows decision makers and analysts to improve their representation of socio-economic inertia, carbon lock-in and the effects of political delay [12, 17–19]. We introduce a formalism to quantify future emissions associated with any new capital investments, and, as well, to consider early retirement, retrofit, and plant life extension.
The general principle of commitment accounting is shown schematically in figure 1. Two views are contrasted for the case where a new device, when built, is expected to run for five years and to emit one unit of CO2 each year. Today's carbon accounting would report annual emissions of one unit of CO2 in each of the five years of operation. Commitment accounting instead assigns all five units to the year when the device begins to operate (figure 1(a)). We call these anticipated emissions 'committed emissions' or simply 'commitments.' Figure 1(b) presents the same device three years after it begins to operate and shows (below the line) the initial commitments that have been realized as emissions and those that remain commitments. We depict realized and remaining commitments as negative numbers to reflect the fact that net commitments will be zero when fully realized.
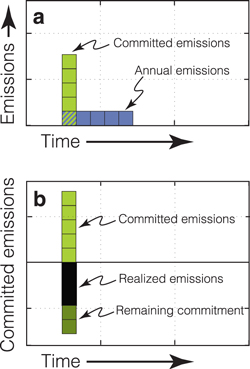
Figure 1. Schematic of committed emissions accounting. Emissions that occur over the lifetime of a fossil-fuel-burning electric generator are today routinely assigned to the year of emission ((a), blue blocks). In this paper, we present an alternate accounting, where the same emissions are instead recorded as committed emissions in the year the generator begins operating (i.e. online year; (a), green blocks). As time passes, it is possible to track the fraction of these committed emissions that have been realized and the fraction that remain committed, making adjustments if necessary to reflect early or late retirement of the generator (b). We show realized and remaining commitments as negative values because their sum exactly balances the initial commitment (b).
Download figure:
Standard image High-resolution image'Committed' does not mean inevitable. If the device in figure 1 was shut down after operating only four years, its remaining commitment would go to zero, and both committed and realized emissions would be shortened to four units in all subsequent representations. Conversely, if the device continued to operate after five years, both committed emissions and realized emissions would be increased by one unit each year until the device was retired. Commitment accounting assumes specific lifetimes of infrastructure, acknowledges that these may turn out to be overestimates or underestimates of actual lifetimes, and thus requires regular adjustment to reflect the best current information.
2. Materials and methods
Commitment accounting requires four pieces of information for each CO2-emitting device: (1) the year the device began operating, (2) the expected operating lifetime of the device, (3) the annual emissions from the device, and, (4) if the device is no longer operating, the year the device ceased operating.
Our analysis of power generators relies on two datasets for this information: The Platts World Electric Power Plant database [20] includes data about the year each generator came online and the year it retired. Version 3 of the Carbon Monitoring for Action (CARMA) database [21] contains information about annual power generation and CO2 emissions—not for generators but for power plants, and not every year but only for 2004 and 2009. Approximately 99% of plants in CARMA have corresponding generators in Platts.
We make the arbitrary assumption that CARMA's emissions and energy data for 2009 (or, occasionally, 2004) are an accurate estimate throughout a plant's lifetime (despite evidence to the contrary [22]). Until even more comprehensive data sources become available, commitment accounting will necessitate such assumptions.
2.1. Online year (year generator began operating)
Of 95 529 fossil-fuel generators included in the Platts database [20], the online year is available for 79 595, or 83%, of the generators. For an additional 12 275 generators, we assign an online year equal to the mean online year of all other generators for which an online year is provided in the Platts database (i) that operate in the same country, (ii) that burn the same fuel, and (iii) whose generating capacity is within 75 MW of its capacity. Thereby, our analysis creates an online year for 91 870 fossil-fuel generators, or 96% of those included in the Platts database. The remaining 4% are 'planned' or 'under construction' generators that were not yet in operation when the Platts data were published.
2.2. Expected lifetime
The most important assumption of commitment accounting is the expected lifetime of new generators. The decision to retire a generator or power plant is seldom prompted by physical failure of the equipment; rather, the decision is driven by economic considerations of operating costs, replacement costs, and revenues [14, 22–24]. The Platts database lists 13 026 fossil-fuel generators as 'retired,' about 14% of the total. Of these, the retirement year is available for only half of them (the retirement year is known for 6447 and not known for 6514). Moreover, of the 6447 generators with known retirement year, another 606 do not state the year they came on line. Rather than use the methodology to estimate online date described above, we simply exclude these retired generators as well. The data for the remaining 5841 generators with known online and retirement dates are our primary data source for choosing a reference lifetime.
Figure 2 shows these distributions of retirement age for generators fired by natural gas, oil and coal. Their median ages at retirement are remarkably similar: 37, 35, and 32 years, respectively. We explored these retirement data in detail and found no persuasive evidence of systematic differences or trends in relationships among fuel type, region, online year, generating capacity, and retirement year (figures S1 and S2), with the exception of the secondary detail of fuel type, where natural gas- and oil-fired generators were substantially more likely to be retired before operating 20 years than coal-fired generators (figure 2). We thus chose to simplify our demonstration of commitment accounting by using a single reference lifetime of 40 years for all generators regardless of differences in fuel type, region, online year, or generating capacity and performing a sensitivity analysis using lifetimes of 20, 30, 40, 50 and 60 years. Unless otherwise noted, the results reported here reflect a 40 year generator lifetime with a range of uncertainty corresponding to generator lifetimes of 30 and 50 years.
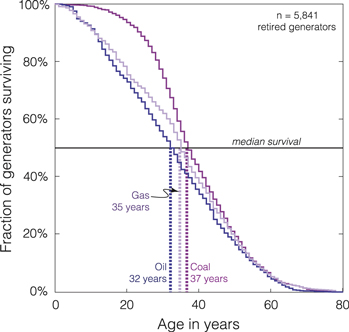
Figure 2. Historical survival of generators by fuel type. Plot shows the age at retirement of 5841 generators retired since 1971 by primary fuel type. Vertical dashed lines indicate the median age at retirement of generators for each fuel type. Early retirement happens more often for generators powered by gas or oil than for those powered by coal: 22% and 26% of the gas and oil generators, respectively, were retired before they had run for 20 years, but only 6% of coal generators.
Download figure:
Standard image High-resolution imageWhen we assume a reference lifetime for a retired plant whose retirement date is not in the Platts database, and this results in a retirement year later than 2012 (i.e. an obviously incorrect estimate given that the generator in question is known to be retired), we estimate the retirement date using the same methodology as in section 2.1 (same country, same fuel, similar capacity) and add the constraint of similar vintage (defined as an online year ±5 years). For an assumed generator lifetime of 40 years, roughly two thirds of the generators for which no retirement year is stated (4256 out of the 6514 generators) came on line after 1972 and hence required this adjustment.
2.3. Annual emissions
The CARMA database [21] contains data on electricity generated and CO2 emitted by each of 68 931 power plants for the years 2004 and 2009. We allocate the plant-level data of electricity generation and emissions data to individual generators in proportion to their nameplate generating capacity. We use 2009 emissions data unless only 2004 data exist (e.g., where a plant retired between 2004 and 2009).
Although annual emissions usually deteriorate over a generator's lifetime because it is run less often as its operating efficiency and economic competitiveness decline [22], we make the simplifying assumption that the CO2 emissions produced by each generator in 2009 (or 2004 if there are no 2009 data) is a good estimate throughout its period of operation, and thus we underestimate early emissions from any older generators that operated only occasionally in 2009. To the extent that annual emissions of older generators are underestimated, their contributions to committed emissions will also be underestimated. As a check of our method, we compare a time series of annual global emissions from our model to a time series of emissions from power plants provided by the International Energy Agency (IEA) for the years 1971–2011 [25] (figures S3). Our estimates are within 42% of the IEA data over the period prior to 1975, within 29% of IEA data from 1975–1985, and within 9% of IEA data from 1985–2011.
If no emissions data are available from CARMA (e.g., because a plant retired before 2004), we estimate emissions and electricity generation according to the nameplate capacity of the generator (from the Platts database) and the mean capacity factor (MWh electricity generated per MW capacity) and emissions factor (kg CO2 per MWh) of all other generators (i) in the same country, (ii) burning the same fuel, and (iii) with similar generating capacity (defined as a nameplate capacity ±75 MW). In 32 cases (0.03%), our method yields carbon intensities that are too low to be credible for the fossil fuel being burned; we use lower limits of 800 kg CO2/MWh for coal, 700 kg CO2/MWh for oil, and 490 kg CO2/MWh for gas. In these cases, we assume the reported electricity production is correct and estimate CO2 emissions using the global average carbon intensity for generators burning that type of fuel. Figures S4 and S5 show that there are no obvious relationships between emissions intensity (kg CO2/MWh) and online year and nameplate capacity, respectively.
According to the CARMA database, coal plants built worldwide 2000–2012 on average emit 1090 kg CO2 per MWh and have a capacity factor of 44%, weighted by generating capacity. Assuming a 40 year lifetime, the average committed emissions are 167 Mt CO2 per GW of coal-fired generating capacity. The corresponding values for natural gas are 659 kg CO2 per MWh and 35% capacity factor, leading to 83 Mt CO2 of committed emissions per GW of gas-fired generating capacity. In other words, roughly, every 6 GW of new coal-fired capacity has been committing the world to 1 Gt CO2 of emissions, and so has every 12 GW of gas-fired capacity.
3. Results
3.1. Committed emissions in 2012
Figure 3(a) shows commitment accounting (see figure 1) for the global power sector, which was the source of 40% of global fossil-fuel emissions in 2011 [25, 26]. The point of view is from 2012, a 40 year lifetime is assumed for all generators, and all fossil fuel-fired electricity-generating units ('generators') that were built globally between 1950 and 2012 are included. Global committed emissions from these generators total 629 (508–761) Gt CO2 (light green area; only the central estimate reflecting a 40 year lifetime is shown), of which 322 Gt CO2 were realized emissions by 2012 (black area), and 307 (192–439) Gt CO2 were remaining commitments as of 2012 (dark green area).
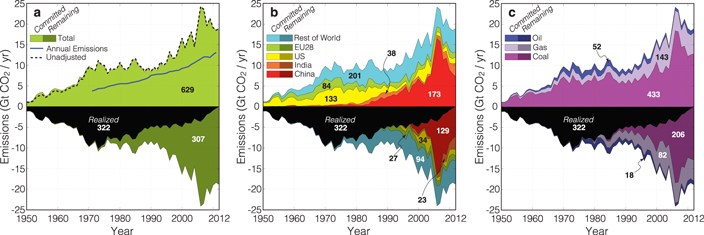
Figure 3. Commitment accounting of electric generators installed between 1950 and 2012. From the perspective of 2012, contributions to committed emissions ((a), light green area) grew from approximately 4 Gt CO2 per year in 1960 to roughly 10 Gt CO2 per year between 1970–1995, and then to more than 14 Gt CO2 per year since 2000. Throughout this period, annual commitments have exceeded annual emissions (blue curve in (a) shows IEA estimates of emissions from the power sector 1971–2011 [25]). Although the commitments made 30–40 years ago have largely been realized (black), a large proportion of commitments made since 1990 remain ((a), darker green area). The geography of committed emissions (b) has shifted from the US and Europe in 1970s and 1980s to China since 1990, but coal-fired power has consistently been the dominant source of committed emissions (c). Numbers on the plot indicate total committed emissions and those remaining committed as of 2012 in Gt CO2.
Download figure:
Standard image High-resolution imageThe error estimates in parentheses here are for assumed lifetimes of 30 and 50 years, presented in table 1 (along with the results of assuming lifetimes of 20 and 60 years). Thus, the range of estimated remaining commitments in 2012 (192–439 Gt CO2) assigns an uncertainty of 40% to our central estimate of 307 Gt CO2. This estimate and its uncertainty are generally consistent with the remaining commitment from the power sector reported in Davis et al for 2009 (a central estimate of 224 Gt CO2 and an uncertainty range from 127–336 GtCO2). Davis et al used somewhat shorter reference lifetimes of 39, 36, and 34 years for coal, gas, and oil plants, respectively. Its error estimates, like those in this paper, were based on lifetime corrections of ±10 years in each case.
Table 1. Remaining committed emissions (Gt CO2) from power infrastructure varies under different assumptions of generator lifetime. 'Adjustments' indicate the aggregate revisions in commitments necessary to accommodate generators that operated fewer or more years than the assumed lifetime over the entire period 1950–2012.
| Country/region | 20 Year lifetime | 30 Year lifetime | 40 Year lifetime | 50 Year lifetime | 60 Year lifetime |
|---|---|---|---|---|---|
| By fuel | |||||
| Coal | 66.2 | 128.3 | 206.1 | 295.7 | 390.3 |
| Gas | 27.0 | 53.0 | 82.3 | 114.2 | 147.5 |
| Oil | 4.9 | 10.2 | 18.2 | 28.1 | 38.7 |
| By region | |||||
| China | 47.7 | 87.7 | 129.2 | 170.8 | 212.4 |
| India | 7.4 | 14.5 | 23.1 | 32.1 | 41.3 |
| US | 8.3 | 17.5 | 33.8 | 57.4 | 83.8 |
| EU28a | 7.7 | 15.9 | 26.6 | 40.2 | 55.6 |
| Rest of world | 27.1 | 56.1 | 94.2 | 138.1 | 184.4 |
| Total | 98.2 | 191.7 | 306.9 | 438.6 | 577.5 |
| Adjustments | |||||
| Generators retired late | 98.3 | 42.9 | 12.6 | 2.6 | 0.2 |
| Generators retired early | 0.6 | 2.5 | 7.1 | 14.6 | 23.4 |
aEU28 region includes: Austria, Belgium, Bulgaria, Croatia, Cyprus, Czech Republic, Denmark, Estonia, Finland, France, Germany, Greece, Hungary, Ireland, Italy, Latvia, Lithuania, Luxembourg, Malta, Netherlands, Poland, Portugal, Romania, Slovakia, Spain, Sweden, England & Wales, Scotland, and Northern Ireland.
Embedded in the calculations of remaining commitments in figure 3(a) is the assumption that all generators older than 40 years in 2012 will be shut down immediately. Table S2 shows the consequences of instead allowing all plants to run an additional five to ten years (to 2017 or 2022, respectively), for all five assumed lifetimes. For example, assuming a 40 year lifetime, each five years that overage generators are allowed to continue running causes the remaining global commitment to increase by 7 Gt CO2 (table S2).
The black dashed line in figure 3(a) indicates the magnitude of adjustments that were made to accommodate generators that retired either before operating 40 years or after operating more than 40 years (see figures S1 and S2 for further analysis of retirements). This line can barely be distinguished from the top of the light green area because, even in aggregate, these adjustments are small: a 7 Gt CO2 reduction for early retirements and a 13 Gt CO2 addition for life extension. However, larger adjustments are necessary when assumed reference lifetimes are substantially different from 40 years (see 'adjustments' in tables 1 and S2).
As seen in figure 3(a), annual contributions to the total of 629 Gt CO2 of committed emissions accumulated as of 2012 rose from approximately 4 Gt CO2 yr–1 in 1960 to ∼9 Gt CO2 yr–1 between 1970 and 2000, before ramping steeply to more than 14 Gt CO2 yr–1 since 2000. In comparison, the International Energy Agency (IEA) estimates for annual emissions from the global power sector are consistently less than these annual commitments; the IEA estimates rise nearly linearly from 3.7 Gt CO2 yr–1 in 1971 to 13.1 Gt CO2 yr–1 in 2011 [25] (figure 3(a), blue curve) [25].
Figure 3(b) decomposes the global totals from figure 3(a) into world regions, and figure 3(c) does the same for fuels. Among the stories figure 3(b) tells are the expansion of power infrastructure in the US and the EU during the 1960s and 1970s, the 'race to gas' in the US between 2000 and 2005, and the rapid construction of generators in China beginning in the mid-1990s [27, 28]. China's infrastructure represents 129 (89–171) Gt CO2, or 42% (46%–39%) of the total remaining commitments in 2012 (figure 3(b)). Less anticipated, India's remaining commitments from power-plant emissions in 2012 are approximately equal to those of the EU and the US: all three are between 23 and 34 Gt CO2 (or between 15–18 and 32–57 Gt CO2 assuming generator lifetimes of 30 and 50 years, respectively). Figure 3(b) also reminds us that a focus on the foursome of China, India, the EU and the US can be overdone: remaining committed emissions from the rest of the world (ROW) are 31% (29%–31%) of the global total in 2012. Ten countries represent 56% of remaining committed emissions from the ROW region in 2012: Japan, South Korea, Russia, Saudi Arabia, Indonesia, Australia, Taiwan, Iran, Mexico and Turkey (figure S6). Not shown, the central estimates (40 year lifetime) of ROW commitments represent 17% and 53% of all remaining committed emissions in 2012 from coal generators and oil and gas generators worldwide, respectively (see table S1).
Of the 307 (192–439) Gt CO2 of remaining committed emissions as of 2012, figure 3(c) shows that coal-fired generators represent 206 (128–296) Gt CO2, or 67% of the total. Not shown, China's remaining commitments are 98% from coal (see table S1). Over half of the world's remaining committed emissions from oil- and gas-fired generators are in the ROW region (59 of 100 Gt CO2, 40 year lifetime, see table S1).
Figure 4 extends figure 3(a) into the future, showing when the remaining committed emissions in 2012 are expected to occur, for various generator lifetimes.
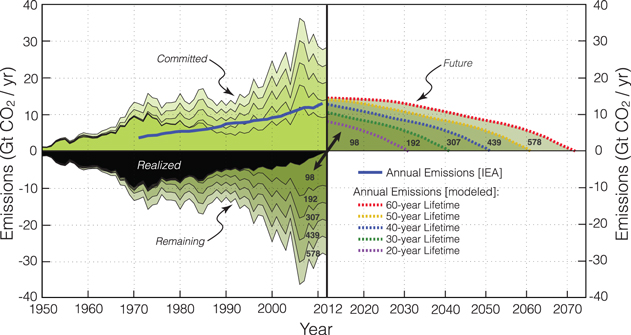
Figure 4. Annual committed emissions and future emissions from primary power infrastructure under different assumed generator lifetimes. In comparison to figure 3, here we show committed emissions (light green) for five different values of the generator lifetime (20, 30, 40, 50 and 60 years). For all five cases, we also project remaining commitments as annual emissions in the future (dashed lines). Realized commitments do not change under the different lifetime assumptions (black), but remaining commitments grow from 98 Gt CO2 if generators retire after 20 years to 578 Gt CO2 if the same generators instead operate 60 years. Also shown are the same IEA estimates [25] of actual global power plant emissions as in figure 3(a) (solid blue line).
Download figure:
Standard image High-resolution image3.2. Trends in commitments
Thus far, we have restricted the analysis to a single year (the most recent year with available data, 2012)—effectively updating the analysis Davis et al presented for 2009 [16]. Much can be learned, however, from producing the corresponding analysis for earlier years and examining trends, a line of argument not investigated in Davis et al. In figure 5, we show the results of repeating the committed emissions analysis for each year from 1950 through 2012 and assuming a 40-year generator lifetime. Figure 5 has six panels: we present the remaining committed emissions by year, the change each year, and the dimensionless ratio which is the change each year divided by the actual emissions that year; we show a decomposition for all three cases both by region of the world and by fuel.
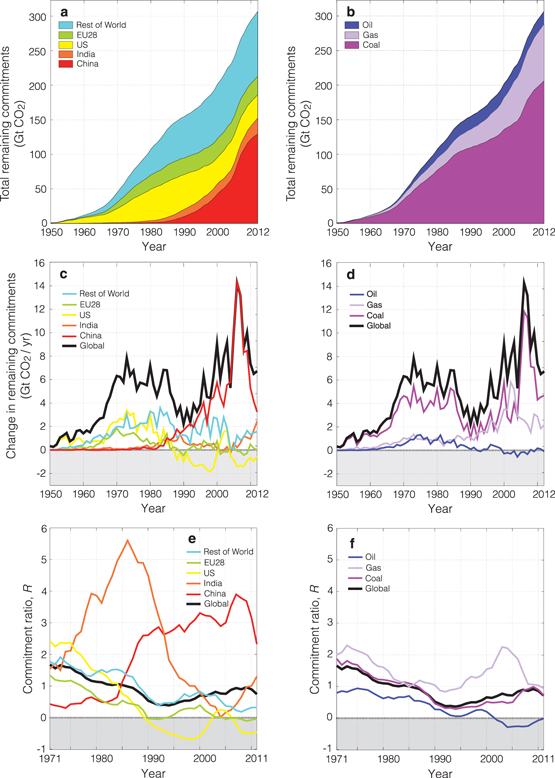
Figure 5. Changes in remaining commitments. Total remaining committed emissions of power generators built worldwide since 1950 increased from near zero in 1950 to 307 Gt CO2 in 2012, driven by coal-fired generators (b) built in the US and Europe during the 1970s and 1980s, and in China, India and the rest of the world beginning about 1985 (a). Annual increases in remaining global commitments hovered around 6 Gt CO2 per year in the 1970s and 1980s, dipped to a minimum of 2.2 Gt CO2 per year in 1990, then rose sharply between 1994 and 2006, and declined again between 2006 and 2012 (c) and (d). Panels (e) and (f) show the commitment ratio, R, of annual changes in remaining commitments to annual emissions (here calculated using five-year running averages for both). Since 1994, the ratio shows recarbonization of the global power sector despite the steady state of commitments in Europe and decarbonization in the US (e).
Download figure:
Standard image High-resolution image
The first pair of panels, figures 5(a) and (b), plot total remaining commitments for each year 1950–2012. The 2012 endpoint of these plots is the same value, 307 Gt CO2, as the total remaining emissions for 2012 shown in figure 3. But whereas figure 3 decomposes the committed emissions by the year in which the generators which contribute to these commitments came on line, figure 5 suppresses the year in which any particular generator came on line, and instead the time axis shows the year for which the total remaining committed emissions are calculated.
There has been a monotonic increase in global remaining commitments over time, from near zero in 1950 to 107 Gt CO2 in 1980 and 307 Gt CO2 in 2012 (data on generators built prior to 1950 are incomplete). Regional disaggregation (figure 5(a)) reveals that prior to about 1985, most remaining commitments were associated with generators operating in the US and Europe. But in the years since, remaining commitments increasingly reflect new generators in China, India and the rest of the world, with the US and EU28 accounting for less than 20% of total remaining commitments in 2012. Disaggregation by fuel (figure 5(b)) shows that remaining commitments have always been dominated by coal-fired generators, but the contribution of natural gas-fired generators increased nearly five-fold between 1980 and 2012: from 17 Gt CO2 in 1980 to 82 Gt CO2 (27% of all remaining commitments) in 2012.
Figures 5(c) and (d) show annual changes in remaining commitments (i.e. the derivative with respect to time of the curves in figures 5(a) and (b)) by region and fuel, respectively. The rate of increase of global remaining commitments was approximately 6 Gt CO2 per year throughout the 1970s and 1980s, driven by coal-fired generators (figure 5(d)) being installed in the US and Europe (figure 5(c)). Construction in the US and Europe slowed in the late 1980s, and the rate of increase of global remaining commitments reached a minimum of 2.0 Gt CO2 per year in 1992 (figure 5(c)). Between 1990 and 2012, in spite of a rate of change in remaining commitments that averaged −0.8 Gt CO2 per year in the US and 0.1 Gt CO2 per year in Europe, the rate of increase of remaining global commitments averaged 6.5 Gt CO2 per year. The message of the most recent data is that China is 'passing the torch' to other industrializing countries: averaged over the most recent three years of our data (2010–2012), the global rate of increase in committed emissions was 7.7 Gt CO2 yr–1. After peaking at an average of 13.7 Gt CO2 yr–1 in 2005–2006, the rate of increasing commitments in China has fallen to 5.3 Gt CO2 yr–1 and the combined value for India and the rest of the world has risen to 3.0 Gt CO2 yr–1, influenced especially by the rapid expansion of generators in places like Indonesia, Russia, Saudi Arabia and Iran (see figure S6 and table S3 for a comprehensive list of remaining CO2 commitments from oil, gas, and coal generators in 233 individual countries). Note that the boom of natural gas in the US [29] is visible as a roughly five-year surge in both US commitments (figure 5(c)) and gas commitments (figure 5(d)) beginning about 1998. Except for this brief spike, remaining commitments in the US have declined from the late 1980s through 2012 (figure 5(c)). In comparison, new commitments in Europe have been less variable, and remaining committed emissions have seldom decreased over the entire period 1950–2012 (figure 5(a) and (c)).
The year-on-year increases in remaining commitments can be compared systematically with actual annual emissions by examining their ratio, R, where,

Here Cnew are new commitments in a given year, Clate are additional commitments in that year related to generators that continue to operate after their expected retirement age, Creal are realized commitments in that year (i.e. annual emissions), and Cearly are commitments in that year related to generators that are shut down before their expected retirement age. The numerator of equation (1) is graphed already in figures 5(c) and (d). Dividing by new commitments in that year creates a useful dimensionless 'commitment ratio,' R, which is plotted in figures 5(e) and (f). Trends in R say much about evolution of the stock of power plants. If no new emitting infrastructure is built and all generators retire at the assumed reference year (the case considered by Davis et al [16]), R is sustained at −1, as total remaining commitments decrease in step with previously committed emissions being realized. An R of 0 is obtained for a 'steady state' where increases in remaining commitments are exactly offset by realized emissions. An energy system that is phasing-out fossil-fuel infrastructure and transitioning to carbon-emissions-free energy technologies, will maintain an R less than 0 over decades, just as an energy system with an expanding fossil-fuel infrastructure will maintain an R greater than 0.
Figures 5(e) and (f) plot the commitment ratio, R, using a five-year running average for both numerator and denominator. The global value of R was positive during the entire period 1971–2011 (because total remaining commitments have never decreased). R followed a V-shaped path in those years, decreasing from 1.7 in 1971 to a minimum of 0.4 in 1994 and then back up to 0.8 in 2011 (black curve in figure 5(e)). The 2011 value of 0.8 can be calculated, from equation (1), as the consequence of five-year-average annual values for Cnew and Creal of 21 Gt CO2 and 12 Gt CO2, respectively. (Global values of Cnew and Creal are graphed as 'committed' and 'annual emissions' in figure 3(a); values of Cearly and Clate are negligible).
Analysis of the regional data in figure 5(e) reveals that the 20-year average values of the commitment ratio, 1991–2011, are −0.3 for the US, 0.1 for the EU28, 1.2 for India and 3.1 for China (figure 5(e)). Across fuels (figure 5(f)), year-to-year changes in R in most years are driven by commitments of coal-fired infrastructure, but between 2000 and 2005 the R of coal generators leveled off at ∼0.5 and the R of gas generators spiked upward to more than 2. By 2011, the R of coal was 0.7 and the R of gas was 0.9. Between 2000 and 2011, committed emissions from oil-fired generators fell (few were built), producing negative values in figures 5(d) and (f).
4. Discussion and conclusions
Commitment accounting of CO2 emissions provides critical information about future emissions related to infrastructure that currently exists or might be built. Committed emissions from existing infrastructure can be readily compared to scenarios of future emissions such as those used by the IPCC. Assuming a 40 year lifetime of generators, our estimates of committed emissions from the power sector already represent 53%, 41% and 21% of the fossil-fuel CO2 emissions from all sectors in China, India, and the US, respectively, projected in RCP2.6 (the low-emissions Representative Concentration Pathway [30]) during the period 2013–2050 [31]. The estimated commitments are a smaller percentage of emissions in other, warmer RCPs, but RCP2.6 is the only RCP pathway that is likely to avoid exceeding 2 °C of warming relative to the pre-industrial period (i.e., to meet the current international climate target) [9, 32, 33].
With reference to what might be built, committed emissions can be teased out of energy scenarios, where in most cases the information is already embedded; once made explicit, these scenarios will become richer and easier to evaluate. For instance, we estimate that the 'New Policies' scenario in the IEA's World Energy Outlook 2013 entails new global commitments of roughly 5 Gt CO2 yr–1 of coal generators and 3 Gt CO2 yr–1 of gas generators between 2012 and 2020, while the '450 scenario' would require overall reductions in the commitments from existing coal-fired generators (−0.5 Gt CO2 yr–1 between 2012 and 2020, e.g., by early retirement or CCS retrofitting) and allow new commitments of ∼2 Gt CO2 yr–1 of gas generators over the same time period (assuming new generators with the lowest plausible carbon intensity given their fuel type) [24]. In comparison, figure 3(c) shows that gas generators brought online in 2012 represented ∼5 Gt CO2 of new commitments—roughly twice the level of commitments in the IEA scenarios. Detailed analysis of this sort might provide policymakers with practical, annual benchmarks for new emitting infrastructure that can be built under various mitigation scenarios. In turn, these benchmarks might directly inform regulatory decisions governing the permitting of new infrastructure where the objective is to reflect the climate implications that will materialize over many decades.
We have restricted our analysis of committed emissions to the power sector, which is probably the easiest sector to analyze: although the data requirements are formidable, they are tractable. In the transportation sector, the analysis will be similar at the level of committed emissions from vehicles: lifetimes are shorter and better known, but estimating vehicle-miles traveled is a challenge. For the buildings sector, lifetimes are longer and less well known; uncertainties associated with retrofitting and replacing the buildings stock will be large. Commitment accounting can also be applied in conceptually more difficult territory, such as town planning and the construction of supporting infrastructure such as roads, power lines, and pipelines [34].
Reducing CO2 emissions will ultimately mean retiring CO2-emitting infrastructure more quickly than it is built. However, trends have long pointed the other way: fossil power is expanding globally, and here we have shown that even the already substantial committed emissions of the power sector are increasing. By revealing the emissions that are anticipated decades into the future, commitment accounting of CO2 emissions may help to integrate analyses of capital investment, cumulative emissions, and damages from climate warming.
Acknowledgements
We thank David Hawkins for long-ago sharing his ideas about 'committed emissions' with R Socolow. We also thank Ken Caldeira, Felix Creutzig, Stéphane Hallegatte, Thomas Kreutz, Michael Levi, H Damon Matthews, Massimo Tavoni and two anonymous reviewers for insightful comments and suggestions.