
Abstract
In many discussions of climate change impacts in agriculture, the large magnitudes of expected impacts toward the end of the century are used to emphasize that most of the risks are to future generations. However, this perspective misses the important fact that demand growth for food is expected to be much slower after 2050 than before it, and that the next two decades represent the bulk of growth before 2050. Thus, impacts of smaller magnitude in the near-term can be as or more consequential for food prices or food security as larger magnitude impacts in the future. Here we estimate the risks that climate trends over the next 10 or 20 years could have large impacts on global yields of wheat and maize, with a focus on scenarios that would cut the expected rates of yield gains in half. We find that because of global warming, the chance of climate trends over a 20 year period causing a 10% yield loss has increased from a less than 1 in 200 chance arising from internal climate variability alone, to a 1 in 10 chance for maize and 1 in 20 chance for wheat. Estimated risks for maize are higher because of a greater geographic concentration than wheat, as well as a slightly more negative aggregate temperature sensitivity. Global warming has also greatly increased the chance of climate trends large enough to halve yield trends over a 10 year period, with a roughly 1 in 4 chance for maize and 1 in 6 chance for wheat. Estimated risks are slightly larger when using climate projections from a large ensemble of a single climate model that more fully explores internal climate variability, than a multi-model ensemble that more fully explores model uncertainty. Although scenarios of climate impacts large enough to halve yield growth rates are still fairly unlikely, they may warrant consideration by institutions potentially affected by associated changes in international food prices.
Export citation and abstract BibTeX RIS

Content from this work may be used under the terms of the Creative Commons Attribution 3.0 licence. Any further distribution of this work must maintain attribution to the author(s) and the title of the work, journal citation and DOI.
Introduction
Global demand for crop production is virtually certain to rise over the next two decades as human population and per capita food consumption increase and crop-based biofuel production appears likely to expand [1–3]. The Food and Agriculture Organization of the United Nations estimates that global production for cereals will increase by 13% of current levels per decade up to 2030 [1], with estimates from some other studies considerably higher [2, 3]. All studies agree that rates of demand growth over the next 20 years will be larger than any subsequent period. Historically, rapid improvements in crop yields per hectare have allowed production to keep pace with demand without substantial cropland expansion [4]. Although global yields are still clearly increasing, there are some concerns that these growth rates could slow considerably in the next decades [5–8]. Some of these concerns relate to longstanding issues, such as the insufficiency of past research and development investments or potential emergence of virulent crop diseases [9, 10], yet others relate to relatively new factors such as the potential impacts of climate change.
Here we consider the risks of a large slowdown in crop yields driven by shifts in global climate over the next two decades. Although many studies have projected impacts of climate change on crop yields in different regions and globally [11, 12], these studies are commonly focused on the most likely outcomes. Our emphasis here is on the likelihood of scenarios that would represent a substantial shift in the growth rate of global cereal yields. Such information is especially useful to organizations that need to prepare for unlikely but plausible events that could have major implications for international stability and peace.
As discussed at length in papers addressing the apparent lack of warming in the decade following 1998, climate trends at a decadal time scale are primarily driven by internal variability in the climate system rather than anthropogenic global warming (AGW) [13–16]. In that sense, there has always been some chance that agricultural progress would be significantly slowed or aided by climate trends, and indeed there is evidence of many ancient societies being severely affected by rapid climate shifts. Yet over the past 50 years, agriculture's rapid productivity gains occurred against the backdrop of a fairly stable climate. Warming since 1980 did likely slow rates of wheat and maize yield growth, but by 1–2% per decade compared to overall growth rates above 10% per decade [17], and yield trends maintained a linear trend at the global scale.
Although the definition of a 'substantial' slowdown in yield growth is subjective, here we consider it to be any scenario where yield impacts of climate trends are more than 5% over a 10 year period, or 10% over a 20 year period. This would represent roughly half of the expected yield increases based on recent historical rates of increase (see figure S1 based on [18]), so that an impact of this size would be enough to roughly half rates of yield progress. We evaluate these risks for two major grain crops (wheat and maize) at the global scale. The risks for current climate (in the presence of AGW) are estimated using two different types of climate model simulation ensembles, a large ensemble (LE) of runs from NCAR CCSM3 [19] generated by varying only initial conditions, under the same scenario of external forcings (hereafter LE) and the CMIP5 multi-model ensemble [20] of runs under RCP8.5 (hereafter CMIP5). These scenarios are compared to a counterfactual climate without AGW (hereafter 'control' simulations), again from CCSM3, to assess how much the chances of yield shortfalls are increased as a result of AGW.
Methods
We use estimated empirical relationships between temperature and precipitation changes on the one hand and yield changes on the other. The approach we used follows previous work [21, 22] and is based on linear regression between first-differences of historical global crop yields (from FAO) and temperature and precipitation records (from HadCRU). First-differences are a simple yet effective approach to avoid the potential for bias in the regression from omitted variables such as technology trends, which vary more gradually than weather over time [22].
To update the model from previous work, we include weather and yield data up to 2012. To obtain a single global average of temperature and precipitation for each crop in each year, we first average the HadCRU data in each cell based on the cell-specific growing season months (based on [23]), and then average all cells with weights proportional to the area sown to the given crop in each cell (based on [24]). For maize, weather was averaged for the period three to two months prior to harvest (e.g., July–August for a cell with an October harvest), whereas for wheat it was averaged for the three months ending at harvest (e.g., January–March for a cell with a March harvest). These periods were chosen to represent the most weather-sensitive portions of the growing season for the respective crops. Maps of the crop areas and harvest months defined for each crop are shown in figure S2, and the data used in the regression are shown in figure S3. Although this approach intuitively represents an improvement from prior work that simply used the same growing period for all locations [22], very similar results are obtained using fixed seasons (not shown). The coefficients of the linear regressions (table 1) indicate a change of, respectively, −7% of average yield for each degree of temperature warming for maize and −6% for wheat, with insignificant coefficients for precipitation. However, in order to explore the uncertainties in the fitted relations, our results are based on samples of coefficient values, rather than their point estimates. We randomly draw 500 values of the coefficients from Gaussian distributions with the means and standard deviations listed in table 1.
Table 1. Sensitivities of yields to unit changes in temperature and precipitation, obtained by fitting linear regressions to historical values (shown in figure S3). The values of the precipitation coeeficients are not statistically significant. Model R2 was 0.34 for both crops.
| Crop | Climate variable | Mean estimate of yield sensitivity (% yield) | Standard deviation of estimates of yield sensitivity (% yield) |
|---|---|---|---|
| Maize | Temperature (+1 °C) | −7.0 | 1.5 |
| Precipitation (+10%) | 1.5 (n.s.) | 1.0 | |
| Wheat | Temperature (+1 °C) | −6.0 | 1.2 |
| Precipitation (+10%) | −1.0 (n.s.) | 0.7 |
We are interested in assessing a range of possible changes in temperature and precipitation over the same regions and seasons over the next 10 or 20 year as can be derived from several types of model experiments. The first type is a pre-industrial control simulation of 900 years of length, available from the NCAR-DOE Community Climate System Model version 3 (CCSM3). This experiment lets the climate system evolve undisturbed by external forcings, therefore producing the behavior of a stationary climate, in particular in the absence of AGW. The second type of experiment is a 40-member initial condition ensemble exploring the effects of internal variability in the presence of external forcings [13, 14]. This experiment uses the SRES scenario A1B [25] and produces output over the 21st century, of which we use the first 50 years. Since the scenario is the same and the model is the same, the 40 member ensemble differences are due uniquely to the effect of internal variability, explored by starting each of the member from a different initial state (day) at the end of the 20th century simulation. The third type of experiment is a 39-member multi-model ensemble obtained from the output archived under the Coupled Model Intercomparison Project Phase 5 (CMIP5) [20]. We choose the scenario that is most similar in forcings to A1B over the first half of the century among the new representative concentration pathways (RCPs), RCP 8.5. In particular, the trajectory of atmospheric CO2 concentration over the first 50 years of the 21st century (the portion of the experiments we use) is almost identical between RCP8.5 and SRES A1B. The 39 models each provide one run covering the historical period (with estimated historical external forcings) and the 21st century, of which we use the first half.
For each of the individual runs, i.e., the 900 year control run, the 40 50-year runs from the CCSM3 ensemble or the 39 50 year runs from the CMIP5 ensemble, we compute crop-specific averages of temperature and precipitation. This is achieved by first interpolating all model output to the native resolution of CCSM3 (T42 resolution, or about 2.5°), and extracting the median harvest month and mean crop area for each climate model grid cell. The climate output is then averaged over the specific regions and months for each crop, resulting in a time series of annual values for each climate model simulation. We then compute linear trends over each overlapping segment of 10 or 20 years and transform the trend values into measures of 10 or 20 year changes (by multiplying them by 10 or 20, respectively). The use of the first 50 years of 21st century simulations to calculate trend probabilities for the next 10 or 20 years assumes a linear rate of warming from AGW over 50 years, similar to prior approaches [16]. In the case of precipitation we also transform the change to a percent change, using a climatological mean value for precipitation over the same regions and seasons computed either as the overall mean value of the control run, or from the historical portions of the CMIP5 model runs.
Thus, the three different types of experiments produce large samples of 10 year or 20 year bivariate changes (delta T, % delta P) from which we compute the corresponding changes in yield by applying sampled values of the coefficients of the regressions according to their statistics detailed in table 1. Because the yield model is linear, calculating impacts in this way is equivalent to calculating them at the country scale and then aggregating to the global scale. All yield impacts are expressed as a percentage change in yield relative to the 2008–2012 average global yields. Because of the size of the ensembles and the length of the runs, the sample sizes vary across the three types of experiment and the two time-horizons. For the 10 year changes, we use 891 values of delta T, % delta P from the control experiment, 1640 values from the LE and 1599 values from the CMIP5 experiments. For the 20 year changes, we use 881, 1240 and 1209 values respectively.
We then compare the outcomes from the externally forced type of experiments to the results from the control experiment, and determine if the climate affected by AGW is producing significantly different frequencies of rapid shifts compared to what would be expected simply as a result of internal variability in an undisturbed climate system.
For this analysis, we assume that positive effects of elevated CO2 on yields will continue over the next 20 years at the same rate as has occurred in recent years. That is, because the changes in CO2 are very gradual and linear over time, we assume that CO2 changes will not cause any deviation from historical yield growth rates and can thus be ignored in our analysis of a possible yield slowdown. We also assume that the linear responses estimated from historical deviations apply to temperature changes that sometimes exceed the largest values in the training data (of roughly 1 °C). This assumption appears valid based on previous studies that compared multiple models and projections at different levels of warming [26, 27], but any increase in sensitivity at higher temperatures would cause our results to be overly conservative.
Results and discussion
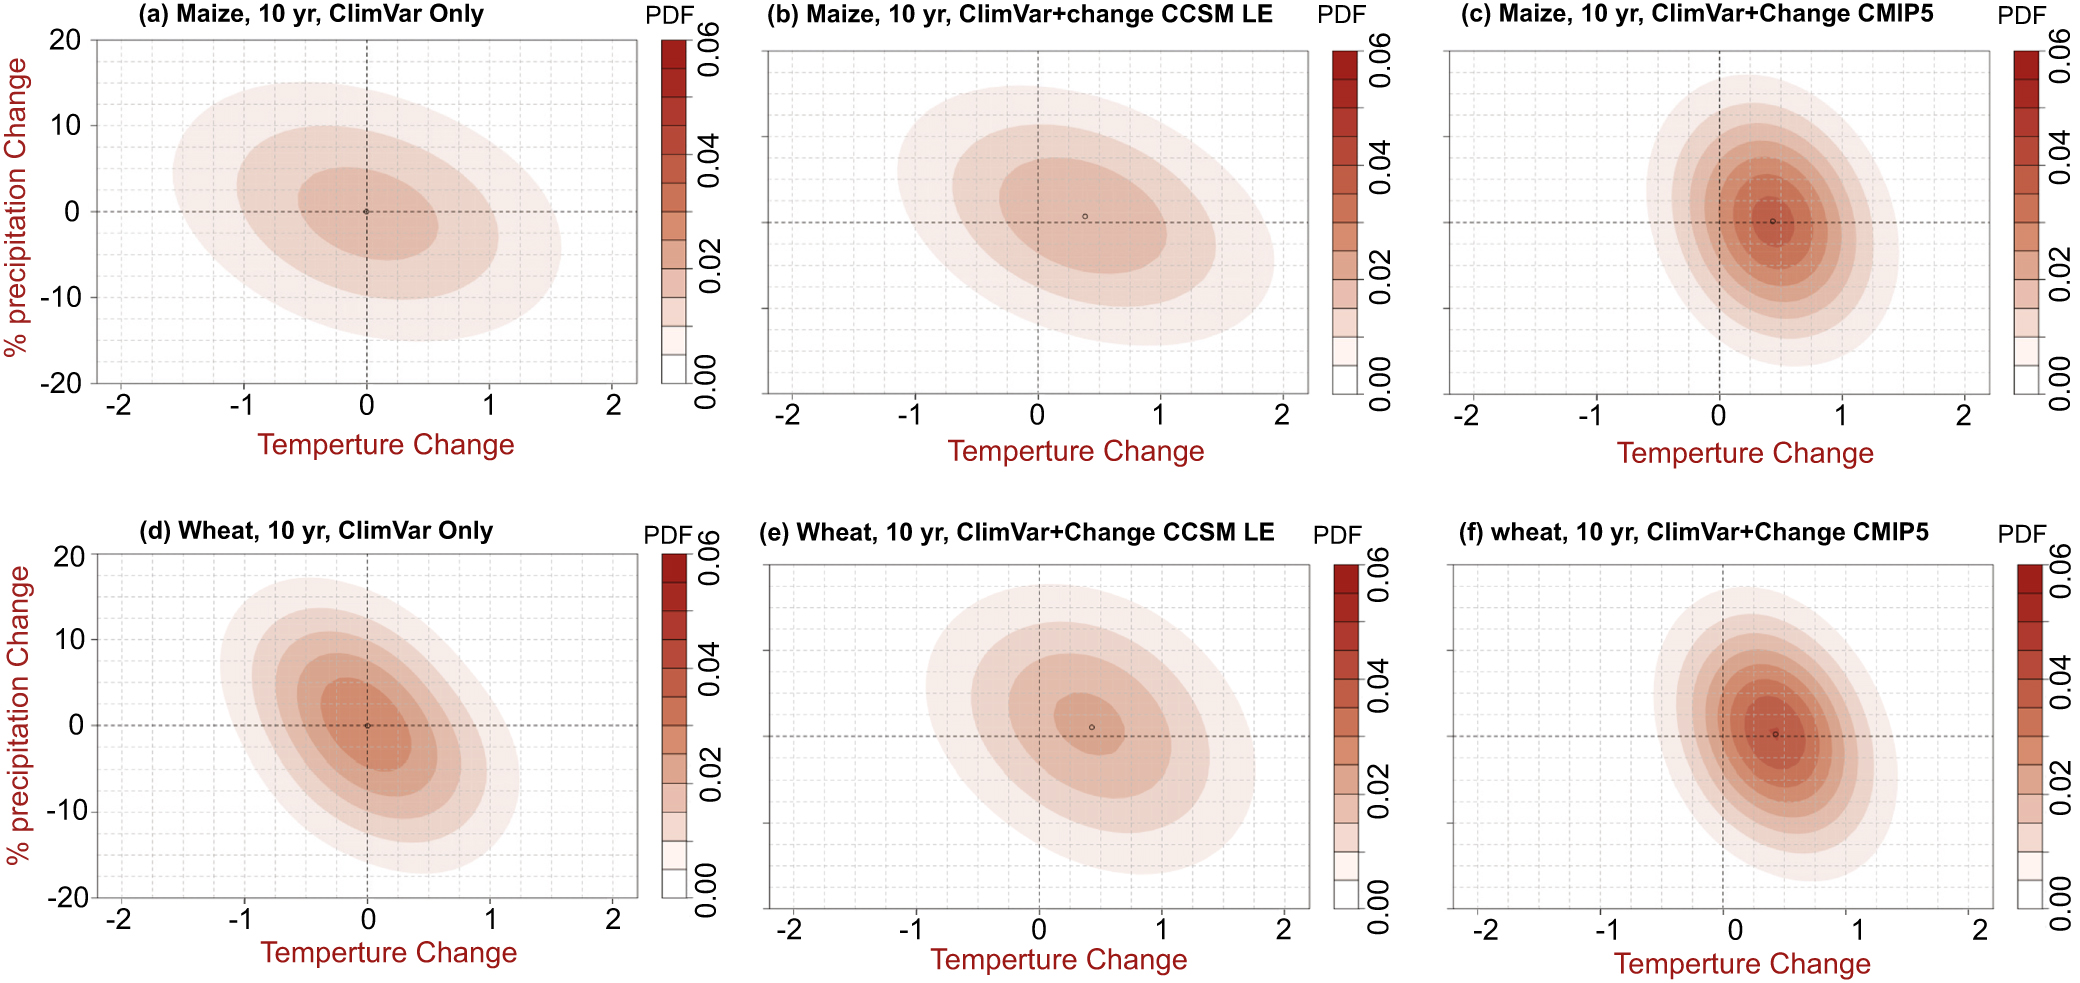
We first consider the possible climate trends for 10 and 20 year periods. For both maize and wheat, control simulations indicate that internal variability is fairly unlikely by itself to produce temperature changes in excess of 1 °C in absolute value for a 10 year period (figure 1). Maize is slightly more likely (∼7%) to experience an aggregate warming trend of +1 °C or more than wheat (about 2%), because maize area is more geographically concentrated, and thus large regional trends can have more influence on global maize than wheat trends. Compared to control runs, the AGW runs show the expected shift towards warmer trends. Interestingly, the results from the LE and CMIP5 indicate similar shifts in the median of expected temperature trends (∼0.4 °C), but LE exhibits a wider distribution and therefore a higher chance of trends above +1 °C (18% for LE, 7% for CMIP5 for maize; 15% for LE, 6.5% for CMIP5 for wheat). This result was not necessarily anticipated, given the comparable size of the ensembles (40 members for LE, 39 for CMIP5). The CMIP5 members are affected by inter-model variability, sometime defined as structural variability, having to do with the individual models representation choices, but they also sample—albeit with a sample size of one—the individual models internal variability. The LE instead is specifically designed to explore the effects of internal variability, while not addressing structural uncertainty, since it is produced by a single model. It appears from these comparisons that the component of internal variability dominates, here, and the experiment designed to explore that component produces a larger range of outcomes. The fact that model uncertainty is not the dominating source of variability for short term projections and temperature, even at regional scales, has been documented before [15].

Figure 1. Joint distributions of temperature and percent precipitation changes projected over the course of 10 years and over the crop region and season by the three type of experiments considered. (a), (d) Control runs from CCSM3, including only the effects of internal climate variability; (b), (e) large ensemble of initial condition perturbations from CCSM3, including externally forced changes; (c), (f) CMIP5 ensemble, including externally forced changes. Top row (a)–(c): model output aggregated over the maize growing regions and seasons. Bottom row (d)–(f): model output aggregated over the wheat growing regions and seasons. Colors indicate values of the probability density function.
Download figure:
Standard image High-resolution imageFor both LE and CMIP5, the chances of strong cooling trends are significantly reduced compared to the control. Of course, cooling trends are still plausible on the 10 year time scale, with ∼13% and ∼12% of cases from CMIP5 producing no warming over 10 years for the maize and wheat region respectively, and ∼28% and ∼22% of cases from LE producing no warming over the same regions. These results agree well with several studies of the recent warming hiatus, which characterized the potential effects of internal modes of variability in slowing down the warming effect of increased atmospheric greenhouse gas concentration [16, 28, 29].
The marginal distributions of precipitation changes do not shift as significantly as those of temperature changes across the three experiments, symptomatic of a weaker forced signal. Over timescales of 10 to 20 years it is well-known that AGW does not affect precipitation trends as significantly as it does temperature trends [30]. The lack of a coherent signal in either direction is also likely an effect of averaging precipitation changes over large regions, within which changes may cancel each other out. Thus, both the medians of the marginal distributions shift away from zero only by about 1% or 2%, and their spread do not change significantly when comparing control, LE and CMIP5 results. Noticeably different, however, are the shapes of the contours of the joint distribution of temperature and precipitation: in the case of the results from the single model, the two variables maintain the coherent correlation (negative in this case) that the climate system imposes to the changes. In the case of CMIP5, the coherence is lost and the contours do not show any tilt. This may be an important consideration when modeling approaches choose to use sampling from these type of distributions to feed variables into impact models, in cases where the coherence of the joint probability distribution might be important to preserve. In our case we use the joint precipitation and temperature trends from each model's realization, and therefore the coherence is preserved by construction.
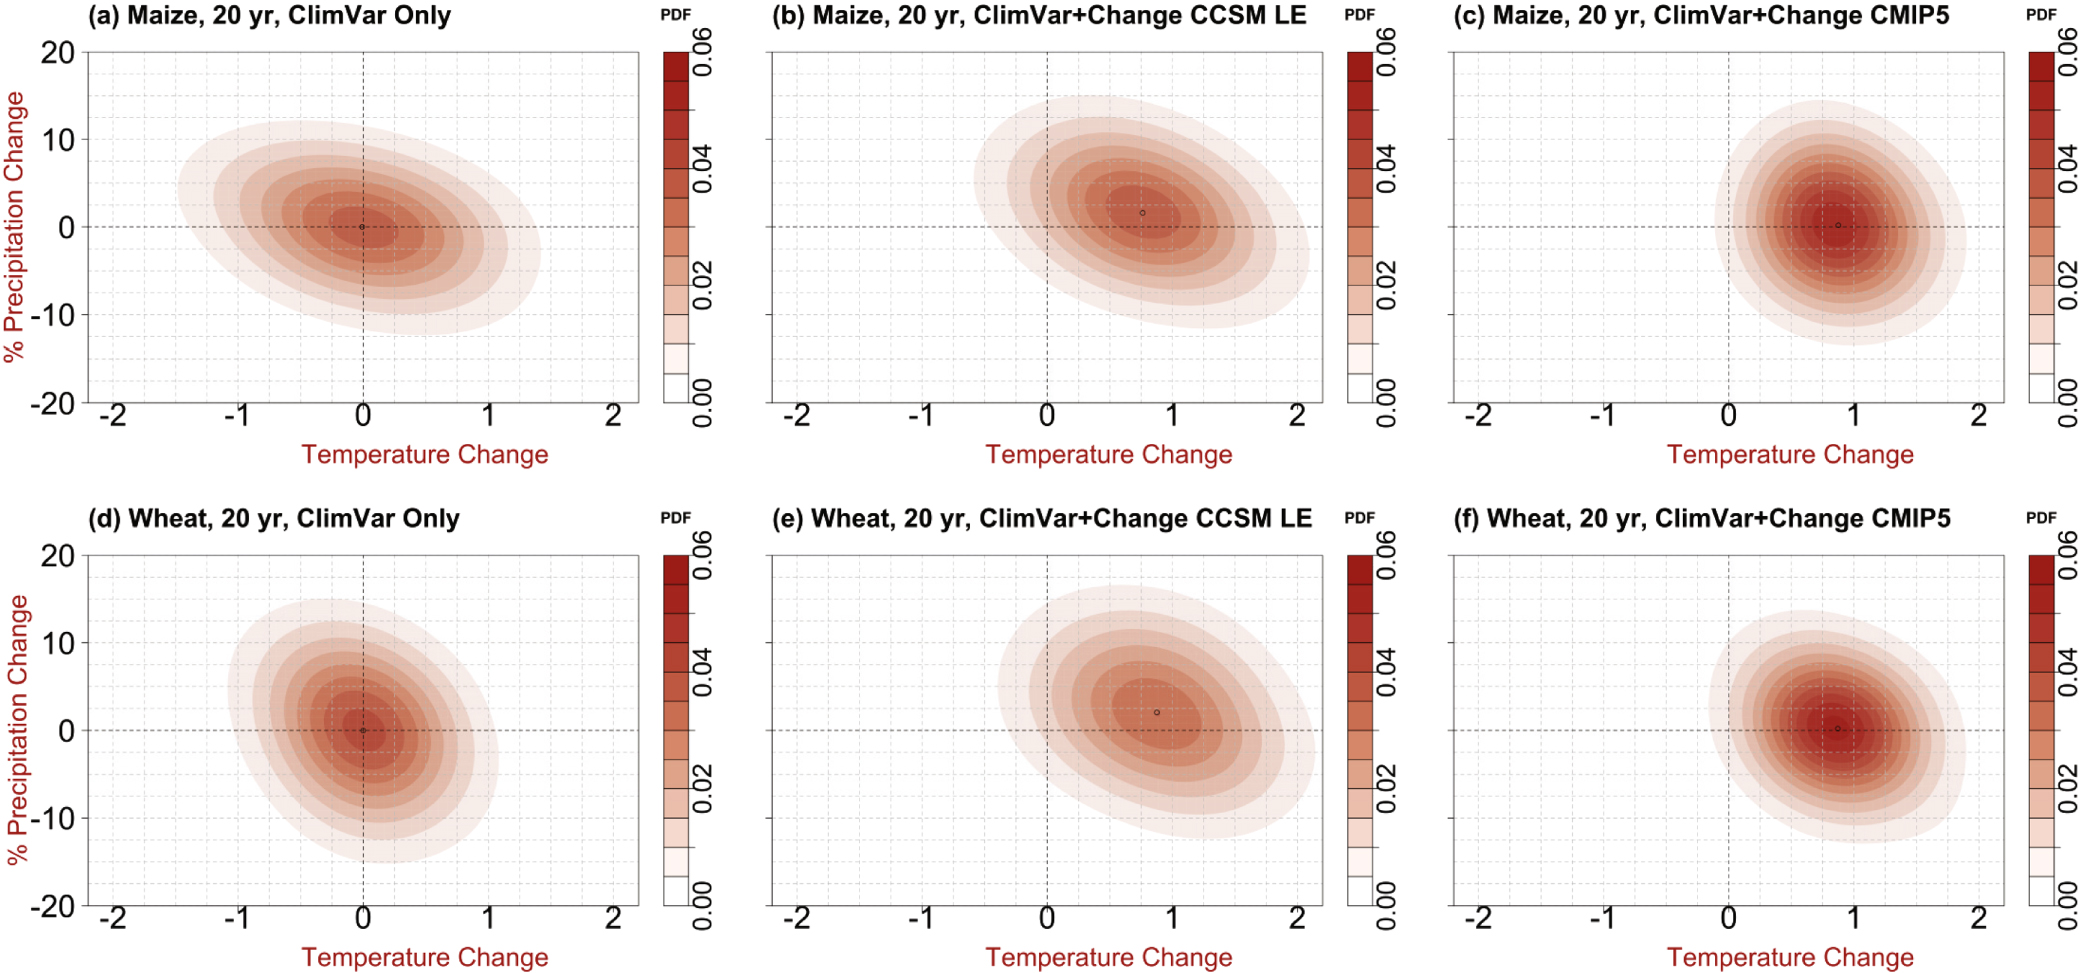
Climate trends on the 20 year time scale show similar patterns to the 10 year period, but with wider shifts between the control and AGW (LE and CMIP5) contours (figure 2). Thus cooling trends becomes even less likely for either maize or wheat, reaching 7% and 2% for LE for maize and wheat respectively, but remaining below 1% in all cases according to CMIP5. Correspondingly, the AGW experiments show significantly higher chances for a warming trend of +1 °C or more: 30 to 35% for maize in both experiments, and 34% (CMIP5) to 40% (LE) for wheat. Precipitation changes remain small in percent values (medians of 1% or less), and the marginal distribution still appears symmetric around the zero line.

Figure 2. As in figure 1, but for changes projected over 20 year periods.
Download figure:
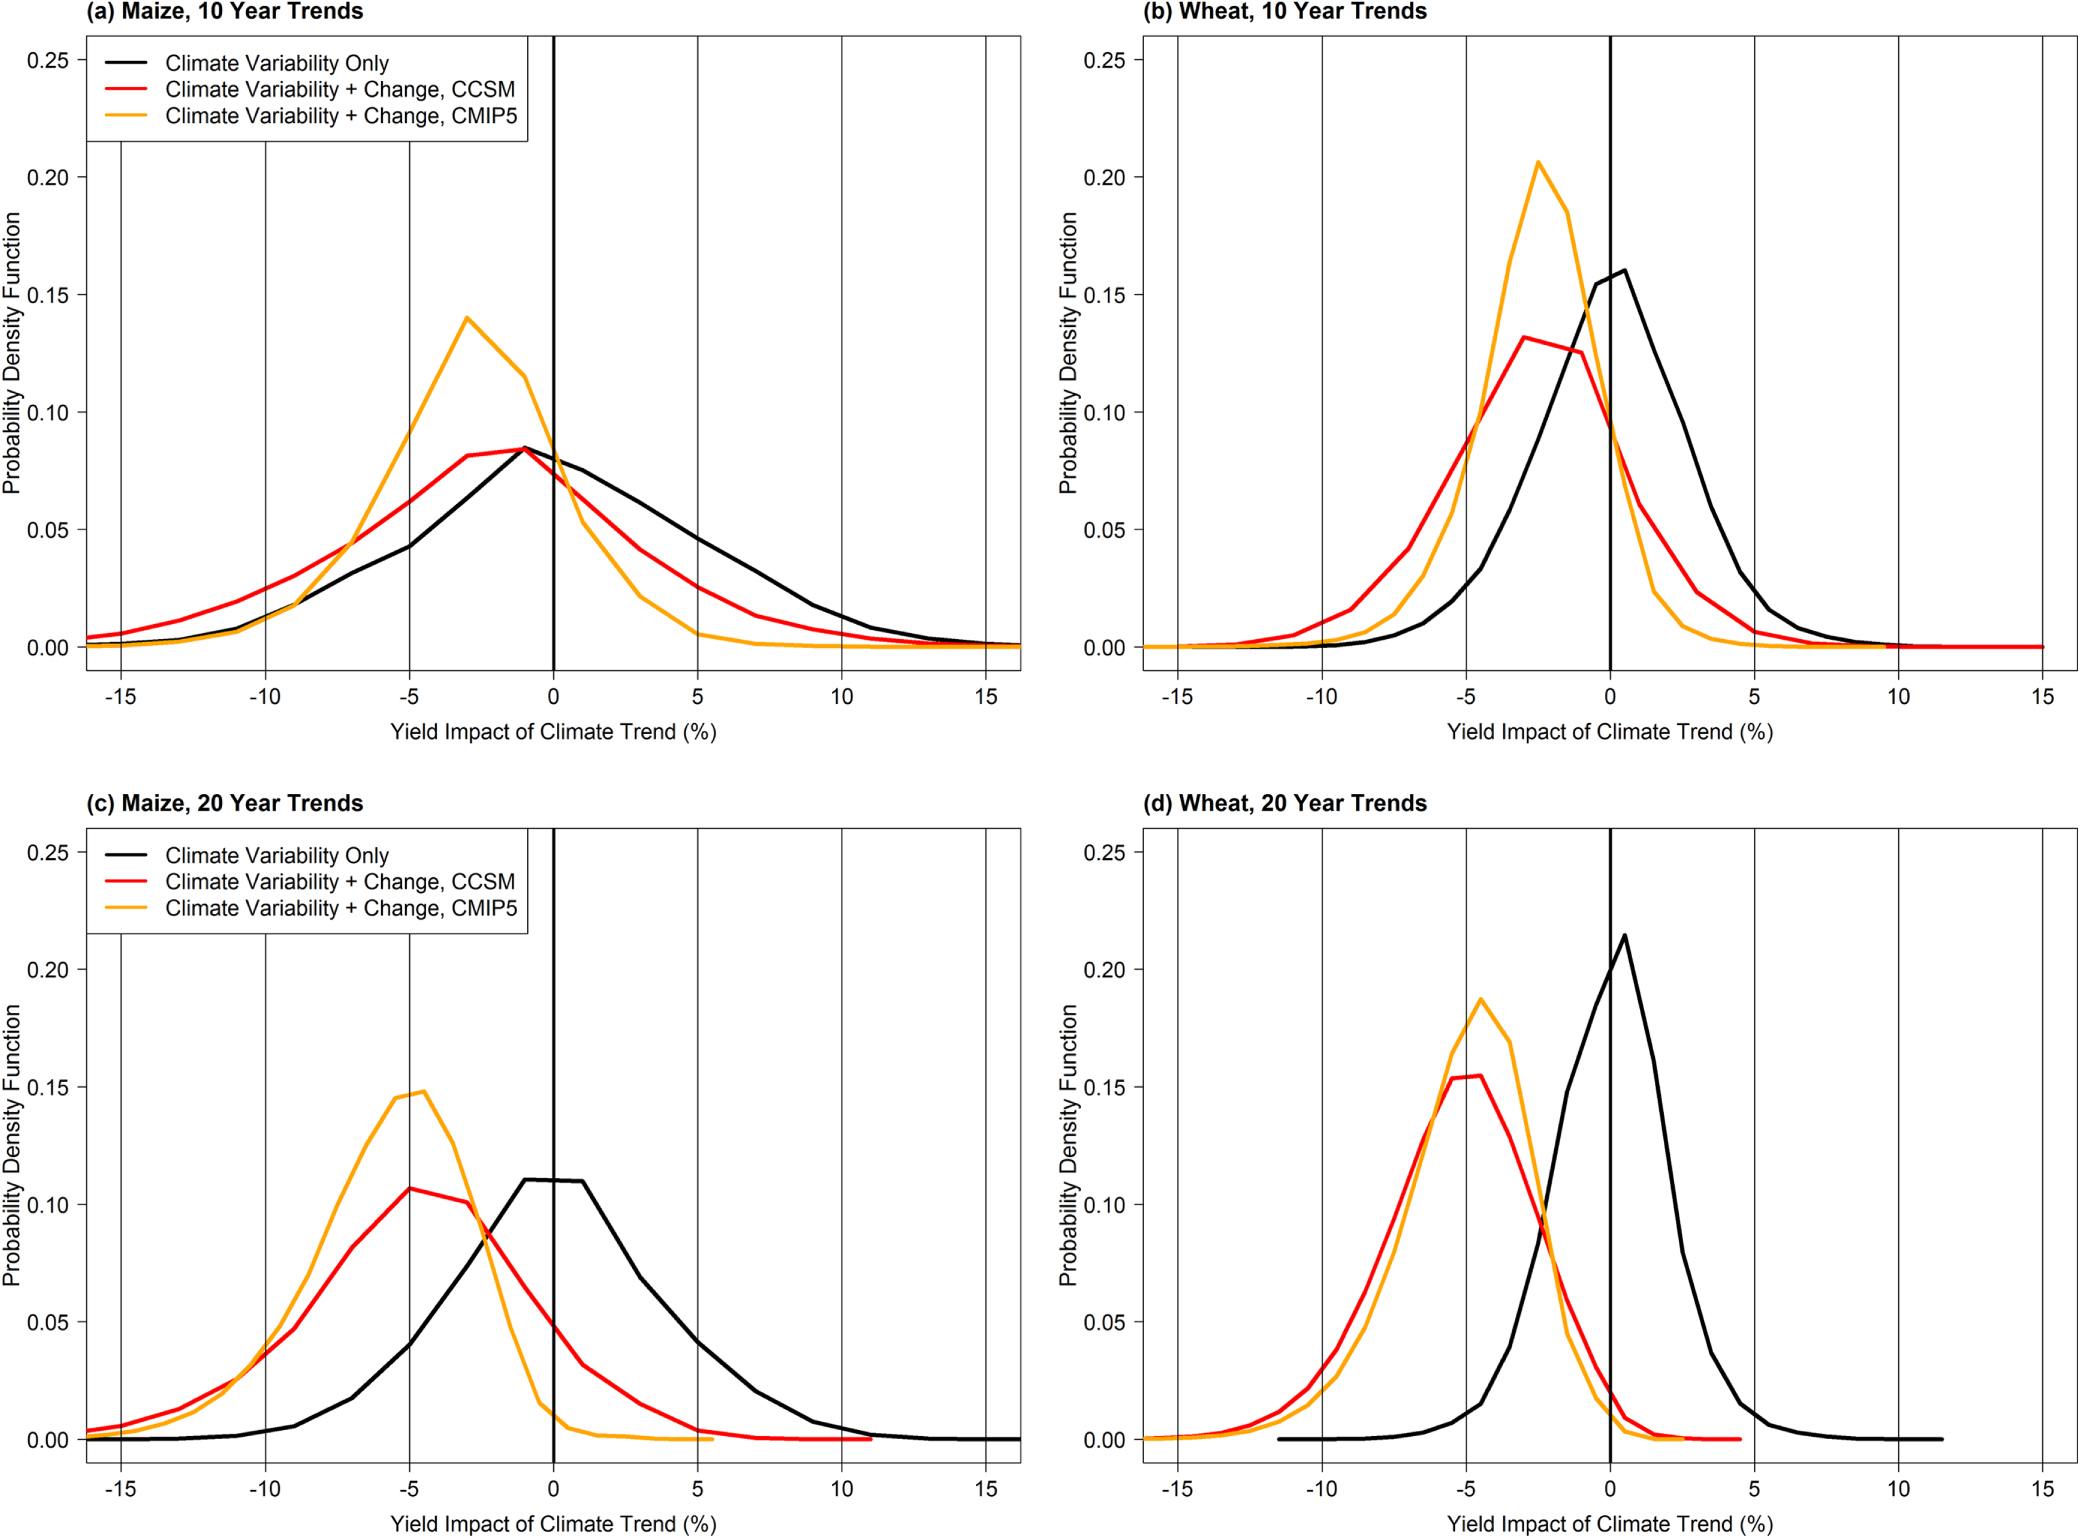
Standard image High-resolution imageFigure 3 translates the distributions of temperature and precipitation changes for each experiment, time horizon and crop into distributions of yield changes. In all cases, the changes associated with the control experiments—representing climate variability alone in the absence of external forcings—are centered around zero as expected (black lines). The distributions obtained by using changes from externally forced experiments are shifted towards negative values. The mean projected yield impacts are similar for maize and wheat (−2.6% and −2.5%, respectively, for a 10 year period and −5.3% and −5.2% for a 20 year period), and agree with estimates from previous studies projecting expected impacts over the next few decades [21, 26, 27]. In all cases the mean change is nearly identical from the experiments conducted by CCSM3 alone as that from the CMIP5 multi-model ensemble. The variability (spread) represented by these distributions is slightly tighter (less variable) for the CMIP5 than the LE results.
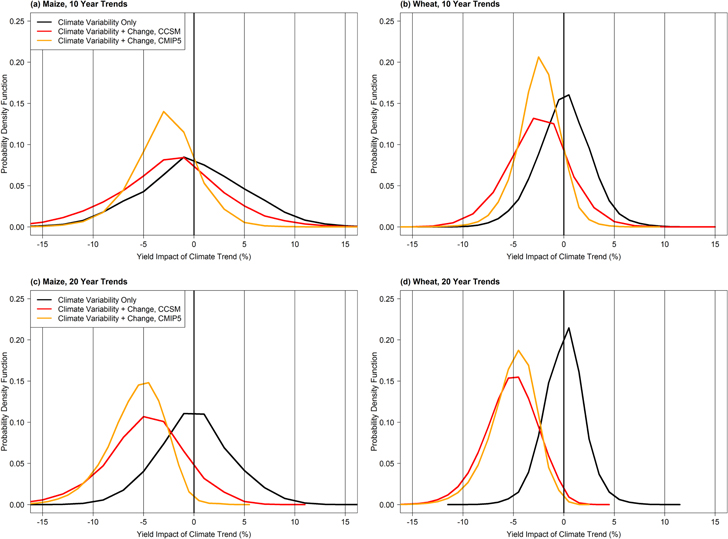
Figure 3. Distributions of yield impacts obtained by applying samples of randomly generated sensitivity coefficients (see table 1) to the changes described by the joint distributions in figures 1 and 2. In each panel the black line corresponds to the control experiment results, the red line to the large ensemble results and the yellow line to the CMIP5 results. (a), (b): yield impacts over 10 years for maize and wheat. (c), (d): yield impacts over 20 years for maize and wheat.
Download figure:
Standard image High-resolution imageWe highlight in figure 4 the chances of what we defined 'substantial climate-induced slowdowns', which reflect the area under the left-hand tails of the distributions shown in figure 3. The chances of yield impacts of −5% or worse for a 10 year period are larger in the experiments that include the effects of AGW than in those that include only climate variability (figure 4, left panel). For maize, the chances even without AGW are fairly substantial at 16%. Yet with AGW, the chances increase to 22% in CMIP5 and 29% in LE, representing an increase of 40 to 81%. Increases are larger for the LE owing to the greater spread in the distribution of potential 10 year trends (figures 1, 3). For wheat, which has more geographically distributed area and a slightly lower temperature sensitivity (table 1), the corresponding chances are ∼4% in control, 11% in CMIP5, and 20% in LE. Thus, the chances of wheat yield impacts worse than 5% increase by three to five times their baseline rate.

Figure 4. Chances of climate-induced slowdowns that would roughly halve projected yield trends ((a) 5% yield losses over 10 years and (b) 10% yield losses over 20 years) for the two crops and the three type of experiments. The color-scheme is the same as in figure 3.
Download figure:
Standard image High-resolution image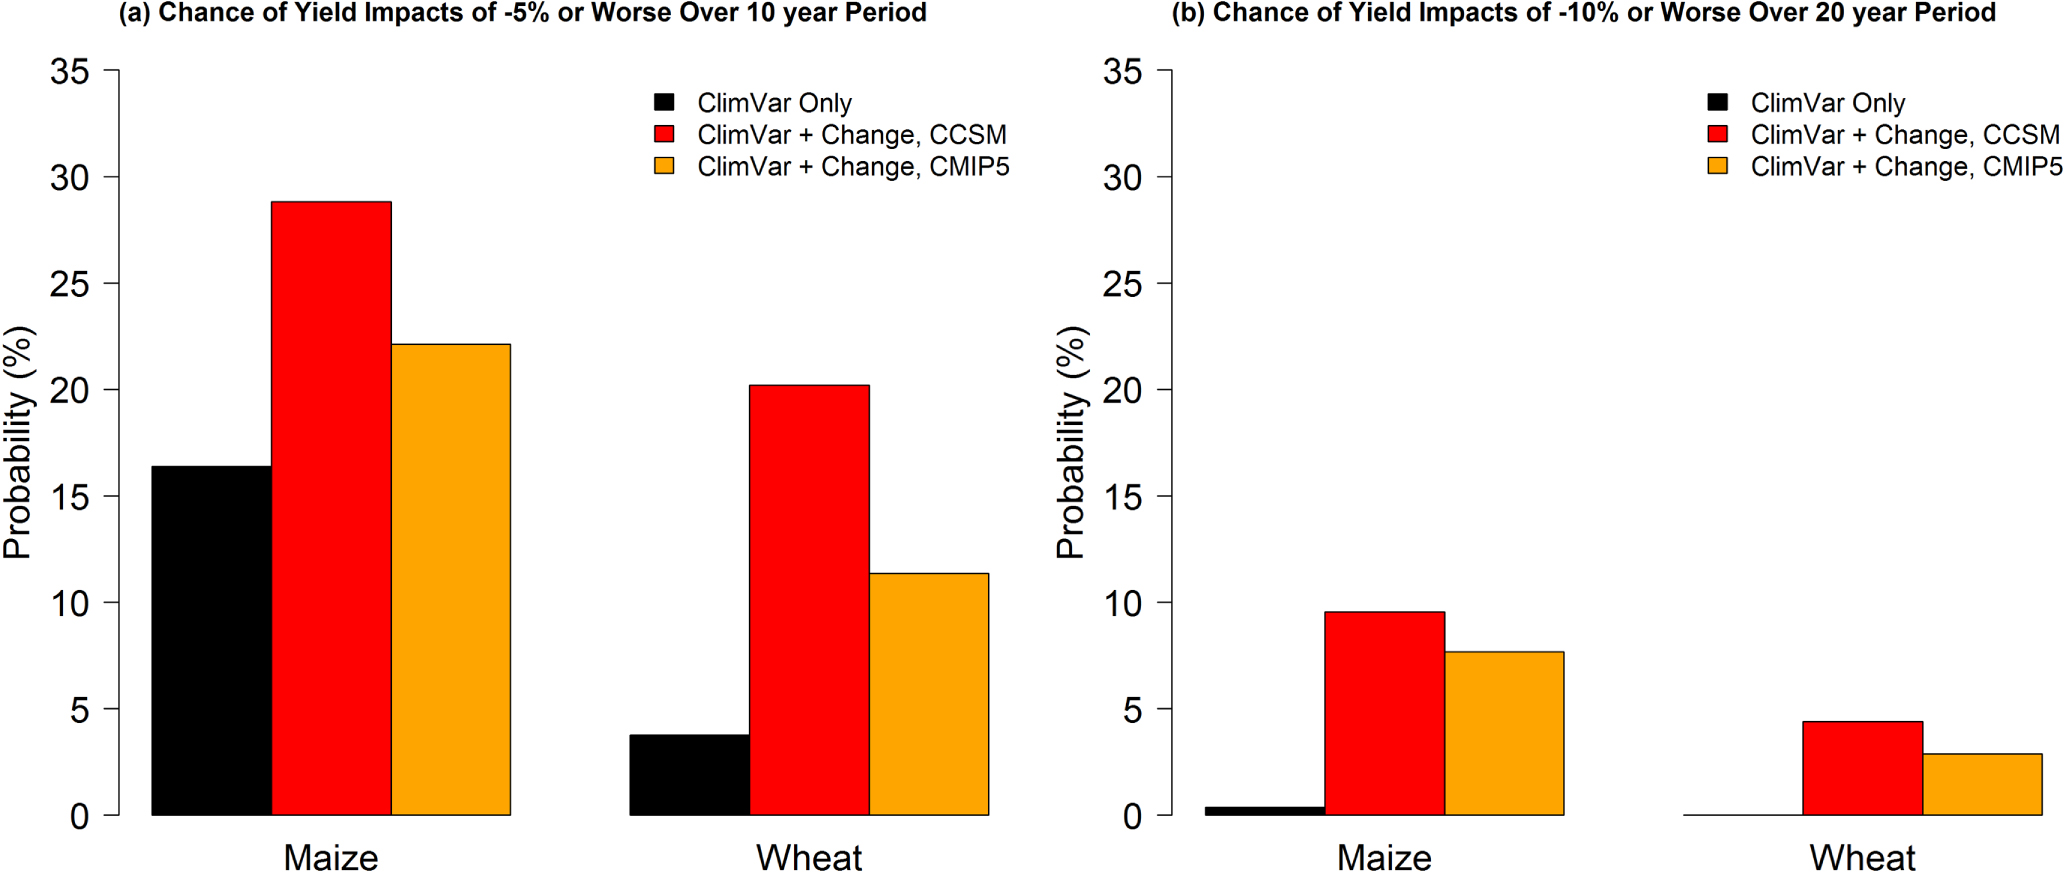
For a 20 year time period, the chance of climate trends from natural variability alone causing 10% or more yield loss is exceedingly low, both for maize and wheat (less than 1%) (figure 4, right panel). Yet with AGW, the chance increases to 8% in CMIP5 and 10% with LE for maize, and to 3 to 5% for wheat. The risks of yield impacts large enough to halve yield trends over a 20 year period are therefore greatly increased by AGW, rising from a chance of less than 1 in 200 for either crop to roughly 1 in 10 for maize and 1 in 20 for wheat. For wheat, the distribution of potential yield impacts for a 20 year period is relatively narrow for the control, owing to the crop's wider geographic distribution, with even 5% losses having only a 1% chance of occurring (figure 3). Yet impacts of this magnitude become the expected case under AGW, with 50% chance of occurring. Thus, although AGW increases the risk of yield impacts at all time scales, the relative increases are greater for 20 than 10 year periods because the chance for large climate trends from natural variability alone are much smaller at 20 year time scales.
Conclusions
Overall, this study points to four main conclusions: (i) a rapid shift in climate that would cause a substantial slowdown in global crop yield growth has been made much more likely because of AGW. (ii) The risk estimates depend on the method used to assess natural variability, with LE simulating a greater degree of variability and thus higher risks of rapid trends. (iii) There are important differences by crop, owing both to the differing geographic concentrations and climate sensitivities. In this case, the chances of large yield effects on maize at 10–20 year time scales appear more likely than for wheat. (iv) Changes at the global scale are primarily driven by temperature, because changes in precipitations tend to average out across regions. Results may be different when considering smaller regions where coherent changes in precipitation may be projected, but very few regions in the world have been found to have coherent precipitation projections [30].
One assumption of the current analysis is that major adaptation to climate change does not occur over the next 20 years. Specifically, application of the historical model to future climate changes assumes that the locations and seasons of maize and wheat production do not change. Shifts in production to different regions, such as cool high latitude locations where growing season temperatures are lower, could moderate the chance of yield losses, although studies of such shifts indicate they are not occurring fast enough to significantly alter the global pattern of maize or wheat production [31]. For example, maize area in North and South Dakota has increased by 50% since 2000, but still represents less than 10% of total United States maize area and production [32]. Similarly, some have argued that shifts in varieties or management practices could reduce the climate sensitivity of yields in their current production areas [33]. However, there is scant evidence that this is occurring, and even some indications that heat and drought sensitivity has increased in United States maize systems [34, 35]. Although further study may prove otherwise, we do not anticipate adaptation being fast enough to significantly alter the near-term risks estimated in this paper.
The results of this study suggest that AGW has substantially increased the risks of major impacts in the near-term, with for instance a more than twenty fold increase in the chance of yield impacts of 10% or more over a 20 year period. We recognize that the numbers we compute are risk estimates that apply to our models' world. Both the accuracy of projections from climate models and the representativeness of these model ensembles when quantifying uncertainties has been amply discussed [36, 37]. Therefore we underline that the estimates shown are most valid in terms of comparative changes in likelihoods, rather than absolute changes. Consideration of both the effect of internal variability in the use of a large initial condition ensemble and that of model uncertainty in the use of multiple models makes our estimates of changes in risk robust, especially considering that we are limiting our horizon to the next few decades, while modeling uncertainties are known to affect more significantly long-term projections [15].
Of course, a 1 in 10 or 1 in 20 chance of climate trend impacts large enough to halve yield trends means that such an outcome is not very likely to occur, and we cannot know whether these scenarios will indeed come to pass. But the fact that their likelihoods are ∼20 times higher than in a pre-AGW world suggests that the implications of these scenarios deserve more attention than they likely receive by institutions concerned with food security or international peace in the coming decades.
Acknowledgments
This work was supported by NSF grant SES-0962625. We acknowledge the CCSM Climate Variability and Climate Change Working Groups '21st century CCSM3 Large Ensemble Project'. We also acknowledge the modelling groups, the Program for Climate Model Diagnosis and Intercomparison, and the Working Group on Coupled Modelling of the World Climate Research Programme (WCRP) for their roles in making available the WCRP CMIP5 multimodel dataset. Support of this dataset is provided by the Office of Science, US Department of Energy (DOE). CT was supported by the Office of Science, Biological, and Environmental Research, US DOE (Grant DE-SC0004956 and CA-DE-FC02-97ER62402), through the RGCM program. The National Center for Atmospheric Research is funded by the National Science Foundation.