
Abstract
In our globalizing world, the geographical locations of food production and consumption are becoming increasingly disconnected, which increases reliance on external resources and their trade. We quantified to what extent water and land constraints limit countries' capacities, at present and by 2050, to produce on their own territory the crop products that they currently import from other countries. Scenarios of increased crop productivity and water use, cropland expansion (excluding areas prioritized for other uses) and population change are accounted for.
We found that currently 16% of the world population use the opportunities of international trade to cover their demand for agricultural products. Population change may strongly increase the number of people depending on ex situ land and water resources up to about 5.2 billion (51% of world population) in the SRES A2r scenario. International trade will thus have to intensify if population growth is not accompanied by dietary change towards less resource-intensive products, by cropland expansion, or by productivity improvements, mainly in Africa and the Middle East. Up to 1.3 billion people may be at risk of food insecurity in 2050 in present low-income economies (mainly in Africa), if their economic development does not allow them to afford productivity increases, cropland expansion and/or imports from other countries.
Export citation and abstract BibTeX RIS

Content from this work may be used under the terms of the Creative Commons Attribution 3.0 licence. Any further distribution of this work must maintain attribution to the author(s) and the title of the work, journal citation and DOI.
1. Introduction
Food for millions of people is being produced with land and water resources situated in countries that are sometimes thousands of kilometres away. For example, the amounts of water used in export countries to produce agricultural products imported and consumed by the US exceed 70 km3 (Chapagain and Hoekstra 2004), and Japan, China and Mexico import agricultural products that need the use of almost 30 Mha land in other countries (so-called 'virtual land imports', Fader et al 2011).
Importing agricultural products provides opportunities: focusing on more profitable sectors, consuming 'exotic' or seasonal goods year-round, and profiting from lower production costs (and thus prices) in other countries. If well functioning, a diversified import policy may be essential for securing food supply in years with national crop failures. However, an import-intensive policy also implies a number of disadvantages, such as costs and greenhouse gas emissions from transport, indirect support of low environmental standards and human exploitation, and a certain dependence of consuming countries on the political, environmental, demographic and economic situation in the exporting countries that might choose or be forced to alter the supply available to the market. For example, following drought and wildfires in 2010, Russia imposed a ban on wheat exports, and Belarus banned exports of rapeseed oil to the EU (Welton 2011, Trostle et al 2011). Similar situations have also occurred during the food crisis of 2007/2008, when food price spikes led to government-imposed bans, restrictions, quotas and higher taxes on exports in various countries (Trostle et al 2011, Maetz et al 2011). For several importers, these situations caused a lack of food supply e.g. in Burkina Faso, Pakistan, and Latin American and Caribbean countries (Polovinkin 2010, Welton 2011, Rosen et al 2011). For these countries, such events are a substantial risk to national food security and could be a good reason for a self-sufficiency policy, as is being implemented for example in Qatar (Qatar National Food Security Programme 2011), Japan (Ministry of Agriculture, Forestry and Fisheries 2005) or India (Department of Agriculture and Co-operation 2012).
In this context, a number of recent studies have provided valuable information on countries' potentials for agricultural production and of the dependence level of countries on other countries (e.g. Rockström et al 2009, Hoekstra 2009, Chand 2006; see appendix A for a short literature review on this topic). Our work aims to contribute to this discussion by analysing, at the global scale, the water and land constraints for national food self-sufficiency (11 major food and fodder crops, spatially explicit) while considering important aspects omitted in former studies, such as actual, country-specific consumption of crop products, international trade flows, natural resources availabilities and possible future productivity increases. We then discuss the extent of dependence of a country on other countries' land and water resources, which reflects the degree of dependence on globalized trade structures.
Building on previous work where we quantified water and land savings through international trade using a vegetation and hydrology model and trade data (Fader et al 2011), we now present simulations of water availability as well as crop production and yields under a set of socioeconomic scenarios. Calculations were made for the present and for three scenarios of future, country-specific agricultural productivity, considering three scenarios of population change and environmental potentials for cropland expansion and increased water consumption. The objective is to answer the following research questions:
- (a)How close are countries to their natural resource boundary? That is, which countries are consuming more crop products than they could produce domestically, even when accounting for expansion into potential arable land and renewable water that is not currently used?
- (b)How would the dependence of a country on external water and land resources evolve under different productivity and population scenarios?
- (c)In which countries will population growth imply the need for substantially increased imports of crop products?
- (d)To what extent could cropland expansion and increased water consumption contribute to meeting increased future food demand domestically?
The following sections describe the methodology to quantify resources availability and use, agricultural production, future production needs and productivity increases, needed to assess countries' current and possible future dependence on imports (guided by the question 'what if countries had to produce all of their food domestically?').
2. Methods and data
2.1. LPJmL model
This study is based on process-based, biogeochemical simulations with the dynamic global vegetation and water balance model LPJmL (Bondeau et al 2007, Rost et al 2008a). The model calculates (at daily time steps and on a global 0.5° longitude/latitude grid) key ecological, hydrological and biogeochemical processes governing the growth of natural and agricultural terrestrial vegetation.
The inputs to the model consist of monthly climate data (CRU TS3.0 database; http://badc.nerc.ac.uk/data/cru; last accessed 10 December 2009), soil texture (as in Gerten et al 2004) and land use patterns (irrigated and rainfed areas as in Fader et al 2010). Seasonal phenology (sowing and harvest dates, leaf status) and agricultural yields are simulated for 11 crop functional types (CFTs: temperate cereals, maize, rice, tropical cereals, temperate roots, tropical roots, rapeseed, groundnuts, soybeans, pulses, sunflower) and an additional category of 'other crops' in which potatoes, sugar cane, oil palm, citrus, date palm, grapes, cotton, cocoa, coffee and others are treated as managed grassland.
In LPJmL, agricultural management is represented by three coupled, CFT-specific parameters, the maximal achievable leaf area index (LAImax), the harvest index and a parameter indicating the degree of heterogeneity of the fields. Together they characterize a bulk of management effects, including variety selection, nutrient supply and weed, pest and diseases control. In a calibration process, values of LAImax are sequentially varied from 1 to 7 for each CFT, and the two other parameters are varied in relation to LAImax. The value with the best match to observed FAO yields (average of rainfed and irrigated) is chosen for each CFT and country (Willmott coefficients of agreement between 0.78 and 0.99, see Fader et al (2010) for more details).
LPJmL simulates various hydrological variables ecophysiologically coupled with vegetation dynamics, including crop water consumption, irrigation requirements and crop water stress (Gerten et al 2004, Rost et al 2008a).
Land and water available for future cropland expansion and increased irrigation use were calculated combining LPJmL simulations and other data sources. We excluded land and water already used by humans, accounted for spatiotemporal variability of water resources, and reserved land for ecosystem conservation and carbon sequestration as well as water for environmental flow requirements (see appendix B for details and maps), yielding global values of available renewable water resources and available land of 17 953 km3 and 1322 Mha, respectively.
2.2. Scenarios
Human population estimates for 2050 were taken from three SRES IPCC scenarios: A2r (IIASA, economic, regional, high fertility, high mortality), B2 (UN median projection, environmental, regional, continuation of historical trends) and B1 (IIASA, global, environmental, low fertility, low mortality) (UN 1998, IPCC 2000, Grübler et al 2007, www.iiasa.ac.at/Research/GGI/DB; last accessed 21 May 2010), reaching 10.2, 9.3 and 8.6 billion people in 2050, respectively.
In order to determine the natural constraints for agricultural production, it is assumed that countries need to produce in 2050 the amount of current imports plus the current domestic production minus the current exports in tons, linearly increased or decreased with projected population development. This simple equation represents the current national food supply and consumption. Binational trade data for the 11 crop types, averaged for the period 1998–2002, were taken from the United Nation's Commodity Trade Statistics Database (http://comtrade.un.org; last accessed 7 July 2009), and the countries' crop production was taken from the LPJmL simulations. Since there is a high uncertainty concerning the efficiency of the agricultural sector in future, we defined three scenarios of agricultural management to consider a broad range of future developments:
- CUR. Crop yields, production and water consumption calculated assuming current management intensities (LAImax values as described in section 2.1).
- POT. Crop yields and water consumption calculated assuming optimal crop management countrywide, using the CFT-specific LAImax value leading to the highest national yields (average of rainfed and irrigated).
- HIG. Same as POT, but assuming a lesser improvement of agricultural management, i.e. using an LAImax value two units nearer to the one chosen for POT (or less units if the difference was <2).
HIG represents an average 1.0% yr−1 production increase (range: 0.5–1.4% yr−1 depending on the CFT); POT an average 1.6% yr−1 (0.6–2.5% yr−1).
For each of these management scenarios, we assessed the water- and land-related potentials and limitations of each country to reach the specified crop production. For this, we calculated the proximity of each country to its natural boundary, expressed as the ratio between the respective water and land requirements and the actual availabilities (see following sections). These results were linearly translated into the population fraction dependent on external resources globally and for each country (see appendix C).
2.3. Calculation of the level of dependence
For the year 2000 a country's natural resource boundary is considered transgressed when more water/land would be needed to achieve self-sufficiency than is domestically available. We calculated the required water consumption increase (WCI) as percentage of the available, renewable water resources of the country and the required cropland expansion (CE) as percentage of the available, productive land. If CE or WCI > 100%, the country would not have enough land and water available to fulfil the production requirements, i.e. its consumption is above its natural resource boundary.
To estimate the number of people whose food is produced with land and water resources situated outside their countries, we first calculated the land and water requirements per capita as the sum of the requirements to replace imports and the requirements for maintaining the part of the production consumed domestically, divided by the total population. Afterwards, we divided the absolute CE and WCI values by the per capita requirements.
For the calculation of the level of dependence in 2050, we added the CE and WCI requirements due to population change under A2r, B1 and B2, under consideration of the productivity scenarios explained in section 2.2 (see appendix C), and investigated in more detail the 'low-income economies' (The World Bank Group 2012).
3. Results
3.1. Current situation
Currently, 950 million people (16% of world population) use the opportunities of international trade for covering their demand of agricultural products. The spatial pattern is pronounced—North African, Arabic and Andean countries display the highest shares (>50%) of dependent population (figure 1(a)).

Figure 1. (a) Percentage of population dependent on external water and land resources in 2000 considering current water and land productivities of the importers, present land use patterns and international trade flows averaged for 1998–2002 after COMTRADE. (b) Countries' classification according to their ability to produce the crop products they currently consume, considering current water and land productivities as well as available (i.e. unused) water and productive land. Countries coloured in dark and light green have sufficient land and water to produce what they currently consume, but countries in light green are approaching at least one of those boundaries.
Download figure:
Standard imageToday, 66 countries are not able to be self-sufficient (figure 1(b)) due to water/land constraints: the consumption of agricultural products in 22 countries is above the national water boundary, and in 62 countries above the land boundary. Some countries are approaching a level of consumption that is near to at least one natural boundary, for example Bangladesh and Egypt (land), Slovenia (water) and Spain (both). From the 950 million people depending on external resources (figure 1(a)), about a third will not have the possibility of meeting their demand with domestic water and land resources, even if all productive land and renewable water still available in the respective countries was used for agriculture (figure S1 available at stacks.iop.org/ERL/8/014046/mmedia).
Combining the information in figures 1(a) and (b) illustrates the degree of trade dependence of countries. On the one hand, a high proportion of the population of some countries—e.g. Andean and Scandinavian countries (figure 1(a))—relies on crop imports, although not necessarily so, as these imports could be produced on domestic water and land resources (figure 1(b)). High imports in these countries (and thus high dependence) thus can have many other reasons, for example to benefit from comparative advantages, to focus on other economic sectors, or to protect natural ecosystems, or due to lack of capital, labour or know-how. In contrast, some other countries—e.g. North Africa and the Arabic Peninsula—are characterized by high shares of trade-dependent population and consumption above their natural boundary. Given current productivity, these countries are unable to produce what they currently consume, even when increasing the use of domestic resources. Thus, currently, they seem to not have any other choice than importing goods. These results show the opportunities and constraints of each country: both groups of countries are currently trade dependent, but the first group has more available policy options than the second group, since they could change their policy to self-sufficiency if they would wish or need so, at least from a land/water resource perspective.
3.2. Future situation in the global perspective
Depending on whether countries would opt for an increase in water consumption, cropland expansion, agricultural imports, and/or an improvement of crop productivities, in 2050 there might be between 0.3 and 5.2 billion people (4–51% of world population) requiring non-domestic water and land resources for producing the specified crop products (table 1 and figure 2). The highest global numbers are found in the A2r population scenario, followed by B2; B1 shows the lowest values. Strikingly, the differences between population scenarios are smaller than the differences between management scenarios (CUR, HIG, POT, with or without cropland expansion), demonstrating that there are huge opportunities to ensure food self-sufficiency even for a strongly growing population.
Table 1. Billions of people dependent on external water and land resources today and in 2050 for different population scenarios (A2r, B1, B2) and productivity scenarios (CUR: current productivity and management, HIG: improved productivity and management, POT: potential productivity and best management). Numbers marked in bold indicate higher values than in 2000.
| Around the year 2000 | Total population: 6.04 Dependent population: 0.95 | |||
|---|---|---|---|---|
| 2050 | Total population | Dependent population in CUR without (with) cropland expansion and increased water use | Dependent population in HIG without (with) cropland expansion and increased water use | Dependent population in POT without (with) cropland expansion and increased water use |
| A2r | 10.2 | 5.2 (2.7) | 2.8 (1.1) | 1.4 (0.5) |
| B2 | 9.4 | 4.3 (2.0) | 2.0 (0.8) | 1.0 (0.4) |
| B1 | 8.7 | 3.5 (1.7) | 1.6 (0.6) | 0.8 (0.3) |
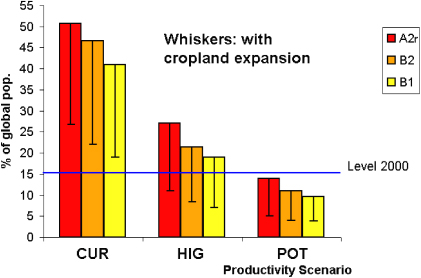
Figure 2. Percentage of global population in need of country-external water and land resources for different population scenarios (A2r, B1, B2), productivity scenarios (CUR, HIG, POT), and with and without cropland expansion (whiskers).
Download figure:
Standard imageNote that the development in dependent population is not proportional to population change, nor are the absolute differences between population scenarios comparable to the corresponding differences in dependent population. For example, for a population growth of 44–69%, we calculated in CUR without cropland expansion a 270–450% increase in dependent population (table 1); and for an absolute difference of population of 700 million people between B1 and B2 we calculated a difference in dependent population of ∼200 million people in POT without cropland expansion. This disproportion is due to the fact that the number of people dependent on external resources do not only depend on the total number of people demanding food, but also on the original resources' endowment of each country as well as on their still available (i.e. not used) water and land resources.
Figure 2 shows that only expanding cropland or only improving agricultural productivity (HIG)—i.e. without combining both—would lead to a higher percentage of population relying on external resources. Table 1 suggests that international trade will have to intensify if higher agricultural productivities (HIG) are not accompanied by cropland expansion given B1 and B2 population scenarios.
3.3. Spatial patterns of the future situation and countries at risk
In the CUR scenario the number of countries exceeding their natural boundaries rises from 66 in 2000 to 78 (B1), 84 (B2) and 87 (A2r) in 2050, mainly in Africa and the Middle East (table S1 available at stacks.iop.org/ERL/8/014046/mmedia). However, as shown in figure 3, productivity increases could potentially allow for self-sufficiency, giving the possibility of maintaining or even reducing the current dependence on other countries' resources.
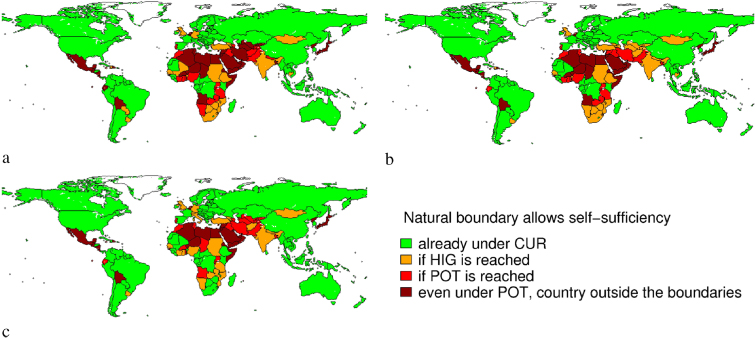
Figure 3. Countries' opportunities for reaching self-sufficiency in 2050 for the A2r (a), B2 (b) and B1 (c) population scenario. Additional use of currently unused land and water resources is accounted for. Countries coloured in orange and red are simulated to have two options for supplying their population with food in the future: improving agricultural productivity or importing agricultural goods. Countries coloured in dark red are shown to have to import agricultural goods, since their natural boundaries do not allow them to produce all products they will need, even if they improved agricultural productivity to the assumed maximum.
Download figure:
Standard image30 countries will need imports in all population scenarios, even after achieving potential productivity (POT). These are mainly situated in North Africa and the Arabic Peninsula (countries coloured in dark red in figures 3(a)–(c)). Some countries like Chad, Angola and Iran are only in some population scenarios above their natural boundary. Some countries in Sub-Saharan Africa and the Middle East would have to reach HIG or POT productivity to be able to produce what they will need in 2050, as an alternative to importing the needed products. This raises the question whether countries will be able to afford productivity increases or more imports. To shed light on this topic we studied in some more detail the low-income economies (LIE, 34 countries with $1025 or less GNI per capita, 26 of them situated in Africa; The World Bank Group 2012).
Assuming that the economies of LIE countries will not develop fast and strong enough in the next 40 years and, thus, that they will not have the financial means for improving agricultural productivity, expanding cropland or importing agricultural goods, in 2050 there would be a food security gap in those countries equivalent to 0.9–1.3 billion people (figure 4(a)). In Bangladesh, Congo, Ethiopia and Uganda the numbers are above 100 million people each (figure 4(b)). However, taking into account that conversion of natural ecosystems into cultivated areas could be made at relatively low costs (e.g. slash-and-burn) and assuming all LIE countries convert the unused, productive areas into cropland, the global number of people at risk of food insecurity would reduce to 0.5–0.7 billion, especially in Madagascar, Ethiopia and Congo but less so in e.g. Niger, Tanzania and Uganda (compare figure 4(b)). Assuming that all LIE achieve full potential productivity (POT) by 2050 in addition to full cropland expansion—which would be a huge societal and technological challenge and, thus, a very optimistic assumption—the food self-sufficiency gap will still be equivalent to about 55–123 million people (areas coloured in red in figures 4(a) and (b)), with >20 million in Niger and Somalia alone. Interestingly, the number of people 'saved' through improvement of productivities from CUR to HIG is significantly higher than from HIG to POT (compare figure 4(a)), indicating that even small yield improvements could have pronounced effects.
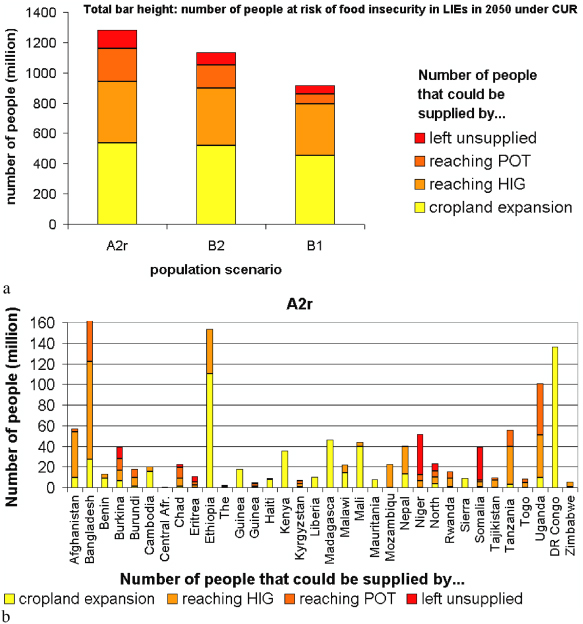
Figure 4. Global (a) and national (b) numbers of people in low-income economies simulated to be at risk of food insecurity in 2050 (total bar heights). Bars' subdivisions depict possibilities for domestically supplying those people and total bar height represents the CUR scenario. See section 3.3 for an explanation.
Download figure:
Standard image3.4. Changes from 2000 to 2050 in the level of dependence
Many countries may experience an increase in dependence compared to the situation in 2000. The range of countries with such an increase is from 5 countries under B1, POT and full cropland expansion up to 121 countries under A2r, CUR and without cropland expansion.
The number of countries with a proportion of dependent population exceeding 50% may also increase (table S2 available at stacks.iop.org/ERL/8/014046/mmedia). Notably, the difference between management scenarios is once again higher than the difference between population scenarios (maximal variation between population scenarios: 12 countries; maximal variation between management scenarios: 96 countries; see table S2 available at stacks.iop.org/ERL/8/014046/mmedia).
Tropical and subtropical countries (i.e. all besides those coloured in green in figure 5) may simply decide to import more agricultural goods (letting the proportion of population dependent on external resources increase) or opt for productivity increases and/or cropland expansion. Some countries could freely choose between increasing productivity and expanding cropland (such as China, Brazil or the UK), for others only one of both options appears feasible (e.g. cropland expansion for Chile, productivity increases for many African and Middle East countries). A third group would have to combine both options, e.g. Saudi Arabia and Mali. Finally, countries such as Bolivia, Niger and Somalia seem to have no other alternative than increasing imports and accepting higher dependence on trade. The spatial patterns are astoundingly similar in all population scenarios, especially when comparing A2r and B2 (compare figures 5(a)–(c)).
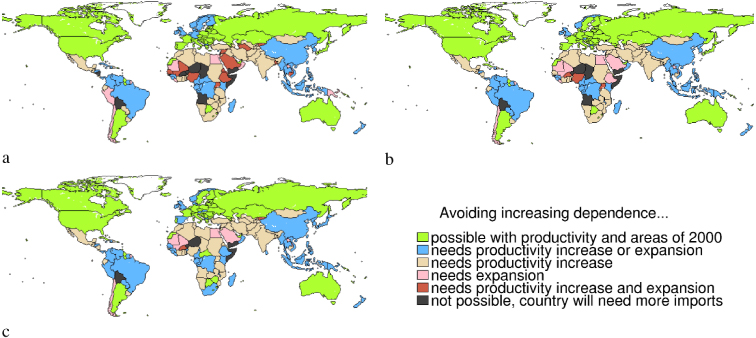
Figure 5. Opportunities for eluding an increase in the proportion of population dependent on external water and land resources assuming A2r (a), B2 (b) and B1 (c) population change by 2050.
Download figure:
Standard imageNote that figure 5 shows the opportunities of avoiding higher dependence: for example in many countries in North Africa through productivity increases, although they are already highly dependent today.
4. Discussion
4.1. General findings
In this study, we analysed water and land constraints for countries' food self-sufficiency (constrained to major crops), for the current situation and for scenarios of crop productivity increase, sustainable cropland expansion (i.e. excluding protected areas and areas worthy of protection) and water consumption increase, and future population change. Our findings suggest not only that a number of countries in (North) Africa and the Middle East are already dependent on external land and water resources but also that many may become (more) dependent in the future due to population growth, if increases in agricultural productivity are not achieved.
Currently, the food of almost 1 billion people is produced outside their countries, and 66 countries, mainly situated in Africa, were found to be unable to produce all the crop products they currently consume due to water and land constraints, even if their potentials for cropland expansion were taken advantage of. Future population growth will exacerbate this situation leading to up to 5.2 billion people dependent on external water and land resources, and thus, on international trade. Finally, up to 1.3 billion people may be exposed to longer-term food insecurity in 2050 in low-income economies (mainly in Africa), if their economic development will not allow them to afford productivity improvements, cropland expansion and/or imports from other countries.
4.2. Implications
The results presented here are based on rather simple scenarios of future crop productivity which ignore other options of adaptation, such as changes in diets between vegetarian and non-vegetarian lifestyle and potentials for waste reduction. Nonetheless, this study shows that productivity increases and cropland expansion hold substantial potential of avoiding ever-increasing dependence on international trade, even when population growth is taken into account. Still, an intensification of international trade (and thus an increase in transport emissions and dependence) may be promoted for other reasons, such as for taking advantages of lower prices, for access to goods that are only produced in some areas, or for being able to consume seasonal goods throughout the year. Those preferences and other economic factors, including comparative advantages, economies of scale, technology, capital and labour costs, may be stronger determinants of trade patterns than natural resources' endowment or trade-dependence level (see World Trade Organization (2010), but also Yang et al (2003) for an exponential relation between water scarcity and cereal imports).
Regarding the estimated future trade dependences, some implications can be drawn at regional level (country-level conclusions would require more detailed studies). First, for some countries the projected demographic development influences most the dependence on external resources: for example, Iran and Uzbekistan will have to import agricultural products in the A2r population scenario, but not necessarily in B1 or B2 (figure 3). Second, some countries in Sub-Saharan Africa and the Middle East (coloured in orange and red in figure 3) may require, additionally to cropland expansion, more imports and/or increased agricultural productivity, implying the necessity of evaluating trade-offs between these options. Third, many countries in North Africa and the Middle East may need to increase, maintain and diversify trade relations, develop the national economy to be able to afford more imports and improve infrastructure to receive, store and distribute imports (countries coloured in dark red in figure 3). Fourth, some LIEs may be at risk of food insecurity by 2050 if they cannot afford participation in trade (figure 4). A more adequate and precise quantification of this risk in national studies may help to identify solutions and adaptation options (also see Falkenmark and Lannerstad 2010). Fifth, many countries in Asia, Europe and America identified here as countries with potentials for producing surplus food (coloured in green in figure 3) may become increasingly engaged as exporters of food. However, some governmental policies may become necessary in these exporting countries in order to avoid market speculations endangering the own food security (Tsukada 2011, Sharma 2011).
As shown in figure 3, future dependence of countries on external water and land resources depends strongly on productivity increases. Even if an investigation of the feasibility of such increases is clearly out of the scope of this study, it is worth asking if they are comparable to other estimates. While HIG reaches a mean increase in agricultural production of 70% by 2050 (1% yr−1), POT assumes a ∼160% production increase until 2050 (1.6% yr−1). The annual rates are comparable with FAO estimates (between 0.6% and 2.4%, FAO (2002); Alexandratos and Bruinsma (2012)). Closing yield gaps to attainable yields may be realistic in a biophysical sense: 20–80% higher yields seem to be attainable with current technologies, especially in maize-producing regions (Lobell et al 2009); a 45–70% global production increase seems to be possible with large contributions of Sub-Saharan Africa and Eastern Europe (Mueller et al 2012, Foley et al 2011); and a tripling in crop yields in tropical Africa seems to be feasible as well (Sánchez 2010). Accounting for further factors such as reduction in waste, vegetarianism trends, higher resource use efficiency and nature conservation, Foley et al (2011) estimates an even higher potential for production increase, 100–180%. A closer look at the factors considered in our productivity increases and in other studies is provided in appendix D.
4.3. Strengths and weaknesses of this study and perspectives for future research
This study is based on the combination of simulations with the LPJmL model and up-to-date data/scenarios on land availability, future population and trade flows. To our knowledge, no other study quantifies the relation of current consumption of agricultural goods to the national water and land boundaries or the degree of national dependence on these resources in future. LPJmL is one of the most intensively tested DGVMs: a number of validation studies showed that the model performs well in estimating biomass production, carbon and water fluxes as well as agricultural production and yields (Sitch et al 2003, Bondeau et al 2007, Rost et al 2008a, 2008b, Fader et al 2010, 2011). Moreover, LPJmL dynamically calculates growing seasons, i.e. sowing and harvesting dates are not fixed (as in many other crop models) but calculated depending on climate, water availability and farmers' experience. This allows for a more realistic simulation of water fluxes and agricultural production. In addition, water and carbon fluxes and stocks are fully coupled in LPJmL, i.e. simulated water fluxes (evaporation, interception, transpiration) are more realistic than in stand-alone hydrology models and the coupled ecophysiological behaviour of photosynthesis and water fluxes is entirely consistent (Gerten et al 2004, Rost et al 2008a).
However, even if the results obtained are largely plausible (see appendix E for a comparison with other studies), the present work necessarily has some limitations, related primarily to uncertainties in the data used and to scenario assumptions. For example, our definition of available, renewable water resources is quite restrictive, since we do not account for seawater desalinization, excluded water used at present (crop irrigation, domestic and industrial use), reserved water quantities for sustaining environmental flows and accounted for reduction of availability through spatiotemporal variability of water resources. Inclusion of these optional (yet mostly unsustainable) water uses could be addressed in dedicated trade-off studies.
Also our definition of available land for cropland expansion is restrictive, since we excluded areas worthy of protection (intact and frontier forest: ∼1517 Mha). However, including them as available for cropland expansion would not only be an unsustainable definition of available land, but also be unrealistic, since they are frequently far away from settlements and especially from transport infrastructure needed to access those areas (Bryant et al 1997).
In sensitivity analyses we evaluated our results using other water and land availability calculations (data not shown): considering areas being protected and areas worthy of protection as available for agricultural expansion, omitting environmental flows requirements, not considering spatiotemporal mismatch of water and land resources, and considering statistical instead of simulated data for renewable water resources. From these analyses it can be inferred that only a few countries show notable differences in the key results presented here if the sustainability criteria are relaxed. Thus, the results shown in the former sections are mainly robust.
Investigation of climate change and CO2 fertilization effects on water use, crop growth and growing seasons was beyond the scope of this study. These processes may however affect future water and land availabilities, even if their effects are frequently smaller than those of population change (Vörösmarty et al 2000, Rockström et al 2009, Gerten et al 2011).
We emphasize that this study considered productivity increases and land/water requirements of the 11 major crop types of the world. Even if the growing areas and irrigation water consumption of all other agricultural commodities were taken into account, which were kept constant in HIG and POT, the production increase needed for those commodities was not considered. LPJmL is being developed further to simulate more crop types and also the livestock sector (see Gerten et al (2011) for first steps in this direction). This will also allow for analyses of potential future diet changes per country, such as shifts towards more milk and meat consumption with rising income (e.g. Steinfeld et al 2006). Those shifts are very likely to exacerbate trade dependence for land-/water-limited countries, since the lower conversion efficiencies require higher inputs of feed crops for the same production of calories (Stehfest et al 2009).
Due to lack of data relating sub-national trade flows as well as uncertainty related to future irrigation expansion and degree of fertility of uncultivated areas, we used country averages of crop yields and water productivities for the newly cultivated areas in the scenarios of cropland expansion. Thus, results for big, heterogeneous countries such as China, Russia and the US that were found to be able to be self-sufficient in future, even under current productivities, may be too optimistic, since the most suitable areas of these countries are probably already under cultivation.
We like to note that this study was not designed to provide projections of food supply by the middle of this century. Its purpose is rather to quantify the extent to which still available water and land resources constrain countries' capacity to grow on their own territory the crop products consumed by their inhabitants. As such, it paves the way for more elaborate analyses and, particularly, sheds light on the importance of international trade to global food security. On the one hand, international trade may assist in increasing sustainability by managing resources across borders. On the other hand, dependence of countries on resources outside of their territories—by necessity, not by choice—indicates the extent to which globalization effects have already led to lock-ins into particular types of international structures, the maintenance and security of which is then a matter of substantial importance.
Acknowledgments
This study was funded by the German Ministry for Education and Research (BMBF) through the projects 'Sustainable water management in a globalized world' and GLUES, and by the Leibniz-Pakt für Forschung project 'BioenergyPlanet'. We thank Sibyll Schaphoff, Jens Heinke, Hermann Lotze-Campen and Alberte Bondeau for valuable discussions, comments, and technical support; Christoph Schmitz for fruitful comments on land use data integration and future productivity increases, and two anonymous reviewers for the constructive comments. We also thank the Commodity Trade Statistics Database for the trade data, IIASA for the provision of population data, and Felix Portmann for the provision of the MIRCA2000 dataset.
Appendix A.: Literature review and how our study advances the current state
A number of recent studies have provided information on particular countries' potentials for land and water productivity increases and interpreted these in terms of their dependence on other countries: Thus, 36% of the world population could be living in countries not able to be self-sufficient in terms of food production by 2050 (Rockström et al 2009) and the number of people living in regions unable to produce enough food on current croplands and where the import potential may be limited by weak national wealth level could reach 3.8–4.2 billion by 2050 (Falkenmark et al 2009).
These studies do not consider actual, country-specific consumption of crop products. They are based on nutritional requirements derived for a balanced diet (3000 kcal per capita and day for all people). However most people do not eat what they nutritionally need; quantity and type of consumption is linked to culture, income, socioeconomic conditions, fashions and other factors (e.g. Wang 2001, Hesse-Biber et al 2006). For this reason, the present study is focused on present diet composition (expressed as the sharer of major crop products in these diets).
As opposed to the present study, they also did not take into account that goods are not necessarily produced in the same country as that in which they are consumed and assumed constant water productivity increases, irrespective of the geographical conditions and current productivity levels. In the present study water and land productivity is simulated spatial explicitly and in a process-based manner.
Other studies have dealt with countries' dependence on external resources more explicitly. Using the ratios between external water footprint to total (sum of country-external and -internal) water footprint and external renewable water resources to total renewable water resources in order to define water dependence of countries, Egypt, The Netherlands, Jordan and the UK, among others, were found to be highly dependent on water resources in other countries (Hoekstra 2009). However, in contrast to our study, land resources, population growth and potential productivity increases were not accounted for. Considering land resources when defining dependence is important in this context, as Kumar and Singh (2005), Wichelns (2010) and Fader et al (2011) have recently pointed out. Other authors calculated self-sufficiency ratios by dividing imports or domestic production by total consumption in mass, calories or economic units. Following such an approach, Japan (Honma et al 2000), South Asia (Chand 2006) and the Gulf States (Kotilaine 2010) were presented as highly dependent regions. These studies, however, used static indicators that do not consider natural resources availabilities (sometimes completely uncorrelated with international trade), population growth and potential productivity increases, all factors that were considered in the present study.
Appendix B.: Calculation of water and land availability
Countries' renewable water resources (RWR) were calculated in the LPJmL model as the sum of surface and subsurface runoff, water stored in aquifers, lakes and reservoirs and inflow of discharge from other countries, as an annual average for the period 1970–2000 given the land use pattern of around the year 2000. Fossil (i.e. non-renewable) groundwater was excluded. LPJmL's RWR are comparable with other estimates (LPJmL: 48 292 km3, FAO 2003 (AQUASTAT) 2003: 53 998 km3, Gleick 2000: 55 375 km3).
In order to estimate the amount of RWR that is currently available and, thus, could be used for irrigated agriculture, we subtracted the current municipal and industrial water consumption at country level as reported by FAO (2003) for the year 2000. We also subtracted the irrigation water that is used currently for agriculture, i.e. the sum of water evaporation, transpiration and interception of irrigation water during the growing periods of the 11 CFTs and the 'other crops'. Moreover, it was assumed that 60% of RWR is not accessible to humans. This is an standard assumption that accounts for the fact that spatiotemporal variability of water availability does not always match water demand, and includes 30% of RWR assumed to be reserved for the functioning of ecosystems, i.e. as environmental flows (Smakhtin et al 2004, Vörösmarty et al 2000). The result of these calculations is referred to herein as available renewable water resources (ARWR). ARWR can become negative if a country makes use of non-renewable water resources, in this case it was set to zero (see figure B.1(a) for the spatial patterns).
In order to determine the area available for potential conversion to cropland in each country (AL), we subtracted from the total area of each country the following areas: urban land; land used for forestry production; unproductive, unused land (production <20 gC m−2); least productive grazing land (production between 20 and 200 gC m−2) (all from Erb et al 2007); total cropland (i.e. sowing area of the 11 CFTs and 'other crops' considered in LPJmL); managed grassland (both from Fader et al 2010); protected areas (IUCN classes I and II, from UNEP-WCMC 2007); and areas worthy of protection (the union of Greenpeace's Intact forest landscapes and WRI's frontier forest, see Greenpeace International (2005), Bryant et al (1997)). All data except for total cropland and managed grasslands were prepared, harmonized and corrected by Krause et al (2013). We note that the datasets for managed grasslands (based on Ramankutty et al 2008, see Fader et al 2010) and the least productive grasslands (based on Erb et al 2007, see Krause et al 2013)—both excluded from AL—could overlap in some regions, since the latter does not differentiate between managed and natural grasslands. Such overlap probably led to low land availabilities in parts of Africa, the US and Central Asia. Excluding, however, one of these categories in sensitivity analyses led to a clear overestimation of land availabilities, especially in Africa, such that the results shown bellow represent the best approximation given the land use datasets available (see figure B.1(b) for the spatial patterns).
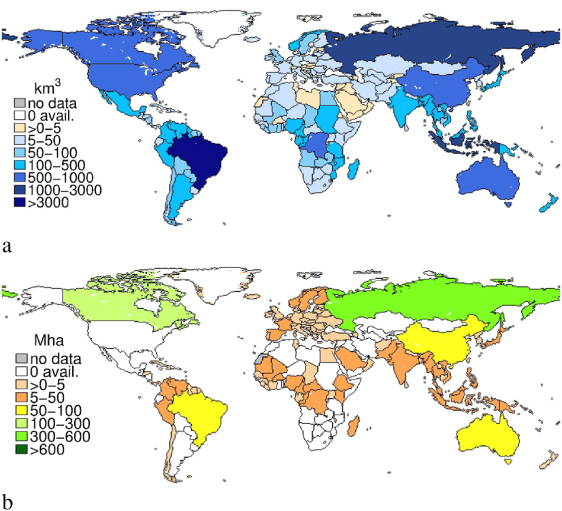
Figure B.1. Available (i.e. not used and accessible) renewable water resources (a), and land (b). Global values are 17 953 km3 and 1322 Mha, respectively.
Download figure:
Standard imageGlobal values of ARWR and AL are 17 953 km3 and 1322 Mha, respectively.
Appendix C.: Calculation of the level of dependence and number of people dependent
C.1. Calculation of the level of dependence in 2000
The national natural boundaries are transgressed when a country would need more water/land than is domestically available to reach self-sufficiency. We calculated the required water consumption increase (WCI) as percentage of the available, renewable water resources of the country and the required cropland expansion (CE) as percentage of the available, productive land:


where net water and land savings (NWS, NLS) are the amount of land and water that a country 'saves' or 'loses' through trade, or the other way around, the amount of water that it would need or release if it would not trade (no imports, no exports). NWS, as defined by equation (20) in Fader et al (2011), is computed as the volume of virtual water currently exported minus the water that would be needed to produce import goods. Analogously, NLS is computed as the virtual land currently exported minus the land that would be needed to produce import goods (see equation (21) of Fader et al (2011)). NLS and NWS depend on the amount of crops imported and exported and on the own productivity of land (crop-specific yields) and water (amount of water needed to produce one unit of a crop) and have per definition the same sign for a give country. The sign of the balances are inverted due to the fact that a negative balance would mean a needed increase in sowing area or water consumption. Note that trade and production of the LPJmL categories 'other crops' and 'managed grasslands' (basically representing beverages and the livestock sector) were not taken into account; but, importantly, their growing areas and their irrigation water consumption were considered when calculating available water and land resources (see appendix B).
If CE or WCI < 0, no cropland expansion or water consumption increases would be needed to reach a self-sufficient production. Positive values of CE and WCI indicate the proportion of the available resource that would have to be used. If CE or WCI > 100%, the country would not have enough available land and water to fulfil the production requirements. That means that the country's consumption is above its natural boundary/ies. CE and WCI do not have to correlate (even if they do in a number of countries), i.e. a given country with enough available water resources may not have enough arable land to be self-sufficient, and vice versa.
C.2. Calculation of the level of dependence in 2050
For the CUR scenario we added to the current NLS and NWS the requirements due to population change under A2r, B1 or B2.
where Im,P and Ex are the imports, production and exports in 2000, Popgrowth is the population development factor (e.g. −0.2 for 20% population reduction), and  and
and  are the mean, CFT-specific yield (t ha−1) and virtual water content (m3/t) in CUR, respectively.
Note that the results can become negative should population decrease allow for a reduction in cropland/water consumption. In this case, we set CE and WCI to zero.
For the POT and HIG scenarios, the following calculation was performed for each country:
where PExp is the production expected in each scenario (depending on the population in 2050 after the three population scenarios), Pact is the actual production in HIG or POT and  is the average (rainfed, irrigated) yield of HIG or POT.
Note that CE can become negative should the productivity increases allow for a reduction of land under cultivation. In this case, we set CE to zero.
The water consumption increase in HIG and POT was calculated as:
where E is the current water consumption as the sum of transpiration, evaporation and interception loss during the growing period of the 11 CFTs. Eact is the water consumption in HIG or POT.  is the average (rainfed, irrigated) virtual water content of the analysed country in HIG or POT (VWC is the amount of water needed to produce a unit of crop; Fader et al (2010)). In the case that the productivity increases would allow for reduction of water consumption (WCI < 0), we set WCI to zero.
As in the case of 2000, positive values of CE and WCI indicate the proportion of the available resource that would have to be used. If CE or WCI > 100%, the country would not have enough available land and water to fulfil the future production requirements and would depend on imports from other countries.
C.3. Calculation of the number of people dependent on external resources in each scenario
For assessing the number of people whose food is produced with land and water resources situated outside their countries at national and global level, we first calculated the land and water requirements per capita (LReq, WReq) as sum of the requirements to replace imports and the requirements for maintaining the part of the production consumed domestically divided by the total population number. This number depends obviously on the productivity scenario (CUR, HIG, POT). It is assumed that there are no differences in diets within each country and that the diet composition in 2050 does not differ from the composition in 2000.
LReq are thus:
- For CUR: (current sowing area + NLS)/population.
- For HIG and POT: (current sowing area + CE)/population (see nominator of equation (C.5)).
Analogously, WReq are:
- For CUR: (E + NWS)/population.
- For HIG and POT: (E + WCI)/population (see nominator of equation (C.6)).
After that, we divided the absolute land expansion and water consumption increase in each scenario by the per capita requirements, obtaining the amount of people affected in each case:
The absolute land expansion (aLE) is:
- At present: NLS (when negative).
Future:
- In case of no expansion and for current productivities: NLS (when negative), adjusted linearly to population growth (see nominator of equation (C.3)). This will be called NewNLS.
- In case of expansion and for current productivities: NewNLS(−1) − AL (when NLS negative), i.e. the part of NLS that cannot be fulfilled after expansion to the available productive land, adjusted linearly to population growth.
- In case of no expansion and for higher/potential productivities: CE: (see nominator of equation (C.5)).
- In case of expansion, an for higher/potential productivities: CE–AL, i.e. the part of CE that cannot be fulfilled after expansion to the available productive land.
The absolute water consumption increase (aWE) is:
- At present: NWS (when negative).
Future:
- In case of no water consumption increase and for current productivities: NWS (when negative), adjusted linearly to population growth (see nominator of equation (C.4)). This will be called NewNWS.
- In case of water consumption increase and for current productivities: NewNWS(−1) − ARWR (when NWS negative), i.e. the part of NWS that cannot be fulfilled after increase of water consumption to the available renewable water resources, adjusted linearly to population growth.
- In case of no water consumption increase and for higher/potential productivities: WCI: (see nominator of equation (C.6)).
- In case of water consumption increase, an for higher/ potential productivities: WCI–ARWR, i.e. the part of WCI that cannot be fulfilled after increase of water consumption to the available renewable water resources.
Appendix D.: The productivity increases of HIG and POT in the literature context
In this study, productivity increases were calculated assuming improved or optimal agricultural management on current croplands, including, among others, nutrients supply, pests and diseases control and the use of high yielding varieties (see sections 2.1 and 2.2 for more details). While HIG reaches a mean increase in agricultural production of 70%, POT assumes about 160% production increase until 2050, with mean annual increases of 1% and 1.6%, respectively. These rates are comparable with other estimates: FAO prospects for annual productivity increases between 0.6 and 2.4%, (FAO 2002, Alexandratos and Bruinsma 2012); potentials for 20–80% yield increases with current technologies (Lobell et al 2009); 45–70% potential global production increase (Mueller et al 2012, Foley et al 2011); field experiments showing a tripling of crop yields in tropical Africa (Sánchez 2010). But a closer look to the factors considered in those estimates is worthwhile.
On the one hand, the most efficient agricultural management as assumed in POT may not be economically worthwhile or reachable in many regions due to socioeconomic and political factors such as investment situation, institutional functioning, lack of knowledge, risk aversion and lack of infrastructure (Godfray et al 2010, Lobell et al 2009). This may have led to an overestimation of productivity increases in many areas, especially in developing countries.
On the other hand, we may have underestimated productivity increases by not considering genetic developments and reduction of food waste. While it is very difficult to estimate the contribution of the first one, the latter has the potential of adding up to 50% to global food production or reducing the use of water, land and fertilizers by around one quarter (Foley et al 2011, Godfray et al 2010, Kummu et al 2012). In a per capita basis, developed countries waste more food than developing countries, especially at the consumption stage. Food is lost in developing countries especially at early stages of the food chain due to e.g. lack of storage infrastructure (Gustavsson et al 2011). Thus, both cases show potentials for waste reduction but measures have to be designed according to system-specific needs.
Diets are also a very important factor. With future economic and population growth we expect a rise in demand for animal calories (e.g. Steinfeld et al 2006), leading to lower efficiency in the production of calories and to higher resources use. This may partly compensate yield increases (Gerbens-Leenes and Nonhebel 2002, Kastner et al 2012). However, inverting this trend towards vegetarian diets hides a potential of 28% production increase or 49% calories supply increase (Foley et al 2011, Godfray et al 2010).
Finally, future productivity increases will have to be made in a sustainable way, avoiding the well-known negative effects of past intensification (resources overexploitation, pollution, greenhouse emissions, loss of biodiversity and ecosystem services, etc). This study makes a contribution to this agenda by excluding protected areas and areas worthy of protection for agricultural expansion and reserving water for environmental flows. In addition to this, some studies indicate that productivity increases are also possible with agroecological techniques but this topic needs further research (see e.g. Pretty et al 2006, Seufert et al 2012).
Accounting for many of these factors Foley et al (2011) estimates a potential increase in global food production of 100–180%, highlighting that a combination of strategies, rather than a single solution pathway, may be the most adequate way to go. However, regional and local studies are needed to realistically estimate the potential productivity increases in each country.
Appendix E.: Comparison with other estimates
Our results are compatible with particular findings from previous studies that used other methods. For example, a high dependence (defined as the ratio of external water footprint to total water footprint >50%) was shown for Italy, Germany, Japan, the UK, Jordan and The Netherlands (Hoekstra 2009). That author's definition is different from ours and does not consider water availabilities, nonetheless there are some similarities in the findings: both studies classify Germany, Japan, Jordan and The Netherlands as being dependent on country-external water resources. However, in our study the dependence of the UK and Italy is only high (CE > 50%) in case of land resources.
The Gulf States were presented as being very dependent on agricultural imports (ratio of imports to consumption >89% for wheat, maize, rice and pulses) and connected to this, as vulnerable to external price shocks (Kotilaine 2010). Our results, even if calculated with a different approach, affirm this picture, showing high water and/or land dependence for all Gulf States (figures 1(a) and (b)).
The so-called 'national ecological deficit' is defined as the difference of ecological footprint (the area of productive land and aquatic ecosystems required to produce the resources used and to assimilate the wastes produced) and ecologically productive land divided by population (Rees 1996). This is similar to our estimates for CE in per cent of available productive land. The highest national ecological deficits were calculated for The Netherlands (1900%), Belgium (1400%), Korea (950%), Germany (780%), Japan (730%), Switzerland (580%), Denmark (380%), France (280%) and Austria (250%) (Rees 1996). Our calculations for those countries reveal that as well. The Netherlands (1124%), Belgium (317%), Japan (301%) and North Korea (527%) do not have enough land resources to produce what they currently consume. The difference for the rest of the countries, and the reason for our lower estimates, is probably the fact that his results consider all commodities and also the area required for waste assimilation.
In regards to national studies, high dependence was shown for the UK, with a food self-sufficiency index of 58% (defined as the value of domestic production as share of national consumption) (Cooper 2007). Our study shows a high dependence on virtual land imports, while the water dependence is relatively low (figure 1(b)). The self-sufficiency ratio (calories produced domestically divided by calories imported) of Japan was shown to be 41%, the lowest value among developed countries (Honma et al 2000). Indeed our study showed a very high dependence on virtual land imports (figure 1(b)). India's traditional policy of self-sufficiency leads to low current dependence on external resources (see e.g. Chand 2006), in good agreement with our results. Nevertheless, as reflected by the evaluation of the National River Linking Project which aims to link 37 rivers in India to assure food production for the rapidly growing population (Verma et al 2009), its dependence on imports could grow considerably, and would only be low if productivity increases were achieved (figure 3). Concerning Tunisia, we calculated land and water requirements for self-sufficiency under current productivities to be higher than the available resources. This means that Tunisia is already dependent on virtual water and land imports (figure 1(b)). This situation will worsen under population change if strong improvements of agricultural productivities were not to materialize (figure 3). This is in good agreement with the study by Besbes et al (2010) that projects increasing dependence of Tunisia in absence of strong productivity increases, calculating water dependency indices (virtual imports/total use) of 31% (currently) and 42% (population change).
Our study projects 3.5–5.2 billion people to be dependent on external resources by 2050, with these living mainly in Africa and the Middle East, and when taking into account population growth but no improvement in agricultural productivity or cropland expansion (table 1). This is similar to other estimates for the future: (a) 3.8–4.2 billion people living in countries in need of cropland expansion due to lack of financial means for imports by 2050 (Falkenmark et al 2009). (b) 3.93 billion people living in countries not able to be self-sufficient by 2050 (Rockström et al 2009), (c) 5 billion people living in countries with agricultural water deficit by 2050 (Falkenmark and Lannerstad 2010). Note, however, that these studies worked with standard diets rather than actual consumption and estimated water productivity increases and in some cases water requirements as global estimates without accounting for country-specific conditions.