


Abstract
We investigate the two-dimensional Fermi surface of high-mobility LaAlO3/SrTiO3 interfaces using Shubnikov-de Haas oscillations. Our analysis of the oscillation pattern underscores the key role played by the Rashba spin–orbit interaction brought about by the breaking of inversion symmetry, as well as the dominant contribution of the heavy dxz/dyz orbitals on electrical transport. We furthermore bring into light the complex evolution of the oscillations with the carrier density, which is tuned by the field effect.
Export citation and abstract BibTeX RIS

Content from this work may be used under the terms of the Creative Commons Attribution 3.0 licence. Any further distribution of this work must maintain attribution to the author(s) and the title of the work, journal citation and DOI.
The conducting interface between the two band insulators LaAlO3 (LAO) and SrTiO3 (STO) has drawn a lot of attention as it presents a variety of exciting properties, among them superconductivity and a large spin–orbit coupling, both being tunable by an electric field [1]. As the 2DEG lies on the STO side, the conduction band of the system is dominated by the Ti  orbitals as for bulk STO. However, at the interface, quantum confinement spectacularly alters the orbital ordering of the energy levels, as observed by x-ray spectroscopy [2]: for a given sub-band index, the states with predominantly dxy symmetry have, on average, a lower energy than states derived from the dxz/dyz orbitals. Currently, experimental and theoretical estimates of the out-of-plane extent of the 2DEG vary from a few monolayers [3–5] to 10 nm [6–8] and, consequently, the number and precise energy arrangement of these sub-bands is still an open question. The asymmetric confining potential also brings about a breaking of inversion symmetry: its effect is to spin-split the electronic bands (Rashba effect) [9–11] with important consequences on the magnetotransport of the system [12–14].
In this letter, we report the observation and analysis of Shubnikov-de Haas (SdH) oscillations in high-mobility and low carrier density ( ) interfaces. Quantum oscillations show two frequencies that we contend are due to the splitting of an electronic band induced by the Rashba spin–orbit interaction (SOi). The estimated SOi energy is comparable to the Fermi energy (
 ), defining an unusual regime when compared to semiconductor 2DEG. Electric field effect experiments also reveal that the evolution of the Landau levels (LLs) that is observed as one changes the carrier density is singular.
The LAO layers were grown by pulsed laser deposition at  , a lower temperature than for standard interfaces [15]. Hall bars for dc transport measurements were patterned and field-effect devices were realized using the STO single crystal substrate as the gate dielectric (see supplementary data). Magnetotransport measurements were performed in a dilution refrigerator equipped with a 8 T superconducting magnet.
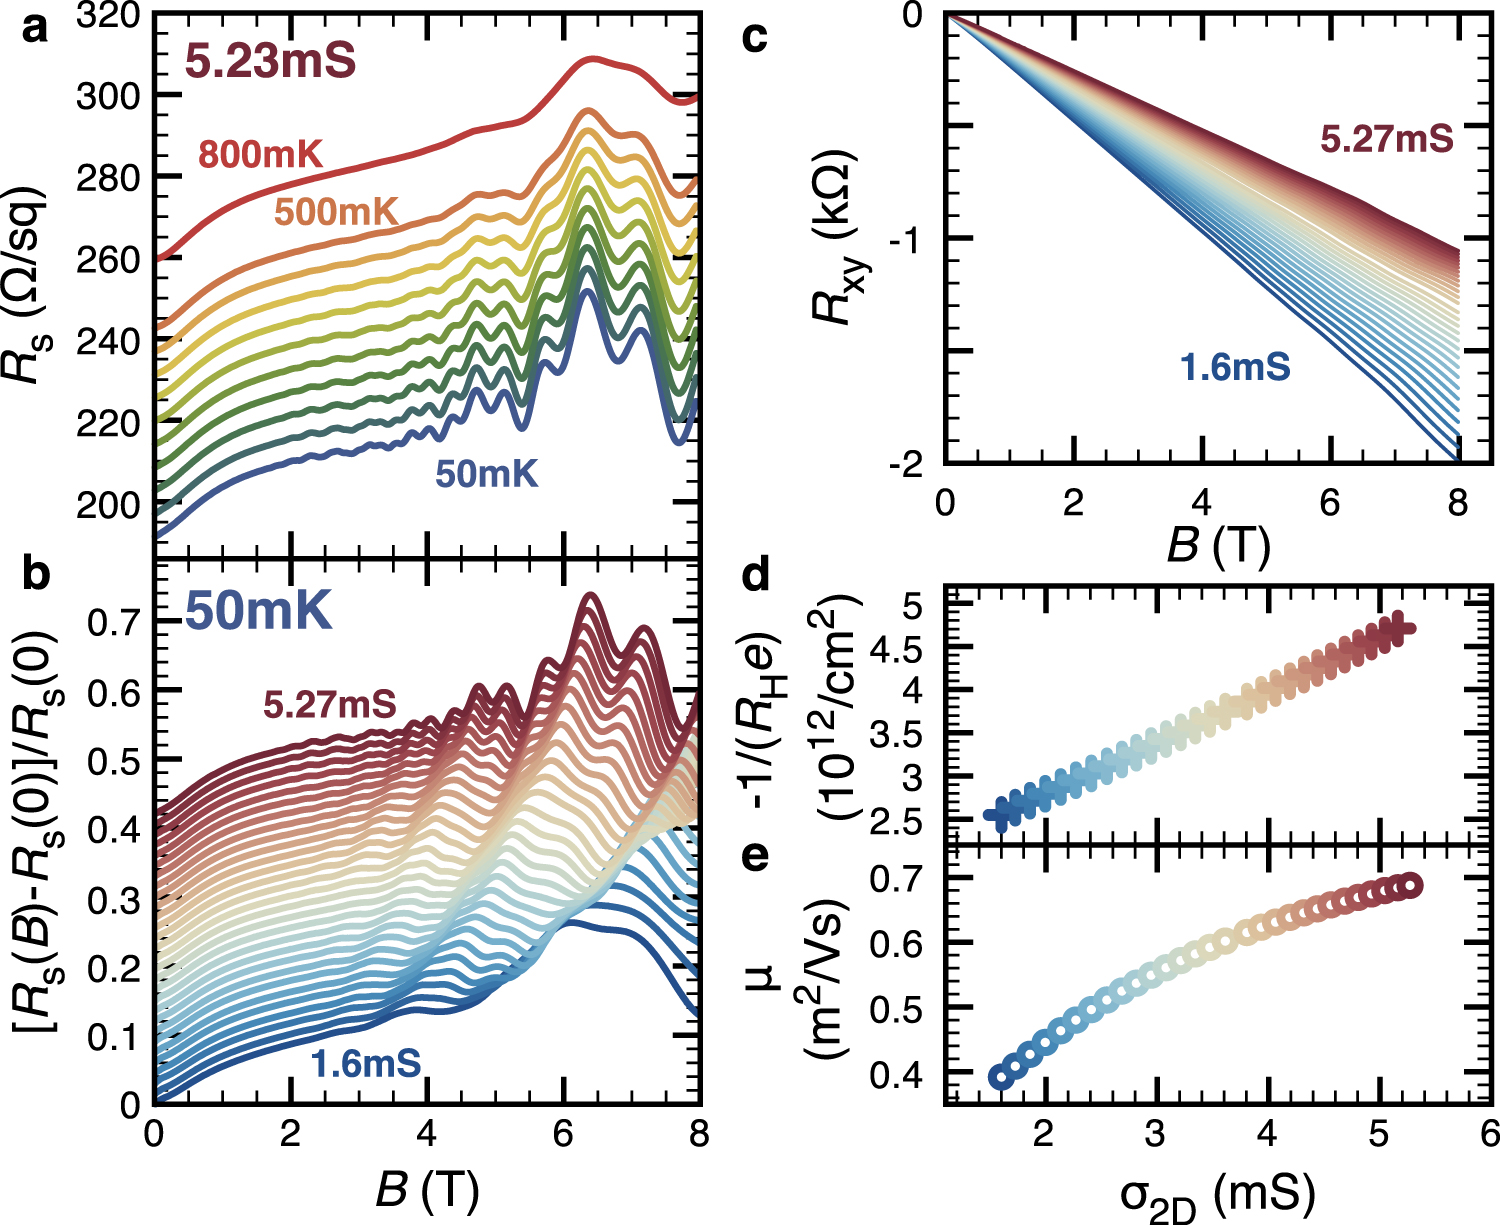
Figure 1(a) displays a set of sheet resistance versus magnetic field (B) curves for temperatures ranging from 800 to 50 mK. As can be seen, the magnitude of the SdH oscillations increases markedly as the temperature is lowered. At 50 mK and in high magnetic field, the amplitude of SdH oscillations is about 10%–15% of the sheet resistance value. To change the carrier density, we apply a back-gate voltage3 figure 1(c) shows that upon carrier density tuning the transverse resistance Rxy varies linearly with magnetic field. From figure 1(d), we see that ramping the gate voltage (Vg) up to large positive values leads to an increase of the inverse Hall coefficient. Analysing the Hall signal using a single-band model, we extract a carrier density at  that increases from 2.5 to
  as Vg is swept from 79 to 107 V, i.e. as the sheet conductance (
 ) at 0 T increases from 1.6 to 5.27 mS. Concomitantly with this variation of the electron density, the electron mobility μ evolves from 3900 to
  , as shown in figure 1(e) [14, 16, 17]. We note that these samples exhibit
  (μ) that are smaller (larger) than standard samples. Moreover, the modulation of the carrier density and mobility by electric field effect does not induce a transition from linear to nonlinear Hall effect.

Figure 1. Transport properties in a magnetic field. (a) Temperature evolution of the sheet resistance (Rs) versus magnetic field for a doping level corresponding to a sheet conductance of 5.23 mS and a mobility of  at 50 mK. Curves are offset for clarity. In this paper, the sheet conductance at 50 mK and
  (
( ) is used as a reference for the doping level. (b)
 ![$\left[ {{R}_{{\rm s}}}(B)-{{R}_{{\rm s}}}(0) \right]/{{R}_{{\rm s}}}(0)$](https://content.cld.iop.org/journals/1367-2630/16/11/112002/revision1/njp504613ieqn15.gif) for different dopings, illustrating the evolution of the SdH oscillations with gate voltage. Curves are offset for clarity. (c) Hall resistance versus magnetic field at 50 mK for different dopings. (d) Inverse Hall coefficient and (e) the corresponding Hall mobility at 50 mK versus
for different dopings, illustrating the evolution of the SdH oscillations with gate voltage. Curves are offset for clarity. (c) Hall resistance versus magnetic field at 50 mK for different dopings. (d) Inverse Hall coefficient and (e) the corresponding Hall mobility at 50 mK versus  .
.
Download figure:
Standard image High-resolution imageAs can be seen in figure 1(b), the changes in electron mobility and density strongly modify the structure of the SdH oscillations with a clear change in both the peak position and the period of the oscillations.
In order to proceed with the analysis of the SdH data presented in figure 1, we subtracted the background:
with Rs(B) and Rxy(B) the measured longitudinal and transverse resistances, respectively, and  a non-oscillating polynomial background. Examples of the resulting curves can be found in figure 4.
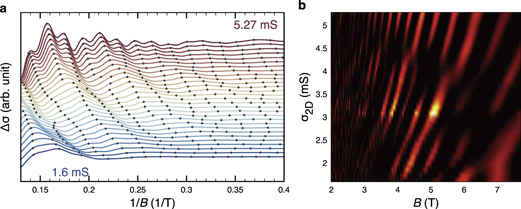
Figure 4. (a) Analysis of the doping dependence of the SdH oscillations. Curves are shifted for clarity. Black dots indicate the position where maxima occur in  . (b) Fan diagram showing
  ; yellow corresponds to the maxima and black to negative values.
Download figure:
Standard image High-resolution imageLooking at the SdH oscillations, we note (at least) two frequencies modulating the conductance. Hence, we first analyse the data considering a model with two parabolic bands for which the magnetoconductance can be calculated using the Lifshitz–Kosevich (LK) formula [18]. We fit the data for the largest conductance introducing an arbitrary phase for each frequency.
As can be seen from figure 2(a), a good fit to the data can be obtained using the two frequencies 18 T and 55.9 T.4
Panel b displays the derivatives of the theoretical and experimental curves allowing the positions of the maxima and minima to be compared. Considering the Onsager relation with a spin degeneracy of  and a valley degeneracy of
  , we find the carrier densities for the two bands to be 0.87 and
  , which yield a total carrier concentration of
  .
.
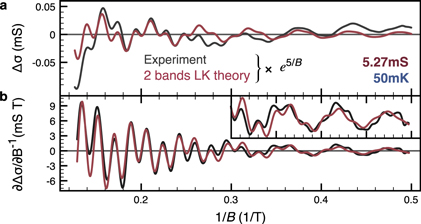
Figure 2. (a) Comparison between  versus
  calculated within the two-band model (red) and the experimental data (black) for the doping with the highest conductance (5.27 mS) and at
  . The exponential factor
  is used to magnify the low-field region. (b) Derivative with respect to
  of the curves presented in (a). (inset) Close-up on the low-field region of (b).
Download figure:
Standard image High-resolution imageIn the LK formalism, the temperature evolution of the oscillations can be directly related to the effective mass of the oscillating carriers. We extracted the high and low frequency (HF and LF) parts of the SdH oscillations shown in figure 2(a). Selecting 17 and 4 extrema for the HF and LF, respectively, good agreement between theory and experiment is obtained by choosing an effective mass of  for the HF and
  for the LF (see supplementary data).
With the information extracted from this analysis, the electronic structure of our two-band model can be reconstructed and the splitting at the Fermi level between the heavy and the lighter bands determined:

 is the Fermi momentum in the ith band obtained from the area
  calculated using the Onsager relation, and
  . We find
  .
.
The band structure obtained in the above two carrier model predicts a heavy band with a higher binding energy than the light one. This is in apparent contradiction with the well documented observation of orbital reconstruction at the LAO/STO interface [2].
Another possible scenario is that the calculated band splitting  is in reality the Rashba spin–orbit splitting estimated for LAO/STO heterostructures [12, 13]. In what follows, we hence consider a model consisting of a single parabolic band split by the Rashba SOi.
In a Rashba scenario, the SOi splits the LLs of a single band into two families (±) of irregularly-spaced levels. These energy levels are labeled by an integer  and read, for an isotropic Fermi surface and a k-linear splitting [20]:
 ,
,  is the Zeeman splitting,
  with α the Rashba coupling constant. The N = 0 state is fully spin-polarized, and the two series of LLs with
  correspond to orthogonal mixtures of spin-up and spin-down states.
To compare the data with this second model, we computed numerically the DOS, the chemical potential, and the conductance for each magnetic field and temperature, using the formalism of [21]. We considered a Gaussian broadening of the LLs with a variance  . The results are displayed in figure 3. As can be seen, good agreement between the data and the theory is obtained (see supplementary data).

Figure 3. (a) Comparison between  measured experimentally for
  mS (black) and calculated using our single-band model with Rashba and Zeeman interactions (green). (b) Derivative with respect to
  of the curves presented in (a). The exponential factor
  is used to magnify the low-field region. (inset) Close-up on the low-field region of (b). (c) Temperature dependence of the oscillations over the two ranges of applied field used to extract the effective mass. Black dashed lines are the theoretical curves computed using
  , while the thick coloured lines are the experimental data. (d) Magnetic field dependence of
  (top) and
  (bottom). Red and green dots correspond, respectively, to the estimation made via the band pass filtered and differentiated signals. The background is a color plot based on the short time Fourier Transform of
  . (e) Summary of the fitting parameters.
Download figure:
Standard image High-resolution imageThe carrier density extracted from this analysis is  , lower than the one found using the Hall effect measurements. The magnitude of the obtained Rashba coupling constant (
 ) agrees very well with values obtained from weak localization analyses and from modelling of the transport data in parallel fields [12–14]. We note that, given the small value of
  in our samples, a k-cubic Rashba interaction inducing a spin-splitting of
  would require a very large coupling constant, beyond values recently reported [22].
To obtain the effective mass, we selected three peaks from a region of magnetic fields where the amplitude of the oscillations is large. Figure 3(c) shows that the data can be fit perfectly using an effective mass of  . This value may indicate that the electronic state of the oscillating carriers is not dominated by Ti dxy orbitals, as one would then expect a lower effective mass (
 ). Instead, the higher mass obtained in this analysis can be understood by taking into account the contribution of dxz/dyz orbitals to the electronic states. We note that a recent analysis of photoemission spectra for interfaces grown at
  , complemented by ab initio calculations, was consistent with a 2DEG having occupied dxz/dyz electronic states at the Fermi energy [23]. This observation corroborates our recent results on standard LAO/STO interfaces, where a sharp decrease in the elastic scattering rate was correlated to the progressive appearance, at the Fermi level, of heavier carriers [14].
A lingering question pertains to the explanation of the lower carrier density and high mobility that are measured in samples prepared at low growth temperature, as compared to the 'standard' ones discussed in the introduction. A puzzle related to this issue concerns the systematic discrepancy in the value of the carrier concentration that one finds when comparing Hall and SdH data [15, 19]. One may surmize that these observations point to the critical role played in transport by the two different types of electronic orbitals of the  triplet. Spectroscopies and DFT calculations show that dxy states are located close to the interface where disorder and lattice distorsions likely result in low mobility [5]. Heavy dxz/dyz sub-bands extend deeper into the STO bulk and hence are less sensitive to these effects, giving rise to a much higher mobility; the presence of a large Rashba splitting could further help explain an enhancement of this mobility due to protection against backscattering. While both types of orbital can contribute to the magnetoresistance (analysis of our high-mobility samples support that), only the heavy dxz/dyz states have a high enough mobility to sustain SdH oscillations in our accessible range of magnetic fields.
Because the Zeeman energy enters equation (3) only as a squared term, for the LLs with  , we find two solutions for the g*-factor, namely 5.2 or −3.4, values similar to the ones observed in semiconductor heterostructures. We note that g*-factors significantly different from two were predicted by ab initio calculations in bulk STO [24]. In this second scenario, we can also estimate the Rashba splitting and the Fermi energy. Interestingly, we find that both are of the same order of magnitude:
  and
and  , a situation very different from the one of many semiconductor 2DEGs, where the Fermi energy dominates.
Owing to the complexity of the Rashba LLs spectrum, the oscillation frequencies ( ,
,  now linked to the − and + levels) are predicted to be field dependent [25, 26]. We have estimated, from the data,
  and
and  as a function of magnetic field using three different procedures (see supplementary data). Figure 3(d) shows the estimated
  and
and  as a function of
  on top of the theoretical prediction (thick orange line). A very good agreement is obtained both in the amplitudes and in the signs of the frequency variations. We surmize that the field dependence of
  and
and  is the reason why the low field region of the quantum oscillations is fitted better by the Rashba model than by the two-band model (compare plots in inset of figures 2(b) and 3(b)). The fact that the pseudo-frequencies
  and
and  depend on B is pointing to SdH oscillations originating from a Rashba spin-split band and not from two bands.
We finally discuss the gate-voltage dependence of the SdH oscillations. Figure 4(a) shows the change in conductance as a function of  for various Vg (i.e.
  ). A clear evolution of the SdH oscillations with decreasing doping is visible and is compatible with the shrinking of the Fermi surface expected from Hall measurements. With the help of the second derivative
  which amplifies
  , we identify all maxima from the '+' levels as a function of applied applied gate voltage. These maxima are indicated in figure 4(a) by black dots. We expect that the trajectories traced out by the black dots as a function of Vg correspond to the evolution of each LL as a function of the chemical potential. Strikingly, we see that these trajectories present sharp deviations or jumps upon decreasing Vg. This feature is clearly visible on the fan diagram of figure 4(b) featuring
  versus
  which nicely illustrates the fact that the position of the '+' LLs follows a simple evolution only for limited regions of the diagram. Conversely, we observe that at precise locations the amplitude of the SdH oscillations is strongly suppressed.
There are many situations in which quantum oscillations rapidly change their phase and/or amplitude as a function of B. An example is the exchange interaction that enhances the g*-factor for magnetic fields beyond a critical value [27–34]. Changes in the oscillation pattern can also occur when different LLs cross at a particular magnetic field: in this case anti-crossings can be observed [35–41]. These phenomena originate from many-body interactions. The deviations observed in figure 4 point to an interaction whose energy scale is of the order of the LL splitting ( for the highest doping and the '+' levels). Further studies are needed to determine the nature of this interaction.
The study presented here unravels the remarkably complex behavior of the SdH oscillations seen at the LAO/STO interface. Our analysis reveals the important role played by the Rashba SOi on the electronic band structure and the peculiar regime hereby realized. Finally, the evolution of the LL spectrum as a function of doping and magnetic field displays sharp deviations that we cannot explain in our independent electron picture.
The authors would like to thank G Seyfarth and D Jaccard for help with the measurements and stimulating discussions, and are grateful to M Lopes and S C Müller for their technical assistance. This work was supported by the Swiss National Science Foundation through the NCCR MaNEP and Division II, by the Institut Universitaire de France (MG) and has received funding from the European Research Council under the European Unionʼs Seventh Framework Programme (FP7/2007–2013) / ERC Grant Agreement no. 319286 (Q-MAC).
Footnotes
- 3
In the rest of the paper we use the sheet conductance at zero magnetic field and 50 mK (
 ) rather than the gate voltage () to define the state of the system.
 - 4
We would like to emphasize that at our base temperature (
) the field dependence of the amplitude of the oscillations is mainly controlled by the Dingle term that compares the strength of the disorder to the cyclotron gap. Hence, the fitting shown in figure 2 is only sensitive to the product of m* and the Dingle temperature.

