


Abstract
Streamer discharges are a primary mode of electric breakdown in thunderstorms and high voltage technology; they are generally believed to grow along electric field lines. However, we here give experimental and numerical evidence that streamers can propagate nearly perpendicularly to the background electric field. These streamers are guided by pre-ionization that is orders of magnitude lower than the ionization density in a streamer channel, hardly affecting the background field. Positive streamers could be guided in nitrogen with 0.5% of oxygen or less, but not in air. This observation also tests the role of photo-ionization in gas mixtures with varying nitrogen–oxygen ratio.
Export citation and abstract BibTeX RIS

Content from this work may be used under the terms of the Creative Commons Attribution 3.0 licence. Any further distribution of this work must maintain attribution to the author(s) and the title of the work, journal citation and DOI.
1. Introduction
Streamer discharges are a primary mode of electric breakdown when a high voltage pulse is applied to ionizable matter. They occur in thunderstorms as streamer coronas ahead of lightning leaders or directly as sprite discharges high above thunderclouds [1–3]. They also occur in plasma and high voltage technology, with applications ranging from air purification to material treatment and wound healing [4–8].
Streamers can have negative or positive polarity, propagating with or against the electron drift. Paradoxically, positive streamers emerge and propagate much more easily than negative ones [9–11]. Streamers can also guide a gas flow rather than being guided by the flow [12]. Here we describe another unexpected observation: positive streamers can propagate nearly perpendicularly to the local electric field.
Streamers are generally believed to follow the direction of the background electric field (i.e. the field in absence of the streamer). When they do not follow the background field lines, they are usually repelled by neighboring streamers [13] and still follow the new local electric field direction. However, we recently have observed cases where streamers propagated along invisible paths in the gas that could not plausibly coincide with the direction of the local electric field. This was, in particular, the case when positive streamers propagated along the edge of a rather spherical cloud of pre-ionization left behind by a previous negative discharge [14]. But in this case it was difficult to establish the actual distribution of pre-ionization and of the electric field at the moment when the positive streamers were growing.
Therefore, we here present experiments with pre-ionization created through very weak laser illumination, allowing full control over timing, location and density of the pre-ionization trail. We demonstrate through experiments and modeling that positive streamers can follow this very weakly pre-ionized region rather than the electric field lines, even if this pre-ionization is too weak to modify the electric field.
The use of laser-induced weakly ionized channels can help us gain fundamental insight in repetitive discharges [14–18] by providing well-controlled experiments that are easy to model. This can lead to better understanding of the highly complex repetitive discharges themselves. It also allows testing the models of the nonlocal photo-ionization reaction in gas mixtures with varying nitrogen–oxygen ratios.
2. Set-up and methods of the experiment
We have used a KrF excimer laser to create a trail of increased pre-ionization and studied the effect of this trail on streamer development and morphology, with a focus on streamer guiding. The laser produces pulses at 248 nm of about 1 mJ per 20 ns long pulse at a maximum repetition rate of 10 Hz. The (unfocused) laser beam is shaped by four shutters to a quasi-rectangular beam with a height of 10 mm and a width (perpendicular to the image plane) of 9 mm. This beam enters a vacuum vessel from above, as shown in figure 1. This vessel contains an electrode tip positioned 103 mm from a cathode plane and is filled with different nitrogen–oxygen mixtures with achieved impurity levels of about 10 ppm. The laser beam was aligned to a symmetry-plane which includes the electrode tip.
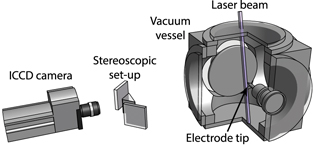
Figure 1. Schematic overview of the set-up including the ICCD camera, stereoscopic set-up and vacuum vessel with indication of laser beam path. In the images presented in this paper the recorded view has been rotated anti-clockwise by  so that the electrode tip is shown on top.
Download figure:
Standard image High-resolution imageThe ionization density induced by the laser beam has been determined by measuring the time-integrated current, and thus the total charge, between two flat electrodes induced by a laser pulse. One of these electrodes is grounded and the other one is kept at a positive potential between 0 and 2000 V. This procedure is performed in the same vessel and under the same conditions as the laser guiding experiments. From the measurements we conclude that the ionization density is about  in 133 mbar pure nitrogen with the laser at full power, as was the case in all experiments shown here (although guiding was also observed at lower laser powers). In mixtures with low oxygen concentrations the ionization density nearly equals the electron density because attachment and recombination are negligible during our experiments [17].
Some nano- to milliseconds after the laser pulse a single high-voltage pulse was applied to the electrode tip. The voltage pulses have a quite rectangular shape with pulse lengths of 600–1500 ns, rise/fall times of about 15 ns and pulse amplitudes of 4–10 kV. The vacuum vessel and pulse forming network are the same as described in [17].
The created streamers are imaged with an Andor ICCD-camera, combined with a stereo-photography set-up like in past experiments [13, 19]. The full angle between the two image-paths of the stereo set-up is 24–28°. The line connecting the two outer mirrors of the stereo-setup is parallel to the line between electrode point and cathode plate, as indicated in figure 1. This makes it possible to measure the location of streamers channels following the laser beam. In our previous work the stereo-setup was rotated 90° around its axis to measure channels propagating directly between the point and plane.
During post-processing the images are rotated so that the electrode tip is centered at the top. In our composite (anaglyph) images the images from the two viewing directions are laid over each other in red and cyan respectively. The stereo-images are aligned in such a way that the electrode tip has the same position in both images so that their image plane coincides with the central plane of the experiments. A displacement between the red and cyan colors indicates that channels are located in front of or behind the image plane. However, note that channels that propagate vertically down will always be white in the images, regardless of their position. Examples of the stereoscopic images are given in figure 2. We can clearly see that many streamer channels are guided by the laser pre-ionization: these streamers propagate parallel to the laser beam and show a very small offset between the red and cyan components. They are therefore mostly represented in white. Each of the figures 2(a)–(f) also contains some unguided channels that either propagate vertically or show a large non-constant offset between the red and cyan trails.

Figure 2. Stereoscopic images of laser-guided streamer discharges for various laser positions. The laser path is outlined by the purple lines. The streamers start at the tip, indicated in green. White streamers move in the image plane, the others outside. Measurements in 133 mbar pure nitrogen with a 5.9 kV, 600 ns voltage pulse 1.1 μs after the laser pulse. The images integrate over the duration of the voltage pulse.
Download figure:
Standard image High-resolution image3. Experimental observations
3.1. General laser guiding observations in nitrogen
All sub-figures from figure 2 show guiding of at least one streamer channel. Under the conditions used in this figure, guiding occurred in nearly all imaged discharges. In conditions where the laser is quite far from the tip, such as in image 2(e), the streamers have spread out so much that they are clearly in front of or behind the image plane (large vertical offset between red and cyan trails), do not cross the laser path and are not guided. There are no indications that the streamers are actually attracted to or repelled from the laser path; this indicates that the laser path does not develop its own space charge effects. However, the guided streamer channels can follow the laser beam for a long distance, often until the point where the laser beam enters through the window or where it hits the other wall. The measured velocities of guided streamers are up to 10% higher than those of non-guided streamers. However, this may be caused by the projection, because most of the non-guided streamers propagate out of the image plane. The guided streamers can also become longer than the unguided ones. All streamers in each of the figures 2(a)–(f) start simultaneously from the electrode tip and therefore also propagate simultaneously, except for the small differences in propagation velocity.
The background electric field has been calculated for a geometry that closely resembles the experimental set-up. This calculation was performed with a cylindrically symmetric Poisson-solver in the COMSOL software package. In figure 3 equipotential lines from this calculation are overlaid on a zoom into figure 2(f). At one location, the angle between the background electric field and the streamer direction is shown. This angle is about 86 , confirming the observation that the streamer is propagating nearly perpendicularly to the background electric field. Similar angles are found in the other laser-guided streamers from 2 although at most locations the angle is smaller.
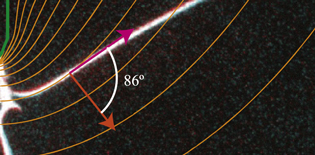
Figure 3. Detail of the measurement from figure 2(f) with calculated equipotential lines of the background electric field. The arrows indicate the directions of the streamer and the background electric field at a point where streamer and equipotential lines cross.
Download figure:
Standard image High-resolution image3.2. Guiding in nitrogen–oxygen mixtures
In our purest nitrogen, guiding by the laser is most straightforward. For low pulse voltages and short delays between the laser and the voltage pulses the streamers are almost always guided when they cross the laser beam. In pure nitrogen the maximal delay between laser and voltage pulse with guiding effect is about 2 ms. However, when the oxygen concentration is increased, guiding becomes more difficult and only occurs for shorter delays between laser and voltage pulses. The highest oxygen concentration for which guided streamers were still observed was 0.5 %. In this case the maximal delay between laser and voltage was about 1 μs. Streamer guiding was thus not observed in air, with the low laser-induced pre-ionization densities from our experiments.
At higher oxygen concentrations free electrons are lost faster but according to our calculations (see [17]) the electron loss rate at 1 % oxygen in 133 mbar nitrogen is almost the same as in pure nitrogen while in our experiments streamers are not guided in 1 % oxygen. We therefore suggest that the guiding effect is suppressed by photoionization.
4. Analysis and modelling
4.1. How photoionization can inhibit guiding
Positive streamers need free electrons ahead of them to propagate. These electrons move towards the positive discharge, and where the field is above breakdown, they generate electron avalanches due to impact ionization. In this way, the degree of ionization ahead of the discharge increases, and the discharge gradually extends forwards. The velocity at which this happens depends on the electric field profile ahead and the electron density ahead.
We call a streamer guided if it does not grow in the direction of the highest electric field, but in the direction with more free electrons ahead. Streamer guiding requires the electron density ahead of the discharge to be sufficiently anisotropic. Since the laser pre-ionization we use is clearly anisotropic, why we do not observe guiding at higher oxygen concentrations? The reason is photoionization, which produces non-local electrons isotropically around the discharge.
In nitrogen/oxygen mixtures, photoionization can occur when excited nitrogen molecules decay and emit UV photons. The average absorption length  of these photons is
where  is the oxygen fraction times the pressure [20] (the gas is assumed to be at room temperature). With a higher oxygen concentration there will thus be more photoionization events close to the discharge. To illustrate this, we can estimate the fraction of photons absorbed within one millimeter, using the data from [20]. For 133 mbar with 10 ppm oxygen this fraction is about 5·10−5 (
 ), for 133 mbar with 1% oxygen it is about 5% (
 ) and for atmospheric air it is about 86 % (
 ). Because more local photoionization causes a more isotropic distribution of free electrons around the discharge, guiding is inhibited at higher oxygen concentrations.
A related phenomenon was observed in streamer experiments [21]. With a low oxygen concentration, streamers would developed 'feathers' and would propagate in a more erratic way. Because there was little photoionization, the electron density around the streamers was anisotropic, which caused them to not always propagate in the (forward) direction of strongest electric field.
4.2. Modelling of laser-induced guiding
We have performed numerical simulations to investigate how a discharge evolves when laser pre-ionization is present.
4.2.1. Simulation model
The simulations were performed with a 3D particle model of the PIC–MCC type. In this model, electrons are tracked as particles. We use adaptive particle management [22] to adjust the weights of the simulation particles, which control how many physical electrons they represent. Ions are assumed to be immobile compared to the electrons, and are included as densities. The neutral gas is included as a background that electrons randomly collide with, using the null collision method [23]. Because the simulated discharges have an ionization degree below 10−4, only electron-neutral collisions are included. We use cross sections for elastic, inelastic, ionization and attachment collisions from the SIGLO database [24]. Furthermore, photoionization is included as non-local source of free electrons, implemented similarly as in [25], using data from [20].
The simulations are performed assuming electrostatic conditions. At each time step, the self-consistent electric field is computed from the charged particle densities. To resolve the thin charge layers and high electric fields around streamer heads, we use block-based adaptive grid refinement. An electrode is included by placing 'artificial' charges on its surface which are iteratively updated to keep it close to a desired potential, similar to the charge simulation method. Note that the source code of our simulation model is available online [26].
4.2.2. Simulation conditions
The gas used in the simulations was N2 with 10 ppm O2 at 133 mbar and 293 K. The computational domain measured  , with the finest grid having a spacing of 12.5 μm. In figure 4(a) we show the electrical potential at t = 0 on a cross section through the 3D computational domain. At the top an electrode is present, at a voltage of 3.5 kV. The other sides of the domain are grounded. At t = 0, electrons and positive ions are present along a horizontal channel, representing the laser pre-ionization. The ionization density in this channel is
  , and its cross section is (1 mm)2. Compared to the experiments, the domain is smaller, the laser beam is thinner and the voltage is lower. The reason for using this scaled-down system is that simulations with the experimental conditions are computationally prohibitively expensive. Our comparison between simulations and experiments is therefore qualitative.
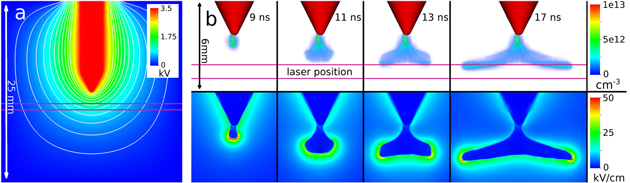
Figure 4. (a) The electrical potential at t = 0 on a cross section through the center of the 3D computational domain, with equipotential lines. (b) Particle simulation results in N2 with 10 ppm O2 at 133 mbar. Top row: the evolution of the electron density, visualized with volume rendering (low densities are transparent); bottom row: slice through the domain showing the evolution of the electric field. Note that (a) and (b) are not to scale and that the laser beam is outlined in purple.
Download figure:
Standard image High-resolution image4.2.3. Simulation results
In figure 4(b), the evolution of a discharge around the 3.5 kV electrode is shown. First, electrons from the pre-ionized channel drift upwards, towards the electrode. During this period the space charge density is too low to have a significant effect on the electric field amplitude or direction. When the electrons reach the electrode, the discharge starts to grow downward, inside the region where the electrons from the laser beam now are. (Note that the pre-ionization itself is too weak to show up in figure 4(b).) When the discharge reaches the boundary of this region, its downward propagation stops, as photoionization has not produced enough free electrons for further growth there. Instead, the discharge now starts to grow horizontally, to both sides of the pre-ionized channel. At the same time it also moves a bit downwards, following the present positions of the electrons from the laser beam. Towards the sides, these electrons have drifted less than in the center. At t = 13 ns, the streamer is propagating at an angle of more than 60 to the initial background electric field, as indicated in figure 5. We can also see that the streamer does not propagate in the direction of the maximum electric field because it needs the electrons from the laser beam to grow.

Figure 5. Zoom of figure 4(b) at 13 ns, showing the electric field strength on a slice through the domain. Arrows indicate the direction of: the background field (E ), the current maximum field (E
 ) and the streamer velocity (v). Equipotential lines for the background field are also shown in white.
Download figure:
Standard image High-resolution image
4.3. Comparison with other laser guiding experiments
The phenomenon we have described should not be confused with the laser guiding of (streamer) discharges described by [27, 28] and others, where focused high power lasers create a thin channel with an electron and ion density of 1016–1017 cm−3 in atmospheric air, while the ionization inside a streamer channel amounts to 1015 cm−3 at most. Such laser channels modify the background electric field at least one order of magnitude more rapidly than a streamer, and effectively act as conductors. In contrast, we have demonstrated that positive streamers can be guided by regions with an electron density of 109cm−3 or less in nitrogen/oxygen mixtures at 133 mbar, while a typical streamer would have an ionization density of 1012 cm−3 (when scaling a typical ionization density of 1014 cm−3 at atmospheric pressure to 133 mbar [2]). These channels hardly change the electric field.
Furthermore, in the other studies [28, 29] the laser is usually aligned parallel to the field lines. Here we have shown that very weakly ionized regions that are almost perpendicular to the local field lines can still guide the streamers. Our numerical simulations generally support the conclusions from the experiments and demonstrate that the laser pre-ionization does not modify the electric field, while it does guide the streamers.
5. Conclusions
We have observed that streamers can be guided in a direction nearly perpendicular to the background electric field with a very low level of laser induced pre-ionization (≲109cm−3). This pre-ionization itself has a negligible effect on the electric field. This occurred in nitrogen–oxygen mixtures at 133 mbar with oxygen concentrations below 0.5 %. At higher oxygen concentrations the streamer locally produces so many free electrons through photoionization that it is no longer influenced by the laser produced electron trail. Finally, we have presented numerical simulations that showed the same laser guiding effect as in our experiments and confirmed that the space charge effects of the laser trail itself indeed are negligible.
Acknowledgements
SN was supported by FY2012 Researcher Exchange Program between the Japan Society for the Promotion of Science JSPS and The Netherlands' Organization for Scientific Research NWO, ET by JSPS KAKENHI Grant Number 24560249 and JT by STW-project 10755, part of NWO.