
Abstract
We report the effect of plasma parameters on the properties of ultrathin Al2O3 films prepared by plasma enhanced atomic layer deposition for moisture barrier applications. The Al2O3 films were grown at 90 °C using trimethylaluminum and O2 plasma as precursors. Plasma power, exposure time and O2 concentration are found to influence the growth behavior, composition and density of ultrathin Al2O3 films. Plasma power ≥ 100 W leads to lower impurity levels and higher mass densities of ∼2.85 g·cm−3. The optimum plasma parameters for our process, a plasma power of 100 W and an exposure time of 3 s, reveal a good water vapor transmission rate of 5 × 10⁻³ g·m−2·day−1 for polyethylene naphthalate substrates coated with 4 nm-thick Al2O3 films.
Export citation and abstract BibTeX RIS

Content from this work may be used under the terms of the Creative Commons Attribution 4.0 license. Any further distribution of this work must maintain attribution to the author(s) and the title of the work, journal citation and DOI.
1. Introduction
Atomic layer deposition (ALD) prepared Al2O3 is a widely used material in semiconductor industry,1–3) due to its accurate thickness control, high conformality, excellent dielectric properties, good adhesion and high thermal stability. In the last years, its use was extended to new applications, such as micro-electromechanical systems (MEMS),4–6) protective coatings,7–12) optics,13,14) and photovoltaics,15–18) thanks to its mechanical, barrier, optical and passivation properties.
For many industrial and research applications, the trimethylaluminum (TMA) and water (H2O) based thermal ALD process is the most commonly used method to grow Al2O3 thin films, since it involves ideally self-saturating gas–solid reactions and allows a wide process window that ranges from room temperature to 500 °C.7,15,19,20) Although high temperature processes often result in high quality and low impurity thin films, they cannot be used for thermally-sensitive materials and substrates. As an example, for novel display applications such as organic light-emitting diode (OLED) and flexible displays, deposition is limited to low temperatures because the organic materials and polymer substrates are thermally sensitive. However, low-temperature thermal ALD processes have known shortcomings such as long purge time, slow reaction rate, high impurity levels and poor structural quality.7) Thus, a solution that combines a fast process with a good film quality at low deposition temperatures would be highly desired.
Plasma enhanced atomic layer deposition (PEALD) is an advantageous method to grow good quality thin films at low temperature, considering that the surface chemistry involved in the process is driven rather by plasma species than thermal energy. Recently, this method has rapidly gained popularity, especially for low temperature processes because the use of plasma radicals as reactant allows more freedom in processing conditions compared with thermal ALD. Moreover, it has been shown that with PEALD, Al2O3 thin films with equivalent properties to the ones of films grown by thermal ALD could be achieved with process temperatures as low as a few tens of degrees.15)
While it has been established that the growth behavior of PEALD Al2O3 depends on the deposition temperature and plasma parameters, many reported studies were carried out on thin films with thicknesses above a few tens of nanometers and temperatures above 100 °C.15,16) However, for flexible electronics and displays applications where ALD grown Al2O3 can be used as thin film encapsulation layers, films with thicknesses below 10 nm are of high relevance since they are assumed to stand more bending and twisting than thicker ones. In this paper we show that reasonable moisture barrier properties for 4-nm-thick Al2O3 films grown on poly(ethylene naphthalate) (PEN) substrates at 90 °C can be reached by tuning plasma power and exposure time. To support the understanding of plasma power and exposure time effects, we also studied the growth behavior of our Al2O3 thin films and performed chemical composition, optical and structural analyses on the grown films.
2. Experimental methods
Al2O3 thin films were deposited on (100)-oriented Si and PEN substrates. The PEALD processes were carried out in a Beneq TFS-200 ALD-reactor using the plasma configuration presented in Fig. 1 at 90 °C. In the reactor, plasma was generated with a capacitively coupled 13.56 MHz RF source and depositions were made with plasma powers of 50–300 W. TMA (98%, Strem Chemicals), with 0.2 s pulse and 3 s purge time, and O2 (99.999%, AGA) plasma, with 1–6 s pulse and 2 s purge time, were used as Al and O sources, respectively. The precursors were alternately introduced into the reactor and N2, with a through-reactor flow between 500 and 800 sccm, was used as a carrier and purging gas. The O2 flows were altered in the range of 75–120 sccm to study the effect of two O2 concentrations which are defined as the ratio of O2 flow to the total gas flow of N2 and O2. The O2 concentrations studied in this work are 9 and 20%. During the processes, the pressure in the reactor was 0.5–1 hPa.
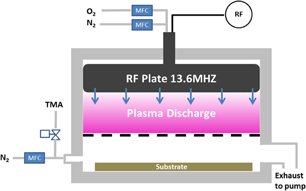
Fig. 1. Schematic representation of the plasma configuration in the Beneq TFS-200 ALD-reactor.
Download figure:
Standard image High-resolution imageThin film thickness was determined with a SENTECH SE400adv ellipsometer using a 633 nm wavelength at 70° angle of incidence. X-ray reflectivity (XRR) measurements were performed on Al2O3-coated Si substrates with a Philips X'Pert Pro X-ray diffractometer using the Cu Kα1 radiation. To determine the density and roughness of the films and to confirm the thickness measured by ellipsometry, the XRR data were simulated with an in-house developed fitting software.21) The chemical composition of the thin film was qualitatively studied with surface sensitive attenuated total reflectance Fourier transform infrared spectroscopy (ATR-FTIR). The measurements were done using a Thermo Electron Corporation Nicolet 380 ATR-FTIR spectrometer with a diamond crystal as an internal reflection element. The procedure included a background collection from the Si substrate and data collection from the samples, both with 64 scans. A 2 cm−1 resolution over the 525–4000 cm−1 wavenumber range was chosen. Moisture barrier properties were tested on the Al2O3-coated PEN substrates using water vapor transmission rate (WVTR) measurements which were carried out in the 0.002–18 g·m−2·day−1 range using a Systech Illinois 7001 water vapor permeation analyzer. Testing environment conditions of the WVTR measurement were a temperature of 38 °C and a relative humidity of 90%. Note that the growth behavior studies and the chemical, optical and structural analyses were carried out on above 25-nm-thick Al2O3 films grown on Si substrates whereas the WVTR measurements were performed on PEN substrates coated with 4-nm-thick Al2O3 films.
3. Results and discussion
3.1. Al2O3 thin film growth behavior and properties
The dependence of the Al2O3 growth-per-cycle (GPC) on Si substrates as function of the plasma power is shown in Figs. 2(a) and 2(b) for O2 concentrations of 9 and 20%, respectively. The plasma power was varied between 50 and 300 W for three plasma exposure durations of 1, 3, and 6 s. As can be seen in Figs. 2(a) and 2(b), the lowest GPC of 1.07 Å/cycle is obtained with an O2 concentration of 9%, a power of 50 W and an exposure time of 1 s. The highest GPC of 1.57 Å/cycle is also obtained for a plasma exposure time of 1 s by using power values of 300 and 180 W and O2 concentrations of 9 and 20%, respectively. Still for an exposure time of 1 s, when the O2 concentration is set to 9%, the GPC increases with an increase in plasma power to reach the highest value. A similar trend is seen for plasma powers between 50 and 180 W when the O2 concentration is changed to 20%. However, for a power of 300 W, while no significant change in GPC was observed, obvious thickness deviations were detected. For plasma exposure durations of 3 and 6 s, the GPC is found to decrease with an increase in plasma power for an O2 concentration of 20%, however it remains rather constant (within the error margins) in the whole plasma power range for an O2 concentration of 9%. Note that (a) for both 9 and 20% O2 concentrations, the highest GPC is found to decrease with increasing plasma exposure time above 1 s and (b) for an O2 concentration of 20%, similar GPC was obtained for exposure durations of 1 and 6 s and a power of 50 W.
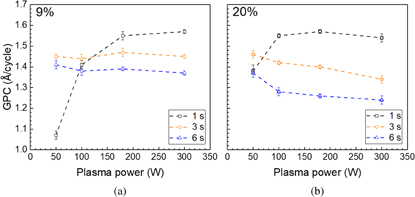
Fig. 2. GPC of PEALD Al2O3, for various plasma exposure durations, as a function of plasma power with (a) 9% O2 concentration and (b) 20% O2 concentration.
Download figure:
Standard image High-resolution imageFigures 3(a) and 3(b) show the refractive index dependence of Al2O3 films on plasma power measured by ellipsometry for plasma exposure durations of 1, 3, and 6 s as well. As a general observation, the refractive index is found to increase with increasing exposure time. While the highest refractive indices are obtained with a plasma exposure time of 6 s, the lowest one (n ∼ 1.60) is obtained for samples grown with an exposure time of 1 s and a power of 50 W. For a plasma exposure time of 1 s, a rather constant value (within the error margins) is measured above 100 and 180 W for O2 concentrations of 20 and 9%, respectively. Further increase of the plasma exposure time to 3 s shows a similar behavior for both 9 and 20% O2 concentrations, i.e., nearly constant refractive index above 100 W. However, for 6 s although a similar trend is seen for an O2 concentration of 20%, the refractive index remains constant in the whole power range (from 50 to 300 W) for an O2 concentration of 9%.

Fig. 3. Refractive index of PEALD Al2O3 films, for various plasma exposure durations, as a function of plasma power with (a) 9% O2 concentration and (b) 20% O2 concentration.
Download figure:
Standard image High-resolution imageTo study the effect of plasma power on the chemical composition of Al2O3 films, ATR-FTIR spectroscopy was carried out on samples grown on Si substrates with power values of 50, 100, and 180 W. The ATR-FTIR transmission spectra are shown in Fig. 4. As a general observation, the Al–O bond band fingerprint of amorphous Al2O3 is seen between 525 and 1000 cm−1 for all samples.22,23) Additionally, all spectra have a strong Si–O mode band at 1107 cm−1,23) which hints to the presence of an interfacial silicon oxide layer. The broad band features in the 3800–3200 cm−1 region can be assigned to the –OH groups.22,24) These bands exhibit a negative transmission, i.e., peak-like-shapes instead of valleys around 3700 cm−1 (see inset of Fig. 4). This is due to the automatic transmission spectrum ratioing scheme in which the sample spectrum is divided by the silicon background spectrum; the latter having a stronger relative presence of –OH groups.25) Still, the relative differences of the spectra can reveal information on films as the used background spectrum and measurement conditions were similar for all samples. Note that the spectrum of the sample grown with a power of 50 W is unique as it shows (a) a more pronounced intensity of the –OH band compared to the other samples, (b) band overlapping of the bending overtone, symmetric and asymmetric stretching vibrations of the C–H groups in the 2980–2870 cm−1 range,24) (c) a band located at 1239 cm−1 which is assigned to deformation vibrations of methyl24,26) and supports the significant presence of –CHx species and (d) pronounced band forms in the 1800–1350 cm−1 region which are assigned to symmetric and asymmetric stretching modes of OCO molecule structures.24)
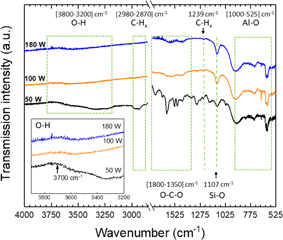
Fig. 4. ATR-FTIR transmission spectra with chemical bond assignments for PEALD Al2O3 samples with different plasma powers. Plasma exposure time and O2 concentration were fixed at 1 s and 20%, respectively.
Download figure:
Standard image High-resolution imageXRR measurements and simulations were carried out to evaluate the film density and surface roughness of the PEALD Al2O3 samples. In Fig. 5, the film density and roughness as function of plasma power are shown for Al2O3 layers grown with a plasma exposure time of 1 s and an O2 concentration of 20%. Within measurement errors, density values are constant (∼2.85 g·cm−3) for plasma powers of 100, 180, and 300 W, while the 50 W process leads to films with a lower density of 2.6 g·cm−3. While a high roughness of 1.22 nm was obtained for a plasma power of 50 W, a sub-nanometer roughness was measured for samples grown with higher powers; the lowest value being 0.6 nm at 100 W. The analyses also reveal the presence of a ∼1.3 nm interfacial layer of silicon oxide in all measured Al2O3 samples except for the sample grown with a power of 300 W, for which the silicon oxide layer has a thickness of about 0.7 nm.
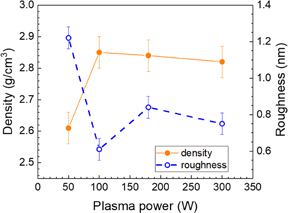
Fig. 5. Plasma power effect on the density and roughness of PEALD Al2O3. Plasma exposure time and O2 concentration were fixed at 1 s and 20%, respectively.
Download figure:
Standard image High-resolution image3.2. Moisture barrier properties
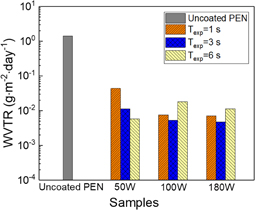
Moisture permeation barrier properties of 4-nm-thick PEALD Al2O3 films grown on PEN substrates with a constant O2 concentration of 20% and varied plasma powers and exposure durations were investigated. As shown in Fig. 6, the uncoated PEN has an initial WVTR of 1.4 g·m−2·day−1. The barrier performance was improved over 250 times upon the deposition of the Al2O3 thin films. For plasma exposure time below 6 s, samples prepared with 100 and 180 W show similar barrier properties which are better than those of samples grown with 50 W. Power of 50 W and exposure durations of 1 and 3 s led to WVTR of 4.4 × 10⁻² and 1.1 × 10⁻² g·m−2·day−1, respectively. An improvement by almost an order of magnitude was observed with further increase of the plasma power leading to a WVTR of ∼7 × 10⁻³ and 5 × 10⁻³ g·m−2·day−1 for both 1 and 3 s, respectively. With a further increase of the exposure time to 6 s, while the barrier performance of the sample prepared with a power of 50 W improved leading to WVTR of ∼6 × 10⁻³ g·m−2·day−1, samples grown with powers of 100 and 180 W showed a degradation. Table I summarizes WVTR values for polymer substrates coated with PEALD Al2O3 films. The best WVTR obtained in this work is compared to results reported by other authors. For comparison purposes, only processes with a temperature window between room temperature and 100 °C were included. While the best WVTR values (in the order of 10−4 g·m−2·day−1) were reported for 100-nm-thick Al2O3, WVTR above 10−3 g·m−2·day−1 were measured for samples below 50 nm. Moreover, these data show that reasonable WVTR values of about 5 × 10⁻³ g·m−2·day−1, were achieved even for ultrathin Al2O3 barrier with thicknesses under 5 nm.
Fig. 6. WVTR dependence of Al2O3-coated PEN substrates on plasma power and exposure time. These values are compared to the WVTR of an uncoated substrate. The 4-nm-thick Al2O3 films were grown with an O2 concentration of 20%.
Download figure:
Standard image High-resolution image
Table I. Summary of WVTR for polymer substrates coated with PEALD Al2O3 films. The best WVTR in this work is compared to results reported by other authors. The deposition temperature and film thickness are denoted as Tdep and d, respectively.
| Studied deposition parameters | WVTR test condition | WVTR of uncoated polymer (g·m−2·day−1) | Best WVTR (g·m−2·day−1) @thickness | Ref. | |||
|---|---|---|---|---|---|---|---|
| Tdep (°C) | d (nm) | Plasma power (W) | Plasma exposure time (s) | ||||
| RT to 100 | 10–40 | NA | 2 | 21 °C, 60% RH | PEN 0.5 | 5 × 10⁻³ @20 nm | 8 |
| 100 | 100 | 100–400 | 6 | 50 °C, 50% RH | PES 34.1 | 2.6 × 10⁻⁴ @100 nm | 10 |
| 100 | 100 | 400 | 6–12 | 50 °C, 50% RH | PES 34.1 | 1 × 10⁻⁴ @100 nm | 12 |
| 80 | 2–50 | 200 | 2 | 40 °C, 90% RHa) | PEN 1.7 | 3 × 10⁻³ @5 nmb) | 28 |
| >1 × 100 @2 nmb) | |||||||
| 90 | 4 | 50–180 | 3 | 38 °C, 90% RHa) | PEN 1.4 | 5 × 10⁻³ @4 nm | This work |
a) WVTR was measured using a commercial instrument.
b) Value from figure.
3.3. Discussion
Because plasma power, exposure time and O2 concentration influence the growth behavior of Al2O3 thin films, to achieve a saturated growth, an optimization of process parameters is necessary. The lowest GPC, which is obtained with a 9% O2 concentration, a plasma power of 50 W and an exposure time of 1 s, is most likely caused by the low O2 concentration, insufficient plasma exposure time and power that lead to a shortage of O radicals and therefore incomplete gas–solid interactions. Consequently, high level carbon impurities are expected to be left in the film and inhibit thereby the film growth. In fact, a strong concentration of C–H and O–C–O group impurities in the sample grown with a power of 50 W was measured by ATR-FTIR even for samples grown with the O2 concentration of 20%. Moreover, the OCO molecule structure, which is part of carbonate (COO2–) and formate (HCOO–) group structures, was previously reported to appear in TMA-O2 plasma Al2O3 ALD processes with insufficient plasma time.22,24,27) This indicates that a higher plasma power, exceeding 50 W, is needed to complete the intermediate surface species removal during the O2 plasma half-cycle. For a plasma exposure time of 1 s, higher plasma powers (100–300 W) have led to higher growth rates confirming the incomplete surface saturation during the process with a power of 50 W. The high growth rates observed above 50 W are correlated to the reduced concentration of incomplete –OH groups and carbon impurities which can be explained by the surface chemical reactions described in Ref. 27. The refractive index, density and roughness measured for PEALD Al2O3 films grown with a plasma exposure time of 1 s and an O2 concentration of 20% support the above-mentioned growth behavior. The low refractive index, low density and high roughness of the samples grown with a power of 50 W confirm the hypothesis of an incomplete surface reaction and a high concentration of impurities whereas the higher refractive indices, the higher densities and lower roughness measured for samples prepared with powers above 100 W point to a more complete reaction. The increase of the refractive index with decreased impurity levels was also reported elsewhere.7) The saturation of the ALD surface reaction often leads to a saturated GPC, which is seen as the highest value of ∼1.57 Å/cycle in this study and correlates here with a refractive index of 1.63. In the case of samples prepared with a power of 300 W, we suspect that the thickness deviations, which were detected by ellipsometry, result from surface etching of the films since a thinner silicon oxide interfacial layer was measured by XRR. The difference in the silicon oxide thickness would then be related to the stronger ion bombardment with the 300 W plasma power causing a minor sputtering effect on the deposited surface.
Unlike for 1 s, for longer plasma exposure durations the GPC is found to either remain constant with an increase of the plasma power as in the case of 9% O2 concentration or decrease as in the case of 20% concentration. The nearly constant GPC values, which are obtained for an O2 concentration of 9%, cover the whole plasma power range. This suggests that the plasma pulse length has a more dominant role in the reaction than the plasma power when the reaction time is long enough. The decrease of the GPC that is observed for an O2 concentration of 20% is assigned to film densification since the refractive index remains above 1.63. Based on our findings and taking into consideration the GPC and the refractive index values, we speculate that the growth of our films takes place through three specific stages. The first stage, in which the film growth is unsaturated, results in a low GPC and a low refractive index. The second stage, in which the growth saturation of the films occurs, leads to an increase of the GPC and the refractive index. Finally, the third stage in which densification of the films dominates, leads to decreased GPC while the refractive index remains high. Thus, for an O2 concentration of 20% and a power of 50 W, although a similar GPC of 1.38 Å/cycle is obtained for the films grown with an exposure time of 1 and 6 s, their growth behavior can be linked to the unsaturated growth stage and film densification stage, respectively. The latter results from an extended exposure (6 s) to plasma despite the low power (50 W). The suggested growth stages dependence on plasma parameters are summarized in Table II.
Table II. The suggested film growth stages of our PEALD Al2O3 films grown with varied plasma parameters.
| Fixed plasma power (W) | O2 concentration (%) | Suggested film growth stages based on the plasma exposure time (s) | ||
|---|---|---|---|---|
| Unsaturated growth | Saturated growth | Film densification | ||
| 50 | 9 | 1 and 3 | — | 6 |
| 20 | 1 and 3 | — | 6 | |
| 100 | 9 | 1 | — | 3 and 6 |
| 20 | — | 1 | 3 and 6 | |
| 180 | 9 | — | 1 | 3 and 6 |
| 20 | — | 1 | 3 and 6 | |
| 300 | 9 | — | 1 | 3 and 6 |
| 20 | — | 1 | 3 and 6 | |
The WVTR is a key criterion for describing the moisture permeation barrier properties of thin films, and measurements results show that it is strongly influenced by plasma parameters during the PEALD process. The WVTR dependence on plasma parameters correlates with the suggested growth behavior mentioned above and summarized in Table II, i.e., unsaturated growth stage leads to high WVTR whereas saturated or densification stage results in improved moisture resistance. Nonetheless, for powers ≥100 W and an exposure time of 6 s, where densification is expected to take place, we see a degradation of the moisture barrier. In this case, we speculate that ion bombardment during the longer plasma exposure (6 s) might have resulted in the PEN substrate damage as observed for the Si substrate-coated sample grown with a power of 300 W. Therefore, we conclude that the Al2O3 film growth with PEALD for encapsulation applications requires optimum plasma power and exposure time which lead to a high film quality without substrate damage. While good Al2O3 permeation barrier properties were reported for thicknesses above a few tens of nanometers,10,12) the results summarized in Table I show that reasonable moisture permeation barrier properties can also be reached for ultrathin Al2O3 films. Starostin et al. demonstrated that excellent encapsulation films for OLED applications can be processed by combining an ultrathin Al2O3 film grown by PEALD with a SiO2 buffer layer.28) However, they also reported that their Al2O3 films with a thickness below 5 nm and directly grown on PEN substrates revealed a degradation behavior during the water vapor permeation measurements. Our results show that by choosing optimum plasma parameters of the PEALD process, including an appropriate plasma power and exposure time, comparable properties for moisture barrier applications are reachable below 5 nm. Therefore, such films could potentially be used as moisture barriers in flexible devices.
4. Conclusions
We have shown that plasma parameters influence significantly the Al2O3 thin films grown by PEALD. The growth occurs through three stages depending on plasma power, exposure time and O2 concentration. By tuning these parameters, low-impurity and high-density films can be achieved. A saturated growth of the Al2O3 films leads to good moisture barriers. A WVTR of 5 × 10⁻³ g·m−2·day−1 was obtained for PEN substrates coated with 4-nm-thick Al2O3 films.
Acknowledgments
The authors would like to thank Emma Salmi from Beneq, Elena Ostrovskaia, Sami Suihkonen, and Chiara Modanese from Aalto University for their valuable help. This research was partially performed at Beneq. Most characterizations were carried out at the facilities of Micronova, the Centre for Micro and Nanotechnology. ATR-FTIR measurements were done at the Nanomicroscopy Center, Aalto University.