

Abstract
Photoresists are an indispensable technology used for manufacturing electronic devices such as displays and semiconductors. In this study, we investigated the relationship between C=C double bond conversion and dissolution kinetics in cross-linking-type photoresists used for display manufacture using real-time Fourier transform infrared spectroscopy (FTIR) and quartz crystal microbalance (QCM) methods. To improve photoresist performance, it is important to understand the development mechanism of photoresists. Two kinds of polymers (a polymer with peeling-type dissolution and a polymer with a dissolution type with Case II diffusion) were used. 1,2-Octanedione-1-[4-(phenylthio)-2-(O-benzoyloxime)] and bis(2,4,6-trimethylbenzoyl)phenylphosphine oxide were used as photoinitiators. The dissolution was of the peeling type when the polymers were formulated as a typical cross-linking-type photoresist. With increasing conversion ratio of C=C double bonds, the rate of developer intake decreased and the impregnation threshold before the onset of peeling increased and then decreased. It was also found that the dissolution kinetics were affected by the radicals generated upon the decomposition of photoinitiators.
Export citation and abstract BibTeX RIS
1. Introduction
Photoresists have been widely used in micro- and nanofabrication processes for the high-volume production of displays and semiconductors.1–3) Negative-type photoresists have been widely used as color filters, photospacers, banks, overcoats, and sealants.4,5) A negative-type photoresist for manufacturing displays and semiconductors typically consists of an alkali-soluble polymer, a monomer, and a photoinitiator. When negative-type photoresists are irradiated with UV light, radicals are generated through the decomposition of photoinitiators, and a cross-linking reaction is induced. As a result, the photoresists become insoluble in an alkaline solution such as a tetramethylammonium hydroxide (TMAH) aqueous developer.
In the application of photoresists to micro- and nanofabrication, the control of the resist pattern shape is an important issue. In particular, the development process of photoresists is essential because it significantly affects the resist pattern formation. The development process has been investigated by various methods such as visible and infrared reflectance spectroscopy,6–8) a quartz crystal microbalance (QCM) method,8–14) and high-speed atomic force microscopy (AFM).15–19) The dependences of the development process on exposure dose (reaction rate),6,9) molecular structure,8,11,14) film thickness,14,16) acidity,8,11,14,20,21) and pattern shape17) have been reported. We also reported the dissolution kinetics of unexposed polymer and resist films used for display manufacture.14) The changes in the frequency of a QCM during photoresist development have been measured for polymer and resist films. The major trend observed was as follows. The development type changed from an insoluble type to the peeling type and the dissolution type with Case II diffusion with increasing acid value of the polymers. The dissolution with Case II diffusion is characterized by the formation of a transient swelling layer (dissolution front) and steady-state front motion (linear weight loss). For dissolution with Case II diffusion, the dissolution time and the original thickness of the transient swelling layer decreased with increasing acid value of polymers.14) Note that the acid value is described as the weight (mg) of potassium hydroxide (KOH) required to neutralize the acidic component contained in 1 g of a polymer.
In cross-linking-type photoresists, dissolution kinetics depend on the degree of cross-linking. UV curing processes have been investigated by IR spectroscopy,22–24) Raman spectroscopy,25) ESR,26) and UV rheometry.27) However, the details of the relationship between cross-linking and dissolution kinetics are unknown. In this study, we investigated the development process of cross-linking-type photoresists used for display manufacture. The C=C double bond conversion induced upon exposure to UV light was measured by a real-time Fourier transform infrared spectroscopy (FTIR) method. The dissolution behavior of exposed photoresists in a TMAH aqueous developer was measured using a QCM. The shapes of resist patterns after development were observed by scanning electron microscopy (SEM). The relationship between C=C double bond conversion and dissolution kinetics is discussed.
2. Experimental procedure
Two kinds of polymers and two kinds of photoinitiators, 1,2-octanedione-1-[4-(phenylthio)-2-(O-benzoyloxime)] and bis(2,4,6-trimethylbenzoyl)phenylphosphine oxide, were used, as shown in Fig. 1. The molecular weights and acid values of the polymers are listed in Table I. The resist samples consisted of a polymer (Polymer I or II), a monomer, a photoinitiator (Initiator α or β), and a surfactant. Di-pentaerythritol polyacrylate was used as a monomer. The weight ratio of each polymer to the monomer was  . The concentration of the photoinitiator was adjusted so that the conversion ratio of C=C double bonds was approximately 0.5 upon exposure to 50 mJ/cm2 UV light under N2 purging for each photoresist. A fluorochemical surfactant was used for uniform film formation. The surfactant concentration was 0.1 wt %. Four kinds of photoresists were prepared by mixing the resist components, as listed in Table II. The resist samples were dissolved in propyleneglycol monomethyl ether acetate (PGMEA) before spin-coating.
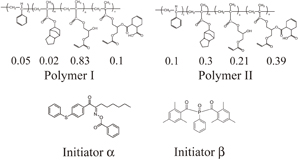
Fig. 1. Molecular structures of polymers and photoinitiators used. Initiators α and β are 1,2-octanedione-1-[4-(phenylthio)-2-(O-benzoyloxime)] and bis(2,4,6-trimethylbenzoyl)phenylphosphine oxide, respectively.
Download figure:
Standard image High-resolution imageTable I. Molecular weights (Mw) and acid values of polymers.
| Sample | Mw | Acid value (mg KOH/g) |
|---|---|---|
| Polymer I | 9000 | 30 |
| Polymer II | 8400 | 80 |
Table II. Resist components and photoinitiator concentrations. Numerical values in the brackets in the rightmost column represent the concentrations of photoinitiators in wt %.
| Photoresist | Polymer | Photoinitiator |
|---|---|---|
| Resist A | Polymer I | Initiator α (2) |
| Resist B | Polymer I | Initiator β (5) |
| Resist C | Polymer II | Initiator α (3) |
| Resist D | Polymer II | Initiator β (10) |
In real-time FTIR experiments, resist solutions were spin-coated on silicon substrates and baked at 100 °C for 60 s to form resist films with a thickness of 0.5 µm. The baking temperature was slightly elevated, compared with those in QCM and patterning experiments, to obtain uniform films. It was confirmed by differential scanning calorimetry that no thermal polymerization occurred under the baking condition. The resist films were exposed to UV light with a wavelength of 365 nm from a mercury lamp (EXFO Omnicure™ S2000) and an intensity of 1 mW/cm2. The samples were exposed to UV light in the atmosphere or under N2 purging. The exposure dose was set to 50 mJ/cm2. FTIR measurement was carried out under UV light exposure condition using a real-time FTIR system (Bruker-Optics VERTEX 70). The details of the measurement system and procedure have been reported elsewhere.28,29) The C=C double bond conversion of resist samples during UV light exposure was calculated by dividing the absorbance peak height at 812 cm−1 (CH out-of-plane bending band) by the initial absorbance peak height before UV light exposure.
In the QCM experiments, resist solutions were spin-coated on QCM substrates and baked at 90 °C for 120 s to form resist films with a thickness of 0.5 µm. The resist films were exposed to UV light from a UV lamp (AS ONE Handy UV Lamp SLUV6) in the atmosphere. The wavelength and light intensity were 365 nm and 0.86–0.98 mW/cm2, respectively. The exposure doses were 0, 5, 10, 20, 30, 40, and 50 mJ/cm2. The dissolution kinetics of resist films were investigated using a QCM-based development analyzer (Litho Tech Japan RDA-Qz3).10) 2.38% TMAH aqueous solution (Tokyo Ohka Kogyo NMD-3) was used as an aqueous base developer. For a thin, rigid film applied to a crystal surface, the frequency shift ΔF linearly increases with increasing mass of the applied film:8,30)

Here, F0 is the resonant frequency at the unloaded QCM substrate, m' is the mass of the film, ρQ is the density of the quartz crystal, and μQ is its shear modulus corrected for piezoelectric stiffening.
In the patterning experiments, line patterns were fabricated. The width of lines on the mask was 20 µm. Resist solutions were spin-coated on glass substrates, dried under reduced pressure, and baked at 90 °C for 120 s to form resist films with a thickness of 0.5 µm. The resist films were exposed to UV light using the exposure system with a deep-UV-cut filter (Japan Science Engineering MA-1100) in the atmosphere. The wavelength of the light was 365 nm. The exposure intensity and dose were 45 mW/cm2 and 50 mJ/cm2, respectively. The exposed samples were developed in 2.38% TMAH aqueous solution (Parker Corporation PK-DETX2250) for 80 s using a puddle-type developing machine. The resist patterns after development were observed by SEM (Hitachi SU1510).
3. Results and discussion
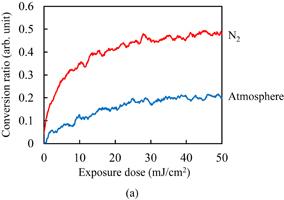
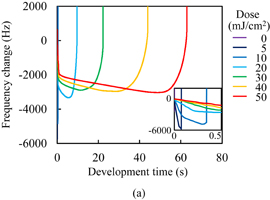
The C=C double bond conversion of Resists A and B during UV light exposure was evaluated by real-time FTIR. The polymer of Resists A and B was Polymer I. The acid value of Polymer I was 30 mg KOH/g. Upon exposure to UV light, Initiators α and β decomposed to radical species. The decomposition processes have been reported.31–33) The major radicals generated are shown in Fig. 2. These radicals induce cross-linking. The temporal changes in the conversion ratio during the exposure to UV light in the atmosphere and under N2 purging are shown in Fig. 3. The concentrations of the photoinitiators were adjusted so that the conversion ratio of Resist B agreed with that of Resist A under N2 purging, as described in Sect. 2. It has been reported that the cross-linking is inhibited by oxygen through radical scavenging.29) The effect of oxygen inhibition in Resist A was larger than that in Resist B. The reactivity of radicals generated from Initiator α with oxygen [Fig. 2(a)] was higher than that of radicals generated from Initiator β [Fig. 2(b)] in comparison with their respective reactivities with C=C double bonds. The details of the dissolution kinetics of a 0.5-µm-thick film of Polymer I without any additives have been investigated.14) The dissolution of the Polymer I film was of the peeling type owing to its low acid value. The dissolution kinetics of the photoresists with Polymer I were investigated. Figure 4 shows the frequency changes of QCM substrates with Resists A and B exposed to UV light in the atmosphere, namely, in the presence of oxygen. Upon the insertion of QCM substrates into the developer, the frequency immediately dropped by approximately 660 Hz owing to the increase in the viscosity of their surroundings. The frequency immediately after the drop was set to 0 (a base) and the frequency change was plotted in the graph. The line marked "0" in Fig. 4(a) represents the dissolution kinetics of unexposed Resist A. After the initial drop, the frequency immediately decreased by approximately another 3200 Hz. This decrease in the frequency is due to the increase in the mass of the polymer films, as indicated by Eq. (1). The increase in the mass was caused by the penetration of the developer into the resist film. The premise of Eq. (1) is that the film is rigid. However, the penetration of the developer softens the resist film.14) Therefore, we should regard Eq. (1) as a rough estimation when the swelling layer increases in thickness. Also, the frequency increased from 1.6 to 60 s. This increase is considered to be caused by the softening of the resist film. From 60 to 145 s, the frequency decreased. Owing to the softening of the resist film, the penetration of the developer into the resist film is considered to have accelerated. At 154 s, the frequency abruptly rose and started to strongly fluctuate, which was omitted from the graph to clearly display the results. The fluctuation indicates that the dissolution of these polymer films was not smooth and that the polymer layer peeled off as microscopic flakes as a result of the shear force.14,21,34) The line marked "5" in Fig. 4(a) represents the dissolution kinetics of Resist A after being exposed to 5 mJ/cm2 UV light. The double bond conversion ratio was 0.10, as shown in Fig. 3(a). The initial intake of the developer from 0 to approximately 10 s was slower than that of the unexposed photoresist. The negative peak immediately after the insertion disappeared with the slowdown of developer intake. With the progress of development, the rate of decrease in the frequency decreased and then increased after approximately 10 s (inflection point). After the inflection point at 10 s, the frequency gradually decreased to −4073 Hz. At the double bond conversion ratio of 0.10, the negative maximum of the frequency change (absolute value) of the exposed photoresist was greater than that of the unexposed photoresist. This suggests that the degree (frequency change) of developer impregnation shortly before the onset of peeling (the impregnation threshold) increased as a result of the cross-linking. After the inflection point, the rate of decrease in the frequency gradually increased with the development time. The intake rate of the developer is considered to have increased owing to the softening of the resist film. The average rate of decrease in the frequency of the exposed photoresist after the inflection point was lower than that of the unexposed photoresist owing to the cross-linking. The onset of peeling was also delayed owing to the cross-linking. For the exposure doses larger than 5 mJ/cm2, the dissolution behavior was similar to that for 5 mJ/cm2. The rate of decrease in the frequency before the onset of peeling decreased with increasing exposure dose. The onset of peeling was also delayed with increasing exposure dose. The impregnation threshold decreased at the double bond conversion of 0.14 (at the exposure dose of 10 mJ/cm2) and became approximately constant from 0.18 (at the exposure dose of >20 mJ/cm2).
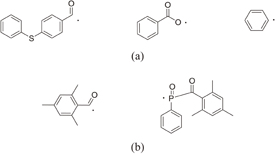
Fig. 2. Major radicals generated through the decomposition of Initiators (a) α and (b) β upon exposure to UV light.
Download figure:
Standard image High-resolution image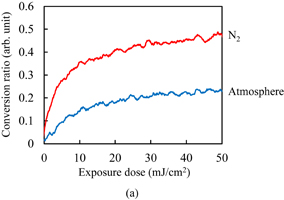
Download figure:
Standard image High-resolution image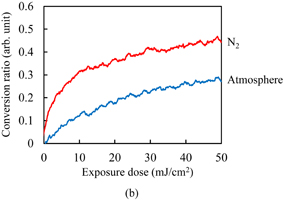
Fig. 3. Temporal changes in conversion ratio of C=C double bonds for Resists (a) A and (b) B during the exposure to UV light in the atmosphere and under N2 purging.
Download figure:
Standard image High-resolution image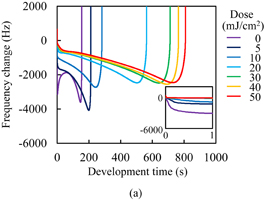
Download figure:
Standard image High-resolution image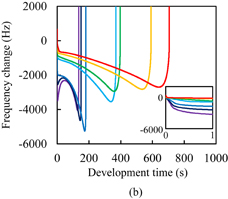
Fig. 4. Frequency changes of QCM substrates with Resists (a) A and (b) B during development. The insets are magnified views. The horizontal and vertical axes of the insets represent the development time in s and the frequency change in Hz, respectively.
Download figure:
Standard image High-resolution imageFigure 4(b) shows the dissolution kinetics of Resist B exposed to UV light in the atmosphere. The trend in the relationship between the dissolution kinetics and conversion ratio was similar to that observed in Resist A. The difference between Resists A and B is next discussed. The impregnation threshold for Resist B was higher than that for Resist A on the whole. This is considered to be caused by the differences in the concentration and molecular structure of the photoinitiators because the impregnation threshold of unexposed Resist B was higher than that of unexposed Resist A. For the rate of developer intake, the rate of decrease in the frequency before the inflection point in exposed Resist B was higher than that in exposed Resist A. The negative peak immediately after the insertion disappeared at the conversion ratio of 0.12 (at the exposure dose of 10 mJ/cm2), which was larger than that in the case of Resist A. The development time at the inflection point was earlier in Resist B than in Resist A. The rate of decrease in the frequency after the inflection point was also higher in Resist B. These results suggest that the rate of developer intake in Resist B is higher than that in Resist A. However, this contradicts the observation that the double bond conversion in Resist B is higher than that in Resist A. This disagreement was caused by the difference of the radicals generated through the decomposition of photoinitiators, because the rate of developer intake of unexposed Resist B was lower than that of unexposed Resist A.
Figure 5 shows SEM images of the cross sections of resist patterns fabricated with Resists A and B. The heights of the resist patterns were 0.40 and 0.28 µm for Resists A and B, respectively. The line widths at the top of the resist patterns were 16.2 and 15.0 µm, and those at the bottom of the resist patterns were 18.7 and 17.2 µm for Resists A and B, respectively. The taper angles were 11.1 and 6.3° for Resists A and B, respectively. Regarding the contradiction between dissolution kinetics and double bond conversion discussed previously, the observed images support our discussion of the dissolution kinetics (the exposed Resist B dissolves more easily than the exposed Resist A). However, the development time in the patterning experiment was 80 s. In the QCM experiments, even the unexposed photoresists did not dissolve within 80 s. This difference is considered to have been caused by the difference in the interaction between photoresists and substrates. Glass substrates were used for the patterning experiments. In the QCM experiments, the photoresists were spin-coated on gold electrodes on the QCM substrates. The peeling-type dissolution was considered to start earlier on the glass substrates than on the QCM substrates owing to the weak interaction between the glass substrates and photoresists. It is also possible that the patterned structures of the photoresists induced additional mechanical stress and affected the timing of the peeling in the patterning experiments.

Download figure:
Standard image High-resolution image
Fig. 5. SEM images of the cross sections of resist patterns fabricated with Resists (a) A and (b) B.
Download figure:
Standard image High-resolution imageSimilarly, the dissolution kinetics of photoresist films with Polymer II was investigated. Unlike Polymer I, a 0.5-µm-thick film of Polymer II without any additives shows the dissolution type with Case II diffusion, mainly owing to its high acid value.14) The acid value of Polymer I was 80 mg KOH/g. Figure 6 shows the temporal changes in the conversion ratio during the exposure to UV light in the atmosphere and under N2 purging. Despite the large difference in the polymer structures, in particular, the acid value and double bond content, the effects of oxygen inhibition in the photoresists with Polymer II did not significantly differ from those in the photoresists with Polymer I for each photoinitiator.
Download figure:
Standard image High-resolution image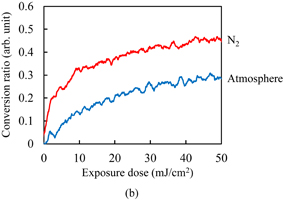
Fig. 6. Temporal changes in conversion ratio of C=C double bonds for Resists (a) C and (b) D during the exposure to UV light in the atmosphere and under N2 purging.
Download figure:
Standard image High-resolution imageThe dissolution kinetics of Resist C are shown in Fig. 7(a). The polymer changed from the dissolution type with Case II diffusion to the peeling type by adding resist components such as a monomer. For the unexposed photoresist, the initial decrease in the frequency and its rate of decrease were greater than those for Resist A. The intake of developer in the unexposed photoresist was faster than that in Resist A owing to the high acid value. No second negative peak was observed, unlike in the case of unexposed Resist A. Peeling started without any noticeable softening of the resist films, which was observed in the cases of Resists A and B. For the exposed photoresists, the frequency gradually decreased after the rapid decrease and then the peeling started. The rate of decrease in the frequency basically decreased with development time, which is in significant contrast to the photoresists with Polymer I. This suggests that the developer intake tends to saturate with development time. Figure 7(b) shows the dissolution kinetics of Resist D. Note that the scale of the horizontal axis of Fig. 7(b) is significantly different from that of Fig. 7(a). The impregnation threshold of Resist D was generally higher than that of Resist C. This is considered to be caused by the differences in the concentration and molecular structure of the photoinitiators because the impregnation threshold of unexposed Resist D was higher than that of unexposed Resist C, similarly to the case of the photoresists with Polymer I. At an exposure dose higher than 10 mJ/cm2, the rate of decrease in the frequency in Resist D was higher than that in Resist C. The onset of peeling in Resist D was also earlier than that in Resist C. These results suggest that the rate of developer intake in Resist D is higher than that in Resist C at an exposure dose higher than 10 mJ/cm2. However, this contradicts the finding that the double bond conversion in Resist D is higher than that in Resist C. This disagreement was considered to be caused by the difference of the radicals generated through the decomposition of photoinitiators, similarly to the case of the photoresists with Polymer I. On the whole, the impregnation threshold in the photoresists with Polymer II was higher than that in the photoresists with Polymer I. This is considered to be due to the hydrophobic interaction of Polymer II being stronger than that of Polymer I.
Download figure:
Standard image High-resolution image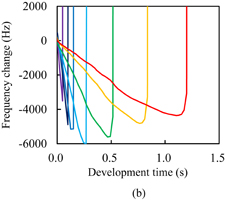
Fig. 7. Frequency changes of QCM substrates with Resists (a) C and (b) D during development. The inset of (a) is a magnified view. The horizontal and vertical axes of the inset represent the development time in s and the frequency change in Hz, respectively. The onset time of peeling and the impregnation threshold for the unexposed Resist C were 25 ms and −2365 Hz, respectively.
Download figure:
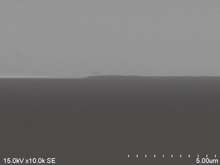
Standard image High-resolution imageIn the patterning experiments, Resist C dissolved and the resist pattern was not resolved. The peeling off of resist patterns from the substrate was observed in Resist D. Figure 8 shows an SEM image of a cross section of a resist pattern fabricated with Resist D. The height of the resist pattern was 0.18 µm. The line widths at the top and bottom of the resist pattern were 14.6 and 16.0 µm, respectively. The taper angle was 12.8°.
Fig. 8. SEM image of the cross section of the resist pattern fabricated with Resist D.
Download figure:
Standard image High-resolution image
4. Conclusions
The exposure dose dependence of the dissolution of cross-linking-type photoresists for display manufacture was investigated using the real-time FTIR and QCM methods. Two kinds of polymers (Polymer I with peeling-type dissolution and Polymer II with a dissolution type with Case II diffusion) and two kinds of photoinitiators were used. For both polymers, the dissolution type became the peeling type when they were formulated as a typical negative-type photoresist. With increasing conversion ratio of double bonds, the penetration rate of developer decreased and the impregnation threshold increased and then decreased. For Polymer I, the impregnation threshold became constant with a sufficient exposure dose. The effect of oxygen inhibition for Initiator α was larger than that for Initiator β. Although the conversion ratio in the photoresists with Initiator α was lower than that in the photoresists with Initiator β, the rate of developer intake in the photoresists with Initiator α was lower than that in the photoresists with Initiator β. This disagreement was considered to be caused by the difference of the radicals generated through the decomposition of photoinitiators.
Acknowledgment
This work was supported in part by the "Dynamic Alliance for Open Innovation Bridging Human, Environment and Materials" project from the Ministry of Education, Culture, Sports, Science and Technology of Japan (MEXT).