

Abstract
Ferromagnetic resonance (FMR) is one of the most popular techniques to characterize dynamic properties of ferromagnetic materials. Among various FMR measurement techniques, the homodyne FMR detection has been frequently used to characterize thin-film ferromagnetic multilayers owing to its high sensitivity. However, a drawback of this technique was considered to be the requirement for a structural inversion asymmetry, which makes it unsuitable to characterize a single layer of ferromagnet. In this study, we demonstrate a homodyne FMR detection of the Kittel's mode FMR dynamics of a single layer of FeNi by creating a non-uniform radio-frequency excitation current.
Export citation and abstract BibTeX RIS
Homodyne detection of ferromagnetic resonance (FMR) is a powerful technique for the characterization of magnetization dynamics in ultra-thin ferromagnetic films as well as magnetic nanostructures.1–6) It has been widely employed for various material structures including not only simple ferromagnetic multilayers but also those in combination with antiferromagnets,7,8) topological insulator,9,10) and two-dimensional (2D) materials11,12) to reveal various material and physical parameters. As the homodyne technique is sensitive to the oscillation phase of the magnetization dynamics, it has been often used to characterize the vectors of magnetic torques such as field torque, spin transfer torque,2–4,6) spin orbit torque,5,9–19) etc., in various ferromagnetic multilayers. Moreover, its high detection sensitivity allows us to investigate the magnetization dynamics in sub-nanometer-thick ferromagnetic films, which is very challenging with other FMR techniques.20)
Among various detailed configurations of homodyne FMR experiments,1,21–25) the simplest configuration might be the one that directly injects the radio-frequency (RF) current into a strip of a ferromagnetic multilayer, as reported in Ref. 5. In this experimental configuration, the magnetization dynamics is induced predominantly by the RF magnetic field26) generated by the RF current flowing in the ferromagnetic multilayer. The homodyne rectification voltage is obtained by the nonlinear mixing of the magnetoresistance oscillation owing to the magnetization dynamics and RF current. A general requirement for the FMR measurement is that the multilayer structure needs to have a broken inversion symmetry, leading to a torque, which drives the magnetization dynamics. The simplest example is a ferromagnetic (FM)/non-magnetic (NM) metallic bilayer, in which the RF current flowing in the NM induces an RF magnetic field in the FM. As the structural inversion asymmetry is imperative for this experimental configuration, the only drawback of this technique has been considered to be the inability to characterize a single layer of ferromagnet.
In this study, we investigated the homodyne FMR detection of a single layer of ferromagnet by utilizing spatially non-uniform RF current injection. We show that this technique with an appropriate design can detect a uniform FMR mode (Kittel's mode). On the other hand, our results suggest that the line-shape analysis used to obtain the spin orbit torque5) may result in a large error at particular conditions.
We prepared Fe20Ni80 (5 nm)/SiO2 (5 nm) films grown on a thermally oxidized Si substrate by RF magnetron sputtering. The film was patterned into a 10-µm-wide strip attached to a coplanar waveguide facilitating the RF current injection into the strip by a G-S-G microwave probe by GGB Industries. As shown in the magnified image in Fig. 1(a), the active measurement area is 10 × 10 µm2. The root-mean-square (RMS) magnitude of the RF current was fixed at 13 mA. The resistance of the active area was measured to be 101 Ω. The homodyne FMR measurement was performed by sweeping the external magnetic field at a fixed frequency of the RF current. Figure 1 shows a schematic illustration of the experimental setup. The external magnetic field was applied in the sample plane, at θ = 45° with respect to the x-axis [see Fig. 1(a) for the coordinate system]. Three different ways of probe contact, labeled as GS1, GSG, and GS2, were tested, as shown in Fig. 1(b), in order to investigate the effect of the non-uniform RF current. The RF current distribution in the FeNi strip was simulated by a finite element method. For example, the contact GS1 leads to a considerably non-uniform current distribution with a larger current density on the left side of the strip, as shown in Fig. 1(c). This non-uniform current distribution is nontrivial in some conditions, and is a key factor to obtain a homodyne rectified signal originating from the FMR of the Kittel's mode, as discussed below.
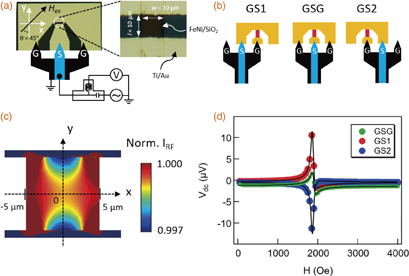
Fig. 1. (a) Optical microscopy image of the analyzed device with the microwave probe for the homodyne detection. (b) Three different probe contacts: GS1, GSG, and GS2. (c) Distribution of the y-component current (normalized) in the active part (ferromagnetic part) with the probe contact GS1. (d) Homodyne voltages as a function of the external field with the GS1, GSG, and GS2 contacts. The RF-current frequency is fixed at 13 GHz.
Download figure:
Standard image High-resolution imageFigure 1(d) shows representative FMR spectra with a 13-GHz RF current obtained for the GS1, GSG, and GS2 probe contacts. For all of the probe contacts, we obtained a measurable DC voltage at the resonant condition. The GSG leads to a significantly smaller voltage than those of the other contacts; GS1 and GS2 lead to comparable absolute values of their peak voltages, but the polarity is reversed.
The general form of the homodyne rectified DC voltage Vdc can be expressed as5,6)
where γ is the gyromagnetic ratio, Hex is the external field, f is the resonance frequency, IRF is the RF current flowing in the strip, ![$S(H_{\text{ex}}) = 1/[(H_{\text{ex}} - H_{\text{res}})^{2}/\Delta H^{2} + 1]$](https://content.cld.iop.org/journals/1882-0786/11/5/053008/revision1/AP180246if001.gif) and
and ![$A(H_{\text{ex}}) = [(H_{\text{ex}} - H_{\text{res}})/\Delta H]/[(H_{\text{ex}} - H_{\text{res}})^{2}/\Delta H^{2} + 1]$](https://content.cld.iop.org/journals/1882-0786/11/5/053008/revision1/AP180246if002.gif) with a linewidth of ΔH are the symmetric and antisymmetric Lorentzians, respectively, and PS and PA are pre-factors whose values are determined by the direction and magnitude of the torque, which drives the precession. The rate of the resistance change with respect to the magnetization direction dR/dθ, owing to the anisotropic magnetoresistance of Fe20Ni80, is one of the important factors, which determines the magnitude of Vdc. By fitting the FMR spectra with Eq. (1), we obtain Hres and ΔH. The symmetric voltage VS and antisymmetric voltage VA, equivalent to the products of all of the pre-factors with
with a linewidth of ΔH are the symmetric and antisymmetric Lorentzians, respectively, and PS and PA are pre-factors whose values are determined by the direction and magnitude of the torque, which drives the precession. The rate of the resistance change with respect to the magnetization direction dR/dθ, owing to the anisotropic magnetoresistance of Fe20Ni80, is one of the important factors, which determines the magnitude of Vdc. By fitting the FMR spectra with Eq. (1), we obtain Hres and ΔH. The symmetric voltage VS and antisymmetric voltage VA, equivalent to the products of all of the pre-factors with  and
and  , respectively, are also obtained. The resonant conditions of the uniform FMR mode can be analyzed by the Kittel's equation:
  , where 4πMs is the demagnetizing field. The Gilbert damping α can be estimated by:
  , where ΔH0 is the so-called inhomogeneous broadening.27)
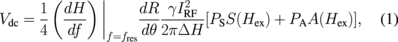
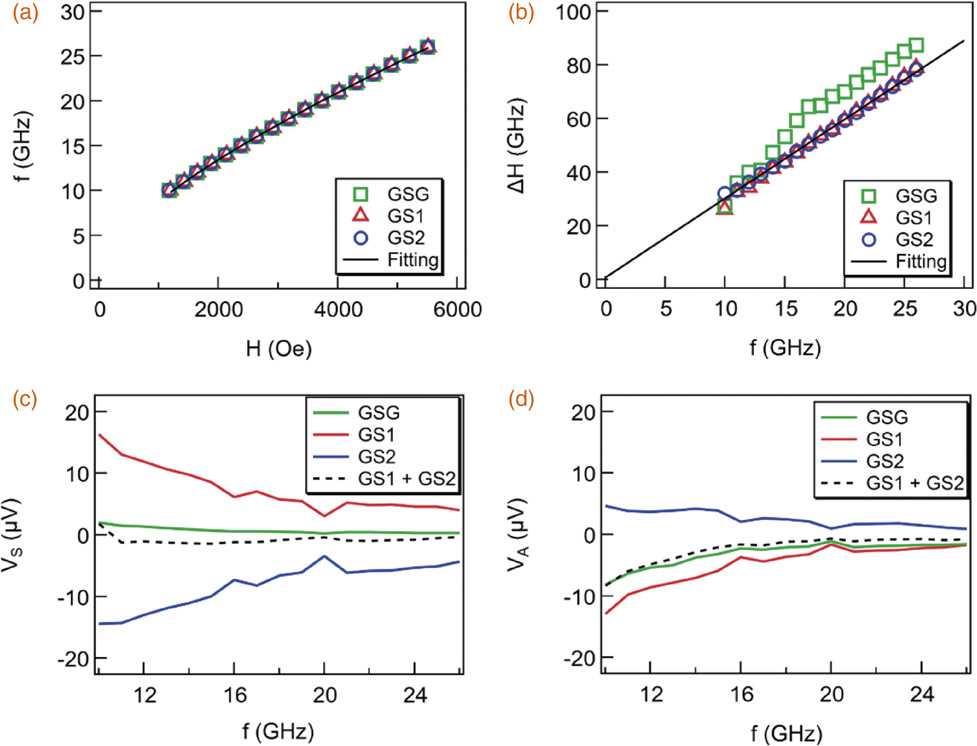
Figure 2 shows a summary of the experimental data. Regardless of the probe contact type, the resonant conditions are almost equal, as shown in Fig. 2(a). The Kittel's equation yields 4πMs = 1.05 T, in a good agreement with the saturation magnetization of Fe20Ni80, which demonstrates that the detected magnetization dynamics is indeed a uniform FMR mode (Kittel's mode), irrelevant to a spatially non-uniform mode such as spin waves.28) The frequency-dependent ΔH yields a Gilbert damping of α = 0.008 and ΔH0 ≈ 0 Oe. The obtained Gilbert damping is as small as previously reported values for a single layer of FeNi.29,30) The PS and PA as a function of the frequency are plotted in Figs. 2(c) and 2(d), respectively. It is noticeable that the voltage polarities for the GS1 and GS2 configurations are opposite in the entire frequency range. Furthermore, the voltage signal for the GSG configuration is very close to the sum of the voltages for the GS1 and GS2 configurations, strongly indicating that the rectified voltages are related to the RF current distribution owing to the probe contact configurations. We discuss below the effects of the RF current distribution on the homodyne FMR detection by numerical simulations using the finite element method.
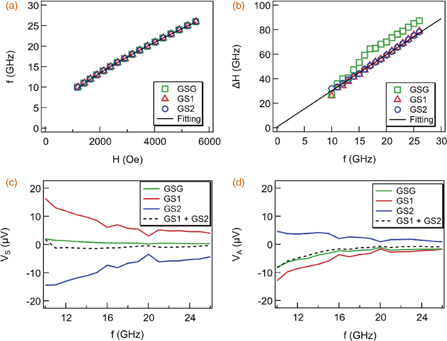
Fig. 2. (a) Resonant field as a function of the frequency, and Kittel's fitting. (b) Linewidth as a function of the frequency with the linear fitting to obtain the Gilbert damping constant. (c) Symmetric voltage VS and (d) antisymmetric voltage VA as a function of the frequency. The dotted lines represent the sums of the VA and VS.
Download figure:
Standard image High-resolution imageThe numerical simulations were performed for various geometries: w = 1, 5, 10, 15, and 20 µm and l = 10 µm. We set the conductivities of the ferromagnet part σFM and coplanar waveguide electrode σCPW to be variables. We focus on the distribution of the y-component current along the x-axis (at y = 0) in the following discussion [see Fig. 1(c) for the actual spatial distribution and coordinate system]. Figure 3(a) shows the RF current distributions (normalized by the RF current with GSG at x = −5 µm) for the GSG, GS1, and GS2 configurations for w = 10 µm. Asymmetry is observed in the current distributions for GS1 and GS2. The asymmetric current distributions become more significant with the decrease of the conductivity ratio g = σCPW/σFM [Fig. 3(b)] and increase of the width w of the active area [Fig. 3(c)]. Figure 3(d) shows the dHRF/dIRF as a function of the x position, where HRF is the RF field perpendicular to the film plane. The current distributions in the x-direction basically generate the magnetic field in the z-direction, consistent with the Biot–Savart law: HRF = (1/2π)(dIy/dx). As expected, asymmetric dHRF/dIRF distributions are obtained for the GS1 and GS2 configurations. The average value of dHRF/dIRF along the x-direction (≡ 〈dHRF/dIRF〉) is zero for the GSG configuration; it is positive and negative for GS1 and GS2, respectively, as shown in the inset of Fig. 3(e). The results show that 〈dHRF/dIRF〉 significantly depends on both conductivity ratio g and width w of the active area, as shown in Fig. 3(e). This non-zero 〈dHRF/dIRF〉 generates the homodyne rectified voltage, as discussed below.
Fig. 3. Normalized current in the y-direction as a function of x for the (a) three different probe contacts, (b) various g with GS1, and (c) various w with GS1. (d) dHRF/dIRF as a function of x with GS1. (e) 〈dHRF/dIRF〉, the averaged dHRF/dIRF over the x-axis, as a function of g for various w with GS1. The inset shows 〈dHRF/dIRF〉 for the different probe contacts. (f) Symmetric voltage VS as a function of g for w = 10 µm with GS1. The black marker denotes the experimentally obtained VS at the estimated g for our device.
Download figure:
Standard image High-resolution image
Assuming the HRF in the z-direction is the only driving force, PS and PA in Eq. (1) become PS = dHRF/dIRF and PA = 0, respectively.31) The experimentally obtained |VS| > |VA| [see Figs. 2(c) and 2(d)] is roughly consistent with this assumption. The non-zero VA obtained in the experiment implies that there is also a driving field parallel to the sample plane owing to, for example, structural imperfections,32) which cannot be reproduced by the presented numerical simulations. Based on Eq. (1) with the simulated 〈dHRF/dIRF〉, we verify the experimentally obtained homodyne voltages with a focus on the set of data at 13 GHz with the nominal RMS RF current of 13 mA for GS1. The experimentally obtained values dR/dθ = 0.8 Ω/rad and  yield VS as a function of the conductivity ratio g, as shown in Fig. 3(f). The homodyne voltages become remarkably large when the conductivity ratio g decreases; the current distribution becomes more significant. For the actual analyzed device with σFM = σFeNi ∼ 2 × 10⁶ S/m and σCPW = σAu ∼ 4.2 × 10⁷ S/m, g ∼ 21 yields VS ∼ 5.6 µV, which is reasonably close to the experimentally obtained value of VS ∼ 12 µV [Fig. 2(e)]. For GS2, the polarity of 〈dHRF/dIRF〉 is reversed, as the current distribution inverts [see the inset of Fig. 3(e)]. Therefore, the resulting VS in the GS2 configuration reverses its sign compared to that in the GS1 configuration, which is consistent with our experimental observation of the sign reversal of VS [Fig. 2(c)].
In conclusion, we demonstrated a homodyne FMR detection of the Kittel's mode dynamics of a single layer of FeNi by creating a non-uniform RF current. The simulations of the current and magnetic field distributions using the finite element method reproduced well the experimentally obtained homodyne voltages. Although the homodyne FMR measurements have been considered a well-established technique, we showed that the little tweak could make the technique serve for a single layer ferromagnet, previously considered undoable. Our results warn that the line-shape analysis used in context of the spin-torque FMR measurements5) might not be appropriate if the device configuration meets particular conditions (particularly when g is small), in which the current distributions easily ruin the VS/VA relation used for characterizing the spin-torque.
Acknowledgments
This study was supported by JSPS KAKENHI Grant Numbers 17H04924, 17H05181, and 15H05702.