

Abstract
The 3d transition metal oxides with layered structures, NaxMO2 (M = Mn, Co), are promising cathode materials for Na-ion secondary batteries. Here, we investigate the electronic structure of the M of four layered oxides (Na0.91CoO2, Na0.66CoO2, Na1.00MnO2, and Na0.54MnO2) by means of high energy resolution fluorescence detected X-ray absorption near-edge structure, which utilizes the 1s core-hole lifetime-broadening reduction. The highly energy-resolved spectroscopy reveals a shoulder structure in the pre-edge regions of the Co K-edge spectra in Na0.91CoO2. The structure is ascribed to the transition to the Co 3d/4p states via slight hybridization with the Na 3s state.
Export citation and abstract BibTeX RIS
X-ray absorption fine structure (XAFS) is widely used to evaluate local structures and electronic states in material sciences.1–3) In particular, X-ray absorption near-edge structure (XANES) regions provide chemical information on materials such as the oxidation states of metal compounds. Although XANES recorded with transmission mode or total fluorescence mode is very convenient for material science, the energy resolution is not necessarily sufficient to explain the d-electron configuration. Recently, high-energy-resolution fluorescence detected XANES (HERFD-XANES) has been receiving much attention because it reveals a detailed electronic structure4–6) that cannot be detected by conventional XANES. For example, the energy resolution of the Pt L3-edge XANES spectrum was improved by HERFD-XANES from 5.2 eV to 2.4 eV due to a core-hole lifetime-broadening reduction. The improved energy resolution clarified fine structures in the Pt L3-edge spectrum of Pt nanoparticle catalysts in polymer electrolyte fuel cells, which suggests that surface hydrated species increase the overpotential and hence decrease the energy conversion efficiency.4)
Figure 1(a) shows the schematic diagram of the X-ray absorption and fluorescence processes at the transition metal (TM) K-edge. The X-ray absorption and fluorescence processes contribute to the transmission XANES and HERFD-XANES, respectively. In the case of the transmission XANES, the lifetime of the absorption process from the 1s core to the 4s (or 3d) level is very short and hence causes the low energy resolution of the spectroscopy. For example, the spectral width (1s core-hole lifetime width ΓK) for Mn and Co is 1.16 and 1.33 eV, respectively.7) On the other hand, the effective lifetime width of HERFD-XANES (Γ) is given by

where ΓM is the 3p core-hole lifetime width.8) The lifetime of the fluorescence process from the 3p core to the 1s core level is rather long, and hence, Γ is mainly determined by ΓM. In other words, HERFD-XANES uses ΓM instead of ΓK to improve the energy resolution of the spectra. In the actual measurement of HERFD-XANES, the detection energy of the scattered X-ray is fixed at the  fluorescence line while the energy of the incident X-ray is scanned over the absorption edge [Fig. 1(b)].

Fig. 1. (Color online) (a) X-ray absorption and fluorescence processes. The former and latter processes were used in the transmission XANES and HERFD-XANES, respectively. ΓK and ΓM are the 1s core-hole and 3p core-hole lifetime widths, respectively.  is the transition from the M3- to the K-shell.
  is the transition from the M2- to the K-shell. (b) Experimental setup for HERFD-XAFS. The detection photon energy of the scattered X-ray is fixed at an energy of the Kβ1,3 fluorescence line, while the energy of the incident X-ray is scanned over the absorption edge.
Download figure:
Standard image High-resolution imageSodium-ion secondary batteries (SIBs) have attracted much attention as promising candidates for next-generation batteries beyond lithium-ion secondary batteries.9–12) Among several types of cathode materials for SIBs, layered TM oxides NaxMO2(M = Co, Mn) are the most typical and promising.13,14) They consist of MO2 sheets of edge-sharing MO6 octahedra. In the charge process, Na+ is extracted between the neighboring MO2 sheets and an electron is removed from the MO2 sheets. In the discharge process, Na+ is inserted between the neighboring MO2 sheets and an electron is added to the MO2 sheets. In order to develop high-performance materials for SIBs, deeper comprehension of the electronic states of TMs is indispensable.
In this paper, we investigate the electronic structure of the TM of four layered oxides (Na0.91CoO2, Na0.66CoO2, Na1.00MnO2, and Na0.54MnO2) by means of HERFD-XANES with high energy resolution. As far as we know, there exists no report on the application of HERFD-XANES to TMs in battery materials. The highly energy-resolved spectroscopy revealed a shoulder structure in the pre-edge regions of the Co K-edge spectra in Na0.91CoO2. The structure is ascribed to the transition to the Co 3d/4p state via slight hybridization with the Na 3s state.
Layered oxides were prepared by solid-state reaction. For Na0.91CoO2, Na2O2 and Co3O4 were mixed in a 1.25:1 atomic ratio and calcined at 823 K for 16 h in O2. Then, the product was finely ground, and again calcined in the same conditions. For Na0.66CoO2, Na2CO3 and Co3O4 were mixed in a 0.7:1 atomic ratio and calcined at 1073 K for 12 h in air. For Na1.00MnO2, Na2CO3 and Mn2O3 were mixed in a 1:1 atomic ratio and calcined at 943 K for 24 h in Ar. For Na0.54MnO2, Na2CO3 and MnCO3 were mixed in a 0.7:1 atomic ratio and calcined at 1273 K for 12 h in air. The Na concentrations were determined by Rietveld analyses of the synchrotron-radiation X-ray powder diffraction (XRD) patterns, as described below.
Synchrotron-radiation XRD measurements were performed at the BL-8A beamline of the Photon Factory, KEK. The samples were finely ground and placed in ϕ0.3 mm glass capillaries. The capillaries were sealed and mounted on a Debye–Scherrer camera. The powder diffraction patterns were detected with an imaging plate. The exposure time was 5 min. The wavelength (=0.68903 Å) of the X-ray was calibrated by the lattice constant of standard CeO2 powders. The XRD patterns of O3-Na0.91CoO2 were analyzed by the Rietveld method (RIETAN-FP)15) with a trigonal model (R m; Z = 3, hexagonal setting). The XRD pattern of the Mn-based O'3-Na1.00MnO2 was analyzed by the Rietveld method with a monoclinic model (C2/m; Z = 2). The XRD patterns of P2-Na0.66CoO2 and P2-Na0.54MnO2 were analyzed by the Rietveld method with a hexagonal model (P63/mmc; Z = 2). The XRD patterns and Rietveld refinement profiles are shown in Figs. S1–S4, available online at stacks.iop.org/APEX/12/052005/mmedia. In all compounds, no traces of impurities or secondary phases were observed. The obtained structural parameters are listed in Tables S1–S4.
The Co and Mn K-edge XANES spectra were measured in both the transmission and HERFD modes. The measurements of the transmission XANES were conducted at the BL-9C beamline of the Photon Factory, KEK. The powder was finely ground, mixed with BN, and pressed into pellets 5 mm in diameter. The transmission XANES spectra were recorded with a Si (111) double-crystal monochromator at 300 K. The energy resolution (ΔE/E) was ∼2 × 10⁻⁴ and the photon flux at the sample position was ∼1 × 10¹¹ phs s−1. The measurements of HERFD-XANES were carried out at the contract undulator beamline BL11XU of SPring-8.16,17) The incident X-ray beam was monochromatized with a Si (111) double-crystal monochromator followed by a two-bounce Si (400) channel-cut monochromator to further increase the incident energy resolution (ΔE = 263 meV at 7670 eV and ΔE = 288 meV at 6460 eV). The pellet sample was placed at a normal incident angle (ϕ = 85°) and a grazing exit angle (θ = 5°) to the surface in order to suppress self-absorption.18) The estimated contributions of self-absorption for the pre-edge regions at the Co and Mn K-edges were less than 0.5% and therefore negligible. The estimated contributions of self-absorption for the main absorption peak at the Co and Mn K-edges were less than 10%. The details of the estimation are described in the supplementary data. The beam size at the sample position was about 0.05 mm (horizontal) × 1 mm (vertical) and the photon flux was ∼8 × 10¹² phs s−1. The emitted X-rays in the horizontal plane were analyzed by a Rowland mount type emission spectrometer. To select the Co  fluorescence line (∼7650 eV), a Ge (444) spherically bent analyzer was used. The total energy resolution was ∼1.2 eV at 7650 eV. To select the Mn
  fluorescence line (∼6490 eV), a Si (333) spherically bent analyzer was used. The total energy resolution was ∼1.2 eV at 6490 eV. In the analyses, background subtraction and normalization were performed using the ATHENA program.19)
The partial density of states (pDOS) was calculated for O3-NaCoO2 and O'3-NaMnO2 based on the density functional theory with use of the PWscf package.20) A plane wave basis set with a cutoff energy of 952 eV was chosen, and projector augmented-wave potentials were used. We adopted the exchange–correlation functional of the Perdew–Burke–Ernzerhof type within the generalized gradient approximation. Electron spin was taken into account in the level of local spin density approximation. In the calculation of O3-NaCoO2, we used the lattice constants (a and c) and atomic coordinates of O3-Na0.91CoO2 obtained by Rietveld refinement (Table S1). In the calculation of O'3-NaMnO2, we used the lattice constants (a, b and c) and the atomic coordinates of O3-Na1.00MnO2 obtained by Rietveld refinement (Table S3). Brillouin-zone sampling for the pDOS calculations was made using the Monkhorst–Pack method with 36 × 36 × 24 and 24 × 36 × 24 k points for O3-NaCoO2 and O'3-NaMnO2, respectively.
Figure 2(a) shows the Co K-edge XANES spectra of Na0.91CoO2 recorded in the HERFD (red circles) and transmission (solid black line) modes. The main absorption peak observed at 7725 eV is ascribed to the electric dipole transition from the Co 1s to the Co 4p orbital. Although the peak-top intensity of the Co K-edge HERFD-XANES spectrum is slightly higher than that of the transmission spectra, the peak width has no significant spectral difference between the two modes, indicating the main peak has an intrinsic linewidth greater than ΓK (=1.33 eV). Importantly, we observed a significant spectral difference in the pre-edge region [inset in Fig. 2(a)]. The HERFD-XANES spectrum shows a shoulder structure at around 7708 eV while no trace of the structure is discernible in the conventional transmission spectrum. Figure 2(b) shows the Mn K-edge XANES spectra of Na1.00MnO2 recorded in the HERFD (red circles) and transmission (solid black line) modes. The main absorption peak observed at 6555 eV is ascribed to the electric dipole transition from the Mn 1s to the Mn 4p orbital. Although the peak-top intensity of the Mn K-edge HERFD-XANES spectrum is slightly higher than that of the transmission spectra, the peak width has no significant spectral difference between the two modes, indicating the main peak has an intrinsic linewidth greater than ΓK (=1.16 eV). In the pre-edge region [inset in Fig. 2(b)], however, we observed a significant spectral difference between the two modes, reflecting higher energy resolution in the HERFD mode. The HERFD-XANES spectrum shows two well-resolved sharp absorptions at 6535 and 6537 eV. This makes a sharp contrast with the much broader structure in the transmission mode. Similarly, we observed extra fine pre-edge structures in the Co K-edge XANES spectrum of Na0.66CoO2 and the Mn K-edge XANES spectrum of Na0.54MnO2 recorded in HERFD mode (Fig. S5).

Fig. 2. (Color online) (a) Co K-edge XANES spectra of Na0.91CoO2 recorded in the HERFD (red circles) and transmission (black solid line) modes. The two spectra were normalized at 7749 eV. (b) Mn K-edge XANES spectra of Na1.00MnO2 recorded in the HERFD (red circles) and transmission (black solid line) modes. The two spectra were normalized at 6579 eV. The insets show the magnified spectra around the pre-edge regions.
Download figure:
Standard image High-resolution imageIn Fig. 3(a), we compare the Co K-edge HERFD-XANES spectra in the pre-edge region between Na0.91CoO2 and Na0.66CoO2. With an increase in the formal valence of Co from +3.09 (Na0.91CoO2) to +3.34 (Na0.66CoO2), the intensity of the band at 7706 eV increases. This behavior is reasonable because Na0.66CoO2 has a higher density of states in the unoccupied 3d orbitals. In Fig. 3(b), we compare the Mn K-edge HERFD-XANES spectra in the pre-edge region between Na1.00MnO2 and Na0.54MnO2. In both spectra, two well-resolved absorption bands are observed at 6535 eV and 6537 eV. With an increase in the formal valence of Mn from +3.00 (Na1.00MnO2) to +3.46 (Na0.54MnO2), the intensity of the higher-lying band at 6537 eV increases. This behavior is reasonable because Na0.54MnO2 has a higher density of states in the unoccupied 3d orbitals.
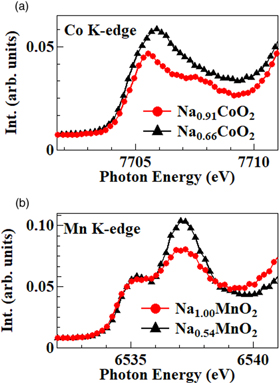
Fig. 3. (Color online) (a) Pre-edge region of Co K-edge XANES spectra for Na0.91CoO2 and Na0.66CoO2 recorded in the HERFD mode. (b) Pre-edge region of Mn K-edge XANES spectra for Na1.00MnO2 and Na0.54MnO2 recorded in the HERFD mode.
Download figure:
Standard image High-resolution imageLet us compare the K-edge HERFD-XANES spectra in the pre-edge region with first-principles calculations. Figure 4(a) shows the Co (blue curves), O (red curves), and Na (green curves) pDOSs of O3-NaCoO2. The system is a non-magnetic insulator with a gap of ∼1 eV.20) The O3-type structures consist of CoO2 sheets of edge-sharing CoO6 octahedra, causing crystal field splitting of the Co 3d orbital into the lower-lying t2g and upper-lying eg ones. The t2g and eg states correspond to the bands at around −0.8 and 1.6 eV, respectively. The t2g band is fully occupied while the eg band is unoccupied. We observed strong O 2p–Co 3d hybridization in both the t2g and eg bands. The 7706 eV peak observed in the Co K-edge spectrum in the pre-edge region [Fig. 3(a)] is assigned to the transition from the Co 1s to the eg band. We note that a rather broad Na 3s state is observed at higher-energy regions above 4 eV. We calculated the integrated pDOSs in the Na 3s band from 3.5 to 6.0 eV (see Table I). Even though the Na 3s band is dominated by Na 3s and O 2p states, the band contains Co 4s (l = 0), Co 4p (l = 1) and Co 3d (l = 2) states. This suggests that the Co 3d/4s/4p states are hybridized with the Na 3s and O 2p states. We further confirmed that the errors of the pDOSs were within 6.5% by ab initio calculations under four different conditions (Table S5). Since the Co 1s–Co 4s transition is forbidden, we ascribe the shoulder structure above 7708 eV to the transition to the Co 3d/4p states via slight hybridization with the Na 3s state. The shoulder structure seems to disappear in Na0.66CoO2. This is probably due to the energy difference between the up- and down-spin eg bands, and the resultant broadening of the XANES spectrum. In fact, an ab initio calculation of P2-Na1/2CoO221) shows an energy difference of ∼1 eV between the up- and down-spin eg bands.

Fig. 4. (Color online) Calculated pDOSs of (a) O3-NaCoO2 and (b) O'3-NaMnO2. The insets show the schematic structures of O3-NaCoO2 and O'3-NaMnO2. EF is the Fermi level.
Download figure:
Standard image High-resolution image
Table I. Integrated pDOS in the Na 3s band from 3.5 to 6.0 eV for O3-NaCoO2. l is the azimuthal quantum number. Errors are evaluated by ab initio calculations under four different conditions. (See Table S5.)
| Element | Na | O | Co (l = 0) | Co (l = 1) | Co (l = 2) |
|---|---|---|---|---|---|
| pDOS (state/FU) | 0.3421 | 0.1749 | 0.0167 | 0.0005 | 0.0085 |
| Error (%) | 1.5 | 0.6 | 6.5 | 0.1 | 5.4 |
Figure 4(b) shows the Mn (blue curves), O (red curves), and Na (green curves) pDOSs of O'3-NaMnO2. The system is an antiferromagnetic insulator with a gap of ∼1 eV. The total energy of the antiferromagnetic state is lower by 65 ± 2 meV/FU than that of the competing ferromagnetic state. The magnitude and direction of the Mn spin are 3.09 mB and perpendicular to the MnO2 layer, respectively. The electronic structure of NaMnO2 is similar to that of isostructural LiMnO2.22) The O'3-type structures consist of MnO2 sheets of edge-sharing MnO6 octahedra with Jahn–Teller distortion, causing crystal field splitting of the Mn 3d orbital into the lower-lying t2g and upper-lying eg ones. The t2g and eg bands correspond to the bands around 1.0 and 2.4 eV, respectively. The fine structure in the t2g bands is tentatively ascribed to the Jahn–Teller distortion. We observed strong O 2p–Mn 3d hybridization in both the t2g and eg bands. The 6535 eV and 6537 eV peaks observed in the Mn K-edge spectrum in the pre-edge region [Fig. 3(b)] are assigned to the transition from the Mn 1s to the t2g and eg bands, respectively. As in the case of Na0.91CoO2, we may expect a shoulder structure due to the transition to the Mn 3d/4p states (see Table II and Table S6). However, no trace of the structure is observed in Na1.00MnO2 and Na0.54MnO2. This is probably because the lower-lying tail of the strong main absorption at 6555 eV obscures the structure.
Table II. Integrated pDOS in the Na 3s band from 3.0 to 5.0 eV for O'3-NaMnO2. l is the azimuthal quantum number. Errors are evaluated by ab initio calculations under four different conditions. (See Table S6.)
| Element | Na | O | Mn (l = 0) | Mn (l = 1) | Mn (l = 2) |
|---|---|---|---|---|---|
| pDOS (state/FU) | 0.2448 | 0.1552 | 0.0392 | 0.0003 | 0.0340 |
| Error (%) | 3.4 | 0.9 | 7.1 | 1.7 | 2.8 |
Now, let us discuss the interrelation between the intrinsic linewidth and the core-hole lifetime width (ΓK and ΓM). In both the Co and Mn compounds, the peak widths of the main absorption peaks that are dominated by the 1s–4p transition show no significant difference between the two modes (Fig. 2, Table S7). In addition to the small contribution of self-absorption to the main absorption peak (less than 10%), this observation indicates that the intrinsic linewidths of the main peaks are greater than ΓK. Probably, the main peak is overlapped by the transition to the continuum states such as 5p, 6p, and 7p, causing the wide linewidth. On the other hand, the spectral profiles due to the 1s–3d transition in the pre-edge region show significant difference between the two modes. This observation indicates that the intrinsic linewidths of the 1s–3d transitions are narrower than ΓK. As explained in the introduction, the lifetime width of HERFD-XANES (Γ) is mainly determined by ΓM instead of ΓK. Considering that the 2p core-hole lifetime width ΓL of Mn is ∼0.5 eV,5) the value of ΓM (<ΓL) is considered to be much smaller than 0.5 eV. For a further quantitative argument, we should properly consider the instrumental resolution. In the HERFD-XANES at the BL11XU beamline of SPring-8, the instrumental resolution (Γinst), which mainly originated in the linewidth of the incident X-ray and the crystal analyzer, was ∼1.2 eV at the Co and Mn  fluorescence line. We note that Γinst is comparable to ΓK of Co (=1.33 eV) and Mn (=1.16 eV). Then, the actual energy resolution of the HERFD-XANES is mainly governed by Γinst and is slightly higher than 1.2 eV. Future improvements of the spectrometer as well as of the X-ray source would enhance the energy resolution.
In conclusion, we investigated the electronic structure of the TM of four layered oxides (Na0.91CoO2, Na0.66CoO2, Na1.00MnO2, and Na0.54MnO2) by means of HERFD-XANES with high energy resolution. The highly energy-resolved spectroscopy revealed a shoulder structure in the pre-edge regions of the Co K-edge spectra in Na0.91CoO2. The structure is ascribed to the transition to the Co 3d/4p states via slight hybridization with the Na 3s state. Our experiment demonstrates that HERFD-XANES can clarify the fine structures in the pre-edge regions of Co and Mn K-edge spectra. We believe that application of HERFD-XANES to other TM battery materials will contribute to deeper comprehension of the variation of electronic structure with redox processes. We note that HERFD-XANES, which uses hard X-ray with high transmittance in materials, is suitable for in situ/operando measurements under electrochemical control.
Acknowledgments
This work was supported by JSPS KAKENHI (Grant Number JP16K20940 and JP17H0113). A part of this work was performed under the Shared Use Program of the National Institutes for Quantum and Radiological Science and Technology (QST) Facilities (Proposal No. 2016B-H03 and 2017A-H04) supported by the QST Advanced Characterization Nanotechnology Platform as a program of the "Nano-Technology Platform" (Project No. A-16-QS-0018 and No. A-17-QS-0004) of the Ministry of Education, Culture, Sports, Science and Technology, Japan. The synchrotron-radiation experiments of HERFD-XAFS were performed at BL11XU of SPring-8 with the approval of the Japan Synchrotron Radiation Research Institute (Proposal No. 2016B3563 and No. 2017A3584). The transmission-mode XAFS measurements were performed at BL-9C under the approval of the Photon Factory Program Advisory Committee (Proposal No. 2016G043 and 2017G002) and the X-ray powder diffraction experiments were performed at BL-8A under the approval of the Photon Factory Program Advisory Committee (Proposal No. 2014G507). Part of the ab initio calculation was performed using the supercomputing resources at Cyberscience Center, Tohoku University.