

Abstract
Recently, it was demonstrated that environmental heat can put a battery on the charged state by using the difference in the thermal coefficient α (= dV/dT) of the redox potential (V) between the cathode and anode materials. In this battery, α is the key parameter that determines the device performance. Here, we systematically investigated α in prototypical conjugated polymers, i.e. polythiophene and four fluorene-based polymers. We found that α steeply increases with the number ratio (r) of thiophene in the main chain from 0.19 mV K−1 at r = 0.0 to 1.08 mV K−1 at r = 1.0. This trend is well understood in terms of variation of the vibrational entropy Svib between the neutral and oxidized states of the constituent molecule.
Export citation and abstract BibTeX RIS
1. Introduction
To attain a "smart" society, it is crucial to develop novel energy-harvesting technologies that produce electric energy efficiently and inexpensively from human body heat or waste heat near room temperature. Recently, it was demonstrated that environmental heat can put a battery on the charged state by using the difference Δα in the thermal coefficient α (= dV/dT) of the redox potential (V) between the cathode and anode materials.1–6) Hereafter, we call such a battery as "tertiary battery", because it is charged by the environmental heat, not by the electric energy. The tertiary battery generates electric energy in the thermal cycle between low (TL) and high (TH) temperatures. In the warming process, one can obtain the cell voltage (Vcell) of ΔαΔT (ΔT = TH − TL) and can extract the accumulated electric energy by discharging the cell at TH. Similarly, one obtains Vcell of −ΔαΔT in the cooling process. Shibata et al.4) demonstrated that high thermal efficiency η of 1.0% was attained between TL (= 295 K) and TH (= 323 K) in a tertiary battery consisting of two kinds of Prussian blue analogs with different α. Thus, α5,7,8) is the key parameter that determines the performance of the tertiary battery. From a thermodynamic point of view, α is nothing but  with the elementary charge e (≥0) and difference ΔS in entropies (S) of the system between the reduced and oxidized states. Importantly, the redox process of a battery influences not only the solid electrode but also the electrolyte. Therefore, ΔS consists of the solid (ΔSsolid) and electrolyte (ΔSelectrolyte) components.9)
Among the battery materials, conjugated polymers have advantages, like light weight, flexibility, environmental frendness.10–13) For example, polyacetylene,14) poly(p-phenylene) (PPP),14,15) and polythiophene,16) show reversible redox process between the reduced, neutral and oxidized states. Polythiophene and its derivatives have been extensively investigated in applications, since they are highly stable in their neutral states, easy to structural modification, and processable in solution.17–19) The poly(3-alkylthiophenes), a prototype of this class of compounds, exhibit the best device characteristics.20–26) On the other hand, fluorene-based polymers show quite high fluorescence quantum yields of 0.6–0.8 in solid and have been applied to light-emitting diodes due to their chemical and thermal stabilities.27–30) Figure 1 shows prototypical thiophene and fluorene-based polymers, that is, poly(3-hexylthiophene-2,5-diyl) (P3HT), poly(9,9-dioctylfluorene-co-dithienyl-benzothiadiazole) (F8TBT), poly(9,9-dioctyl-fluorene-co-bithiophene) (F8T2), poly(9,9-dioctylfluorene-co-N-(4-butylphenyl)diphenylamine) (TFB), poly(9,9-dioctylfluorene-co-N,N'-bis(4-butylphenyl)-N,N'-diphenyl-1,4-benzenediamine) (PFB), together with the energy levels (EHOMO) of the highest occupied molecular orbital (HOMO) and that (ELUMO) of the lowest unoccupied molecular orbital (LUMO). The main chains of the fluorene-based polymers consist of fluorene, triphenylamine, benzothiadiazole, and thiophene molecules. The former three molecules are classified as aryl groups. In this sense, we can control the number ratio r (=  where nthio and naryl are the number of the thiophenes and aryl groups, respectively) of thiophene in the main chain from r = 0.0 in TFB and PFB, r = 0.4 in F8TBT, r = 0.5 in F8T2, to r = 1.0 in P3HT.
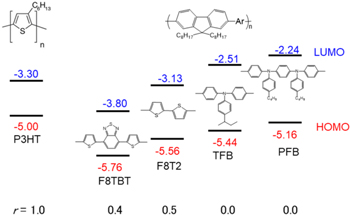
Fig. 1. (Color online) Structure of P3HT, F8TBT, F8T2, TFB, and PFB. In the fluorene-based polymers, the structure of each Ar group is shown below. r is the number ratio of thiophene in the main chain. HOMO and LUMO levels were optically determined.
Download figure:
Standard image High-resolution imageIn this work, we systematically investigated α of P3HT, F8TBT, F8T2, PFB, and TFB with controlling r. We found that α steeply increases with r from 0.19 mV K−1 (TFB) at r = 0.0 to 1.08 mV K−1 (P3HT) at r = 1.0. This observation suggests that α in thiophene is higher than that in benzene. This trend is well explained by variation of the vibrational entropy Svib between the neutral and oxidized states of the molecules.
2. Experimental methods
2.1. Sample preparation and characterization
To prepare polymer films, polymer solutions were casted on glass substrates coated with indium tin oxide electrodes. 2.0 mg of polymer was dissolved in 0.4 ml of chloroform. We purchased P3HT from Wako Pure Chemical Industries (weight averaged molecular weight Mw = 70 000–100 000), TFB from Lumtec (Mw = 44 000), PFB (Mw = 10 000) and F8T2 (Mw = 45 000) from American Dye source, and F8TBT from Aldrich (Mw = 10 000–50 000). These polymers were used as received. The thickness and weight of the films were typically 6 μm and 0.3 mg, respectively. The latter was evaluated from the weight of the solution casted on the substrate. The areas of the electrodes are about 0.2 cm2. Photoelectron yield measures were carried out to estimate EHUMO with an AC-3 spectrometer (Riken Keiki). ELUMO were evaluated using the equation ELUMO = EHOMO + Eg, where Eg is the optical band-gap.
2.2. Electrochemical properties
The electrochemical measurements were performed using a beaker-type cell with a potentiostat (HokutoDENKO HJ1001SD8) within an Ar-filled glove box. The cathode, anode and electrolyte were the cast film, Li metal, ethylene carbonate (EC)/diethyl carbonate (DEC) containing 1 mol l−1 LiClO4, respectively. The charge and discharge rate were 0.1–0.3 C. The upper and lower cut-off voltages were set to be 4.0 V and 1.0 V versus Li/Li+, respectively.
2.3. Determination of α
The temperature coefficient (α) of the cathode material can be expressed as αcell − α0, where αcell and α0 are the coefficient of the cell and anode material, respectively. We determined αcell of the beaker-type cell fabricated with the electrodes and electrolyte materials mentioned above. The temperature coefficient (αLi) of Li in the electrolyte (EC/DEC containing 1 mol l−1 LiClO4) is 0.76 mV K−1.9) Therefore, α is obtained using the equation α = αcell + 0.76 mV K−1. To avoid the potential fluctuation that is prominently seen in the neutral (as-grown) state, the polymers are partially oxidized (arrows in Fig. 2) in the beaker-type cell. Vcell was carefully measured as a function of the cell temperature (T), which was monitored with a Pt resistance thermometer in the electrolyte. Increase or decrease of T was slowly controlled at a rate of 0.3 K min−1. In the low-V plateau, the redox potential was too unstable to determine reliable α.

Fig. 2. (Color online) Charge and discharge curves of the cast films against the charge (Q): (a) P3HT, (b) F8TBT, (c) F8T2, (d) TFB, and (e) PFB. The first and second charge processes are represented by thick and thin black curves, respectively. Red curves represent the discharge curves. The charge and discharge rate were 0.1 C (P3HT), 0.2 C (PFB, F8T2 and F8TBT) or 0.3 C (TFB). Arrows indicate the positions where α was determined. r is the number ratio of thiophene in the main chain.
Download figure:
Standard image High-resolution image3. Results
3.1. Electrochemical properties
Figure 2 shows charge and discharge curves of the cast films: (a) P3HT, (b) F8TBT, (c) F8T2, (d) TFB, and (e) PFB. The first and second charge process are represented by thick and thin black curves, respectively. In the P3HT film [(a)], the discharge curve shows two plateaus at 3.7 V (high-V) and 1.5 V (low-V). The overall feature of the discharge curve is consistent with the literature.21) The high-V plateau is assigned to process of the removal of an electron from the HOMO level and subsequent anion (ClO ) insertion,21) because it is discernible in the first charge process from the neutral state. On the other hand, the low-V plateau is assigned to process of the addition of an electron to the LUMO level and subsequent cation (Li+) extraction. Similar two plateau features are observed in the F8TBT [(b)], F8T2 [(c)], and TFB [(d)] cast films. Therefore, the high-V plateau is assigned to process of the removal of an electron from the HOMO level while the low-V plateau is assigned to process of the addition of an electron to the LUMO level.
In the PFB film [(e)], the discharge curve shows three plateaus at 3.8, 3.5 and 1.48 V. The two high-V plateaus (3.8 V and 3.5 V) are observed in the first charge process, indicating that the plateaus are assigned to process of the first (3.5 V) and second (3.8 V) removal of electrons from the HOMO level, respectively. In other words, two-electron oxidation reaction takes place in PFB. The low-V plateau (1.48 V) is assigned to process of the addition of an electron to the LUMO level. We evaluated the capacities, Qhigh and Qlow in the high-V and low-V plateaus, respectively, by the peak positions of the dV/dQ curve. Qhigh and Qlow are listed in Table I together with the ideal value (Qideal). Qideal (= F/3.6M; F and M are the Faraday constant and molecular weight of monomer) is evaluated assuming that one electron can be accommodated/removed per a monomer unit. The observed Qhigh and Qlow are comparable to Qideal.
Table I. Observed (Qhigh and Qlow) and ideal (Qideal) capacities of conjugated polymers. Qhigh and Qlow are the capacities in the high-V and low-V plateaus, respectively. The high-V plateau of the PFB cast film shows two step feature. r is the number ratio of thiophene in the main chain.
| Polymer | Qideal (mAh g−1) | Qhigh (mAh g−1) | Qlow (mAh g−1) | r |
|---|---|---|---|---|
| P3HT | 162.45 | 90 | 110 | 1.0 |
| F8TBT | 39.08 | 20 | 38 | 0.4 |
| F8T2 | 48.56 | 28 | 27 | 0.5 |
| TFB | 30.02 | 36 | 16 | 0.0 |
| PFB | 29.46 | 42/38 | 50 | 0.0 |
One may consider that there exists a correlation between r and Qhigh since Qhigh (= 90 mAh g−1) for P3HT (r = 1.0) is much higher than those for the other polymers (r ≤ 0.5). We, however, observed no strong correlation between r and Qhigh. Qhigh (= 42/38 mAh g−1) for PFB (r = 0.0) is higher than those for F8TBT (r = 0.5) and F8T2 (r = 0.4). Similarly, there exists no strong correlation between r and Qlow. This is because the capacities are inversely proportional to M if one electron can be accommodated/removed per monomer unit.
3.2. Determination of α
Figure 3 shows Vcell of the Li/polymer cell against T: (a) P3HT, (b) F8TBT, (c) F8T2, (d) TFB, and (e) PFB. Red and blue marks represent that the data observed in the heating and cooling runs, respectively. No thermal hysteresis was observed in Vcell, which indicates that temperature gradient as well as sample deterioration are excluded in our experiment. αcell of the Li/polymer cell was evaluated by least-squares fittings (see straight lines in Fig. 3). In P3HT [(a)], whose main chain contains only thiophene, αcell (= 0.32 mV K−1) is positive. In fluorene-based polymers [(b)–(e)], in which part of or all thiophenes are substituted by aryl groups, αcell is negative.
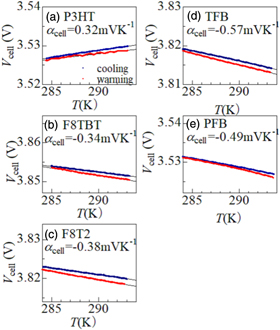
Fig. 3. (Color online) Cell voltage (Vcell) of the Li/polymer cell as a function of the cell temperature (T): (a) P3HT, (b) F8TBT, (c) F8T2, (d) TFB, and (e) PFB. Blue and red marks represent the data observed in the cooling and warming runs, respectively. Straight lines are results of the least-squares fitting. In (b) F8TBT, a gradual decrease in Vcell was observed and was corrected with a function proportional to time (t) as Vcell + ct, where c is a constant.
Download figure:
Standard image High-resolution imageFigure 4 shows interrelation between α (= αcell + 0.76 mV K−1) of polymer and r. We found that α steeply increases with r from 0.19 mV K−1 (TFB) and 0.27 mV K−1 (PFB) at r = 0.0, 0.42 mV K−1 (F8TBT) at r = 0.4, 0.38 mV K−1 (F8T2) at r = 0.6 to 1.08 mV K−1 (P3HT) at r = 1.0. This strong correlation between α and r suggests that α in polythiophene is much higher than those in aryl groups. The correlation further implies that α strongly depends on the molecules in the main chain, and hence, can be controlled by the design of the main chain.
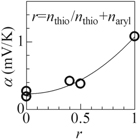
Fig. 4. Interrelation between α and the number ratio (r) of the thiophene in the main chain. nthio and naryl are number of the thiophens and aryl groups. The solid curve is merely a guide to the eyes.
Download figure:
Standard image High-resolution image4. Discussion
Now, let us consider the reason why α in polythiphens is higher than those in aryl groups. Here, recall that ΔS consists of the solid (ΔSsolid) and electrolyte (ΔSelectrolyte) components. In the present case, ΔSelectrolyte is originated from the desolvation and intercalation of ClO , and hence, is difficult to evaluate. Fortunately, ΔSelectrolyte can be regarded as a constant, because the solvent (EC/DEC containing 1 mol l−1 LiClO4) and ion (ClO
 ) are the same for the five Li/polymer cells. Therefore, we concentrate our attention to the difference in ΔSsolid between polythiophene and aryl groups.
Now, let us consider the contribution of the vibrational entropy (Svib) to α, which is expressed as  , where
  and
and  are the vibrational entropies in the neutral and oxidized states of the molecules, respectively. In the oxidization process, an electron is removed from the HOMO level with bonding character. The removal weakens the force constant between the neighboring atoms and lowers the frequencies of the vibrational modes.31–34) Such red-shifts of the modes increase
  , because Svib is express as
 ![${k}_{{\rm{B}}}{{\rm{\Sigma }}}_{i=1}^{3N-6}[\tfrac{{x}_{i}{e}^{-{x}_{i}}}{1-{e}^{-{x}_{i}}}-\mathrm{ln}(1-{e}^{-{x}_{i}})]$](https://content.cld.iop.org/journals/1347-4065/58/9/097004/revision2/jjapab3b67ieqn10.gif) , where N is the number of atoms in the molecule. xi (=
, where N is the number of atoms in the molecule. xi (=  , where
  and kB are the vibrational energy of the ith mode and the Boltzmann constant, respectively) is the vibrational energy in the unit of the thermal energy.
As shown in Fig. 4, α correlates with r in spite of different kinds of the aryl groups (fluorene, triphenylamine, and benzothiadiazole). Thus, we considered the phenyl ring (R-C6H5) as the simplest representative of such aryl groups. The oxidization process removes an electron from the π-bond region, and hence, has negligible effect on the vibrational energies (xi) in the side groups. In this sense, substitution of hydrogens for the side groups of thiophene and phenyl ring has no serious effect on evaluation of α (=  ). Thus, α of polythiophene and aryl groups can be approximated to α of thiophene (C4H4S) and benzene (C6H6) molecules, respectively.
To make a quantitative discussion, we performed a density functional theory (DFT) calculation of C4H4S, C4H4S+, C6H6 and C6H . The calculations were performed at the B3LYP/6-311G(d, p) level.35) After the structural optimization, frequencies of the vibrational modes were evaluated in the C2v (C4H4S, C4H4S+),
  (C6H6) and
  (C6H
(C6H ) symmetries. The symmetry change observed in C6H6 is ascribed to the Jahn-Teller deformation into a quinoid structure. Figure 5(a) shows the frequencies of the vibrational modes in C4H4S (open circles) and C4H4S+ (closed circles). The removal of an electron slightly reduces the frequencies. Figure 5(b) shows the frequencies of the vibrational modes in C6H6 (open circles) and C6H
 (closed circles). For convenience of explanation, irreducible representations in the
  symmetry is used for C6H6. The removal of an electron significantly reduces the frequencies, especially, in the lowest-lying
  and
and  modes.

Fig. 5. (Color online) Frequencies of the vibrational modes in the neutral (open circles) and oxidized (closed circles) states: (a) C4H4S and (b) C6H6. For convenience of explanation, irreducible representations in the D2h symmetry is used for C6H6.
Download figure:
Standard image High-resolution image
In Table II, we listed  and
and  of C4H4S and C6H6, together with their contribution to α. The contribution is larger in C4H4S (−0.038 mV K−1) than in C6H6 (−0.129 mV K−1). Thus, the DFT calculation qualitatively explains why α in polythiophene is higher than those in aryl groups. Here, recall that ΔS consists of ΔSsolid and ΔSelectrolyte. ΔSelectrolyte, which can be regarded as a constant, is unknown. Therefore, it is impossible to compare the absolute values (or signs) of the calculated α and those of the experimentally obtained α.
Table II.
Vibrational entropies in the neutral ( ) and oxidized (
 ) states of C4H4S and C6H6 at 298.15 K. α is expressed as
  .
.
| Molecule |
 (meV K−1) (meV K−1) |
 (meV K−1) (meV K−1) |
α (mV K−1) |
|---|---|---|---|
| C4H4S | 0.150 | 0.188 | −0.038 |
| C6H6 | 0.191 | 0.320 | −0.129 |
5. Conclusions
In conclusion, we investigated α of P3HT, F8TBT, F8T2, PFB, and TFB with controlling the number ratio (r) of the thiophene in the main chain. We found a strong correlation between α and r, and interpreted it in terms of variation of Svib. Our analysis strongly suggests that Svib is a useful indicator for evaluating the magnitude of α in conjugated polymers.
Acknowledgments
This work was supported by JSPS KAKENHI (Grant Number JP17H01137). This work was supported by a joint research with Focus Systems Corporation.