


Abstract
The Saturnian moon Enceladus presents a unique opportunity to sample the contents of a subsurface liquid water ocean in situ via the continuous plume formed over its south polar terrain using a multi-flyby mission architecture. Previous analyses of the plume's composition by Cassini revealed an energy-rich system laden with salts and organic compounds, representing an environment containing most of the ingredients for life as we know it. Following in the footsteps of the Cassini-Huygens mission, we present Astrobiology eXploration at Enceladus (AXE), a New Frontiers class Enceladus mission concept study carried out during the 2021 NASA Planetary Science Summer School program at the Jet Propulsion Laboratory, California Institute of Technology. We demonstrate that a scientifically compelling geophysical and life-detection mission to Enceladus can be carried out within the constraints of a New Frontiers-5 cost cap using a modest instrument suite, requiring only a narrow angle, high-resolution telescopic imager, a mass spectrometer, and a high-gain antenna for radio communications and gravity science measurements. Using a multi-flyby mission architecture, AXE would evaluate the habitability and potential for life at Enceladus through a synergistic combination of in situ chemical analysis measurements aimed at directly detecting the presence of molecular biosignatures, along with geophysical and geomorphological investigations to contextualize chemical biosignatures and further evaluate the habitability of Enceladus over geologic time.
Export citation and abstract BibTeX RIS

Original content from this work may be used under the terms of the Creative Commons Attribution 4.0 licence. Any further distribution of this work must maintain attribution to the author(s) and the title of the work, journal citation and DOI.
1. Background and Motivation
Enceladus, the sixth largest moon of Saturn, is one of the most unique planetary bodies in our solar system and continues to challenge our understanding of the geophysical processes governing the evolution of icy moons. Of the many incredible discoveries made by the Cassini-Huygens mission (Spilker 2019), perhaps one of the most exciting includes anomalous thermal emissions accompanying a series of narrow tectonic fractures at Enceladus' south pole from which jets of water ice are sourced, forming a continuous plume over the south polar terrain (SPT; Porco et al. 2006). The coincidence of these jets with hot spots detected using data from Cassini's Visual and Infrared Mapping Spectrometer (VIMS) strongly suggests that the heat accompanying these jets is transported from a sea of liquid water beneath the surface from which the plume is directly sourced (Porco et al. 2014). Based on measurements made by Cassini, Enceladus very likely harbors a subsurface ocean in contact with a mineral-rich rocky core, which, based on our current understanding of habitability, could represent an environment conducive to the emergence and sustenance of life (Cable et al. 2021; Ermakov et al. 2021). Our search for life outside of Earth is inherently constrained by our ability to locate habitable environments and our ability to access and characterize these environments using instruments capable of biosignature detection. Enceladus presents us with a unique opportunity to directly examine both the habitability and biological potential of an icy moon via the in situ analysis of oceanic plume material, positioning Enceladus as one of the most compelling and high-priority planetary science mission targets in our solar system (Hendrix et al. 2018; National Academies of Sciences & Medicine 2022).
Although the surface of Enceladus has been mapped globally with resolution between 50 and 500 m pixel−1 through Cassini observations (Bland et al. 2018), its interior properties (e.g., the ice/ocean configuration and heat budget) are still not well understood (Čadek et al. 2016; Hemingway et al. 2018). Our current lack of understanding of Enceladus' interior properties could prove prohibitive in drawing a biological conclusion at Enceladus, as these properties ultimately constrain the amount of energy available to generate and sustain life (Ray et al. 2021; Marusiak et al. 2021). The geophysical processes governing internal ocean and ice shell dynamics and surface morphology related to these processes must therefore be well understood to provide the geological context for any chemical measurements made in an effort to examine the habitability and potential for life at Enceladus. Despite the wealth of data generated from past missions, several key geophysical and geomorphological questions still remain unanswered. How old is the Enceladus ocean, and has it persisted over geologic time, thereby providing enough time for life to take hold? By what mechanisms are ice grains formed and subsequently expelled from the subsurface, and what implications do these mechanisms have in our interpretation of ice grain composition? What geological processes have shaped Enceladus' surface features, and how have these processes changed through space and time? Has the SPT been the sole source of geologic activity, or were there heat sources located elsewhere, pointing toward more spatially and temporally complex interior dynamics in Enceladus' past? Could other potentially habitable environments have formed in these localized high heat flux regions?
To address these questions, we present a concept study for a multi-flyby mission to Enceladus, Astrobiology eXploration at Enceladus (AXE; see Figure 1). This concept study was carried out in response to the mission selections from the New Frontiers-4 (NF-4) announcement of opportunity (AO) and is the result of the 2021 NASA Planetary Science Summer School (PSSS) program hosted by the Jet Propulsion Laboratory, California Institute of Technology. The PSSS provides an educational and authentic mission design and proposal experience in which doctoral students, postdoctoral researchers, and junior faculty learn the process of developing a hypothesis-driven planetary science mission concept in a team environment. The science objectives of the AXE mission are as follows:
- 1.Determine whether the molecular and isotopic distributions in the Enceladus plume are a result of biological activity or abiotic processes
- 2.Determine whether Enceladus is in thermal equilibrium and is therefore capable of sustaining a long-lived subsurface ocean
- 3.Determine whether plume material is delivered to the surface via open-crevasse "boiling" or explosive, point-source eruptions
- 4.Determine if the geologic activity that produced and is modifying the SPT is unique to this region or has influenced other regions and their subsequent geological processes
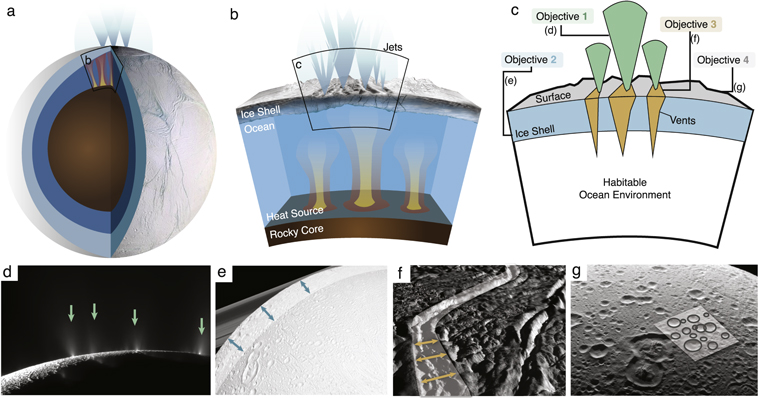
Figure 1. Schematic overview of AXE's investigation sites and associated science objectives at Enceladus. (a) Enceladus' interior depicting heat sourced from the rocky core and multiple water jets forming the plume; see (b) for more detail. (b) Key features of the Enceladus core-ocean-ice shell boundaries, including heat source, ice shell, and water ice jets. (c) Area of interest containing all four sites of investigation under AXE: ice/water jets (green), ice shell (blue), vents/fissures (yellow), and surface (gray) (shown, respectively, with CASSINI images in (d)–(g) but lacking the resolution required for AXE science objectives). Each site would address a separate science objective (1–4, see Section 1): (d) plume composition (green arrows) used to examine biological potential (objective 1); (e) ice shell thickness measurements (blue arrows) to determine energy balance (objective 2); (f) vent width variations (yellow arrows) used to determine plume sourcing mechanism; and (g) surface crater mapping (gray circles) to determine plume and ice shell history. Underlying images in (d), (e), (f), and (g) were retrieved from NASA/JPL-Caltech.
Download figure:
Standard image High-resolution imageThe mission's Science Traceability Matrix is shown below (Figure 2), which represents a logical flow (from left to right) of the mission's design process; this also paralleled the flow of focus throughout the PSSS program, which initially concentrated on establishing science objectives but later focused more on mission implementation. We began by identifying key outstanding science questions, which were developed into mission science objectives, then quantitatively established the measurements that would be required to address our science objectives. Following this, we selected instruments with sufficient performance to achieve the associated measurements, then finally established mission sampling requirements that would enable these measurements.
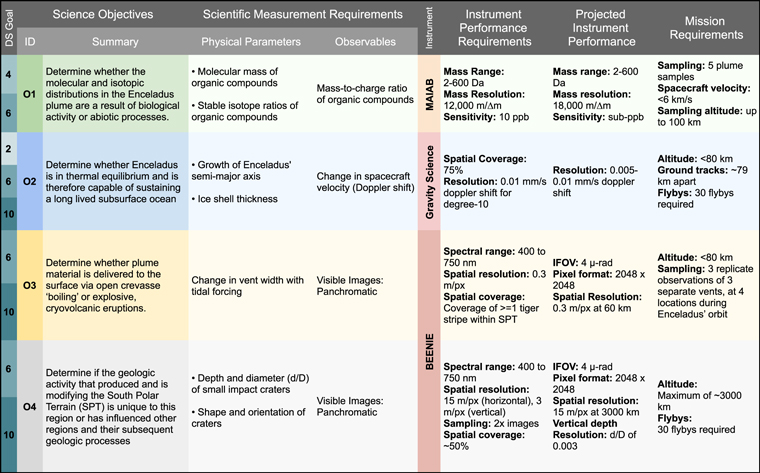
Figure 2. An abbreviated version of the AXE science traceability matrix. From left to right: science objectives drive scientific measurement requirements, which then drive instrument performance requirements and mission requirements necessary to achieve science closure for each science objective. Each AXE science objective addresses multiple 2013–2022 decadal survey (DS) goals (left panel). Instruments are referred to by their acronyms: BEENIE, Better Eyes on ENceladus IcE; MAIAB, Molecular And Isotopic Analysis for Biomarkers.
Download figure:
Standard image High-resolution imageThe remainder of Section 1 provides the scientific background and rationale for each science objective; the corresponding measurement requirements for these objectives are discussed in detail in Section 2. Instrument selections and data sufficiency are discussed in Sections 3 and 4, respectively, and the mission architecture is presented in Section 5. Cost and risk assessment are discussed in Section 6, our team organization and structure are presented in Section 7, and further discussions, challenges, and conclusions are provided in Sections 8 and 9.
1.1. Objective 1: Does Enceladus Host Past or Present Life?
1.1.1. Organic Molecular Distributions
Molecular biosignature detection represents a powerful and agnostic approach in our search for extraterrestrial life (National Academies of Sciences & Medicine 2019). To this end, it is essential that the organic chemical inventory at Enceladus is well characterized (Cable et al. 2021). The Cassini VIMS instrument detected an array of light organics at the SPT corresponding to geologic features on Enceladus' surface (Brown et al. 2006), indicating these species are likely sourced from plume material and presumably the subsurface ocean from which the plume is sourced. Analysis of the plume gas and grains as well as grains in Saturn's E-ring (which is generated by the plume) by the Cassini Ion and Neutral Mass Spectrometer (INMS) and Cosmic Dust Analyzer (CDA) revealed not only an abundance of small organics at Enceladus (Waite et al. 2006), but evidence for larger, more complex organics as well (Postberg et al. 2018), presenting tantalizing evidence of what could be complex chemical processing ongoing within an icy moon. Although the presence of complex, high molecular weight organics has been strongly suggested by Cassini data, the direct detection of these species has not yet been achieved. This is due to the limited mass resolution and mass ranges of the Cassini instrument payload, which detected what are understood to be molecular fragments of large parent molecules resulting from hypervelocity impact onto the instrument impact plate (for CDA) or within the antechamber (for INMS). Using more modern instrumentation, a mission to sample the plume of Enceladus once more would allow us to examine the relative distribution of both low-mass and high-mass organic compounds within the plume in much greater detail, providing insight into their source and biogenic potential.
Abiotic molecular distributions are characterized by an exponential decline in molecular abundance with increasing carbon number, while biological molecular distributions are characterized by relatively specific structures, the presence of straight chains or cyclic units, and no decline in abundance with carbon number (Sephton et al. 2018). Based on our current knowledge of Earth-based life, amino acids represent an excellent potential molecular biosignature class due to both their ubiquity across terrestrial life and their high abundance in primordial materials (e.g., meteorites and comet particles) (Davila & McKay 2014). Recent work examining the decomposition of amino acids in the conditions expected within a hydrothermally active Enceladus ocean have also shown that proteinogenic amino acids, if currently present, may not be relics of early planetary processes, as all 14 proteinogenic amino acids studied were shown to degrade to a very large extent (>99.9%) over relatively short geologic timescales in Enceladus ocean conditions (Truong et al. 2019). If detected, these amino acids and others could be a result of recent (<1 Myr) active production via geochemical or biotic pathways rather than the primordial chemical inventory or, if the ocean is not yet in chemical equilibrium with the core of Enceladus, relatively recent aqueous processing of the porous core via serpentinization.
Lipids, which typically have long, nonpolar, hydrophobic carbon chains and form the bilayers of cell membranes, are ubiquitous across terrestrial biology and follow very distinct patterns. Bacteria and eukaryotes typically utilize lipid synthesis that involves building molecular chains by adding two carbons at a time, which almost exclusively results in the presence of even-chain carboxylic (fatty) acids in biological systems on Earth (Georgiou & Deamer 2014). Similarly, in archaea, lipid chains are usually synthesized by adding five carbons at a time (via isoprene). In abiotic systems, the distribution of organics is governed by kinetics and thermodynamics, resulting in a Poisson distribution of organics by mass, while organic molecular distributions in biotic systems are governed by biological utility and function (Figure 3). A stark contrast in carbon chain length distributions is observable in biological systems relative to that of abiotic systems, where carbon chains are extended by one mass unit and adopt a Poisson distribution by carbon number (Dotson 2020). Thus, observing a pattern of repeating subunits in organic molecules at Enceladus would provide a possible indication that these species could be biologically sourced.
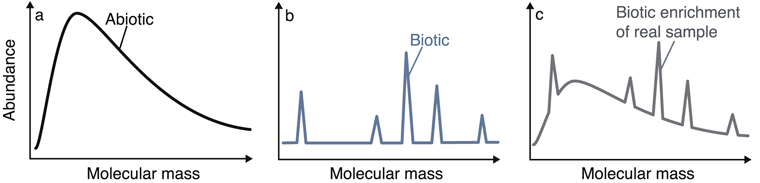
Figure 3. Expected molecular abundances as a function of molecular mass for (a) abiotic systems, (b) biotic systems, and (c) the selective enrichment or depletion of molecules expected in biological samples.
Download figure:
Standard image High-resolution image1.1.2. Isotope Abundances
Lighter isotopes differ slightly in bond strength and react at slightly faster rates than their heavier isotopic counterparts and, as a result, chemical products of biological systems tend to become enriched in lighter isotopes over long periods of time (Northrop 1981). Biologically derived organic compounds typically contain lower abundances of heavier stable isotope elements than those with an abiotic origin, which can allow for the differentiation between abiotic and biological material by examining the relative isotope abundances within a sample (Engel et al. 1990). Given the physicochemical conditions expected at Enceladus and the abundance of H2, CO2, and CH4 detected in the plume by Cassini (Waite et al. 2006), methanogenic archaea are among the organisms suited to potentially thrive in the hydrothermal environments likely present and have been shown to produce CH4 under these conditions on Earth (Taubner et al. 2018; Hoehler 2022). Stable isotope ratios observed for H2, CO2, CH4, and other low-molecular weight hydrocarbons therefore provide a means to evaluate the possibility of biological methanogenesis or other forms of biological chemical processing ongoing within Enceladus. With this in mind, analysis of the plume's chemical composition with the appropriate mass resolution (see Section 2.1.2) would determine if the stable isotope ratios of organics detected in the plume indicate a degree of fractionation consistent with biological processing.
1.2. Objective 2: Is the Enceladus Ocean Persistent or Transient?
Thermal observations of heat flow by Cassini indicate that 4.2 GW of power is being radiated from the SPT at Enceladus (Spencer et al. 2013). Assuming a conductive ice shell, between 20 and 40 GW of power could be lost through Enceladus' ice shell (Hemingway & Mittal 2019); however, less than 0.3 GW could be generated radiogenically within the core, and only 1.1 GW is expected to be tidally generated within Enceladus' ice shell for traditional values of Saturn's tidal quality factor Q (a value inversely proportional to the tidal energy dissipation rate within Saturn; Meyer & Wisdom 2007). Moreover, Enceladus' subsurface ocean is not expected to be a significant source of heating (Chen & Nimmo 2011). The discrepancies in the expected power available to Enceladus (as few as 1.1 GW) and the power potentially emitted by Enceladus (at least 4.2 GW and potentially up to 40 GW) suggests Enceladus may not be in thermal equilibrium. If not in equilibrium, the ice shell could be rapidly melting/freezing as Enceladus experiences episodic heating (O'Neill & Nimmo2010); however, this requires a thick-enough ice shell for convection to occur. If Enceladus is instead in thermal equilibrium, the ocean is very likely a permanent feature.
More recent work has shown that Saturn's Q may be low enough to provide the power necessary for tidal heating at Enceladus (Lainey et al. 2012; Lainey 2016; Hemingway & Mittal 2019; Lainey et al. 2020). Analysis of gravity and topography data suggests that the ice shell is close to a dynamic steady state maintained through ice flow induced by melting/freezing occurring at the base of the ice shell (Čadek et al. 2019). While episodic/periodic heating may be unlikely, the power budget of Enceladus is currently not well characterized, so whether or not Enceladus is in thermal equilibrium is therefore an open question. Answering this question would ultimately determine whether Enceladus' ocean is a long-lived or transient feature, which has profound implications in the overall habitability of Enceladus. A geologically ancient ocean may no longer be able to generate the energy required to support life, as hydrothermal activity at the surface of Enceladus' core is driven by serpentinization of minerals like olivine, which are finite (see Vance et al. 2007; Zandanel et al. 2021). Conversely, a very young ocean may not allow enough time for life to develop. Whether or not small, icy bodies are capable of maintaining subsurface oceans is a question with relevance to the icy satellites of Jupiter, Uranus, Neptune, and Pluto (and beyond). As such, addressing this question would also further inform missions planned for the near future to study these systems.
1.3. Objective 3: How Is Plume Material Delivered to the Surface?
While Cassini characterized the eruption rates and durations of the observed jets that form the plume, the structure of the conduits that connect the ocean to the surface through the ice shell remains a critical unknown. Determining the conduit structure(s) that govern eruption dynamics will enable a better understanding of the lifetime of the plume, as well as how material exchange between the ocean and the surface occurs. Cassini observed the presence of distinct jets of gas and dust (Porco et al. 2014; Teolis et al. 2017) as well as some localization of thermal hot spots at the SPT (Goguen et al. 2013). Together, these suggest that some number of focused, point-source eruptions must supply a large portion of the plume. However, curtain-like eruptions have been observed elsewhere along the tectonic fractures (Spitale et al. 2015), leading to further questions about which eruption dynamics and associated ice shell plumbing mechanisms may dominate the system. Enceladus flybys revealed a gravity anomaly at the south pole consistent with a thinner-than-average ice shell underlain by a subsurface ocean (e.g., Collins & Goodman 2007; McKinnon 2013; Iess et al. 2014; Čadek et al. 2016; Beuthe et al. 2016; Čadek et al. 2019), but this coarse information about the bulk interior structure is insufficient for vent-specific internal characterization. Higher-resolution image data is also limited, prohibiting the correlation of local vent morphology at the surface with eruption dynamics at the regional scale or at depth (Helfenstein & Porco 2015).
Two endmember models of eruption dynamics, and the ice shell plumbing structures that support them, currently persist: (1) an open-crevasse model, in which a wider (1+ m) vent is kept open by tidal pumping, where turbulent dissipation drives near-surface boiling (Kite & Rubin 2016); and (2) a cryovolcanic, point-source eruptive model in which ocean material, driven upwards by volatile exsolution, is accelerated outwards through a narrow (∼0.1 m) near-surface nozzle (Schmidt et al. 2008). The open-crevasse model is more consistent with large, fissure-like eruptions, while the point-source model is more consistent with eruption from a series of point sources. The current lack of high-resolution data regarding vent geometry and dynamics limits the scientific community's ability to reconcile either of these proposed mechanisms, and their relative contributions to the formation and structure of the plume, with the fractures themselves. If the Enceladus ocean is directly exposed to the surface over ∼Myr timescales, which would allow material exchange to occur between the ocean and surface as expected for an open-crevasse model (Kite & Rubin 2016), this would significantly increase the habitability of Enceladus (Parkinson et al. 2008; Soderlund et al. 2020). However, the mechanisms governing material exchange and the extent to which they occur at Enceladus are poorly understood (Hendrix et al. 2018). Determining the geophysical processes that underlie the plumbing system beneath the plumes and produce the eruptions observed is thus fundamental to understanding the moon's history and continued evolution as an active geologic world, shedding light on the potential longevity of an ocean–surface connection and its persistence over geologic timescales.
The morphology of the plume conduit system will also in part dictate to what degree the ice grain formation process could drive the plume composition to differ in comparison to the bulk ocean composition, and to what degree the plume material resulting from these processes is representative of the ocean itself. In an open-crevasse model, boiling and recondensation could produce ice grains of varying compositions through a combination of processes including gas-phase homogeneous nucleation of water vapor (Postberg et al. 2009), heterogeneous nucleation of organic aerosols at the surface of the oceanic water table (Porco et al. 2017; Postberg et al. 2018; Knopf et al. 2018), and the frozen spray of salt water formed from salt-ice condensation cores (Postberg et al. 2011). In contrast, frozen droplets ejected via geyser-like, point-source eruptions travel directly from the ocean to the surface and would therefore be representative of the bulk Enceladus ocean. The plumbing architecture would also dictate residence time of plume material within the ice shell. An open-crevasse structure would drive ocean material to infill a large portion of the lower vent, facilitating interactions between ocean materials and surrounding vent walls. In a more geyser-like, point-source model, material would move very quickly through the vent plumbing system, beginning from near the base of the ice shell at the ice shell–ocean interface. Thus, developing a better understanding of vent and eruption dynamics is critical to quantifying the compositional link between plume material and the ocean as a whole.
1.4. Objective 4: Are Heat Sources Static or Dynamic across Space and Time?
Impact craters are ubiquitous features on planetary surfaces. They generally exhibit circular plan view geometries with bowl-like volumes, and result from impact events on target materials (Melosh 1989). Despite their morphological diversity exhibited across the solar system, craters display an apparent simplicity across scales that allows their form to be linked to ancient and modern driving forces. In particular, their shapes, sizes, and distributions provide unique insights into a suite of key evolutionary characteristics: terrain age (Hartmann & Neukum 2001; Wyatt et al. 2004), crustal composition and structure (Bland et al. 2016; Solomonidou et al. 2020), bombardment histories (Lissauer et al. 1988; Fassett & Minton 2013), climatic and hydrological activity (Mangold et al. 2012; Stucky de Quay et al. 2020), internal heat flow and volcanism (Grimm & Solomon 1988; Schaber et al. 1992), thermal stress and tectonism (Beddingfield et al. 2016; Tesson et al. 2020), atmospheric pressure (Kite et al. 2014; Warren et al. 2019), and orbital parameters (Holo et al. 2018; Cho et al. 2021). Because crater geomorphic analysis can be performed using repeat surface images, this analysis offers a powerful yet simple approach for exploring the controlling processes that have shaped the surface of Enceladus through time.
The SPT hosts abundant evidence of modern geological activity surrounding Enceladus' prominent plume system (Spitale & Porco 2007) and tectonic fractures (Porco et al. 2006). However, extensive surface deformation and fissuring is also observed in the Leading and Trailing Hemisphere Terrains (LHT and THT, respectively), suggesting heat fluxes and plume activity were also high in the past across regions that are now tectonically quiescent (Bland et al. 2007; Giese et al. 2008). Under such high heat fluxes, large (kilometer-scale) craters deform in predictable ways due to viscous relaxation of the surface (Parmentier & Head 1981). Crater morphologies have therefore provided quantitative insights into past heat fluxes at the regional scale at Enceladus (Bland et al. 2012; Crow-Willard & Pappalardo 2015). This rich record of modified large craters provided by Cassini ISS images showcases the possibility of inferring the history of post-impact processes that have shaped the satellite's surface. However, large craters detected by Cassini comprise a small population and are limited to older terrains (Bland et al. 2012). Additionally, minimum heat flux estimates rely on assumptions for ice shell rheology and temperature, and cannot be used to reconstruct exact plume locations, relative changes in ice shell orientation, or how these may vary in space and time. For smaller crater diameters (<1 km), relaxation is no longer a significant process (e.g., relaxation timescales become very large: >1 Gya; Kirchoff & Schenk 2009), and thus other factors not correlated to heat flow will instead contribute to their initial shape and subsequent modification.
We propose that two primary drivers are being recorded in crater morphology on Enceladus. First, the fallout deposits ejected by the present-day plume have resulted in significant surface smoothing near the SPT through the burial of craters (Kirchoff & Schenk 2009). Because crater depressions are not visible near the SPT, this suggests that fallout deposits are the primary driver for crater depth modification and erasure (Spitale & Porco 2007). Measuring crater depths across the surface would allow us to thus constrain where previous jets may have resulted in crater infilling across Enceladus in its past, when the plume may have been located outside the SPT. Another aspect of crater morphology that may be investigated is their shape in the form of ellipticity. The majority of craters on planetary surfaces are nearly circular, but impactors with small impact angles relative to the surface produce elliptical craters with major axes aligned with the velocity vector of the impactor (Bottke et al. 2000). As Enceladus orbits Saturn, impactors in the same orbit that are traveling parallel to the equator (or orbital plane) create elliptical craters that are east–west oriented. Thus, elliptical crater orientations can be used to discern past orientations of the ice shell, assuming preferential directions in the impactor population exist, as it is believed to on other Saturnian satellites (Zahnle et al. 2003; Kirchoff & Schenk 2010; Ferguson et al. 2020, 2022).
Although the large, viscously relaxed craters from Cassini provided novel constraints on the heat flux in Enceladus, the subkilometer crater population remains an untapped scientific resource. These two complementary approaches in crater morphology analysis would provide critical insights into the location of past plumes as well as the reorientations of the ice shell. Ultimately, understanding how plume sources may have changed over time and space will allow us to better constrain the stability and duration of higher heat fluxes, which may influence long-term habitability, implying other sites beyond the SPT could have hosted high-energy habitats. Identifying ice shell reorientation and their scales would also inform the relative locations and interactions between heat sources, ice thicknesses, and plume locations. Additionally, this would result in a better understanding of the physical and thermal history of Enceladus, including how energy, liquid water, and the icy crust have interacted as recorded in the geomorphologic and geological record.
2. Measurement Requirements
2.1. Plume Sampling Measurement Requirements
2.1.1. Molecular Biosignatures
To work toward establishing a quantitative threshold between life and nonlife, it is important to place a theoretical upper limit on the abiotic organic concentrations expected within Enceladus; here, we use terrestrial life as an analogue. Assuming an Enceladus core radius of 185 km (Čadek et al. 2016; Neumann & Kruse 2019), a porous core layer of 4–70 km (Neumann & Kruse 2019), and an average core density of 2350 kg m−3 (Iess et al. 2014; Thomas et al. 2016), between 4.0 × 10¹⁸ and 4.8 × 10¹⁹ kg of Enceladus' porous core material could undergo aqueous processing, thus transporting the organic contents of the core into the ocean through hydrothermal circulation. Using carbonaceous chondrites analyzed on Earth as an appropriate analogue to the chondritic core of Enceladus (Sekine et al. 2015), and using amino acid (Burton et al. 2014) and fatty acid (Huang et al. 2005) content in carbonaceous chondrites as representative of the range of amino acid and fatty acid content expected within the core, one could expect the range of concentrations shown in Figure 4 for the bulk Enceladus ocean, assuming an ocean volume of 26.6 million km3 (Čadek et al. 2016). The amino acids and fatty acids shown in Figure 4 represent a suite of molecules found in both biological samples and carbonaceous chondrite meteorites; these values establish an upper limit for the range of concentrations expected for key organic biosignatures present in the Enceladus ocean in a purely abiotic scenario. Notably, the concentrations of fatty acids expected here would exceed the solubility limit for these species in Enceladus ocean conditions, and would therefore likely result in the formation of a thin organic film at the surface of the water table (discussed below). Base-catalyzed hydrolysis of amino acids over long timescales would also result in molecular degradation over time (see Section 1.1.1; Truong et al. 2019), likely resulting in lower amino acid concentrations than those presented here for a purely abiotic system with a core that became saturated early in Enceladus' history. With an upper limit on amino and fatty acid content for certain species established, along with the likelihood of base-catalyzed hydrolysis occurring in Enceladus ocean conditions, detecting these species at concentrations higher than the ranges shown in Figure 4 would be a possible indicator of biological activity, assuming the sample composition is representative of the bulk Enceladus ocean composition. We omit production via geochemical synthesis in this case (Ménez et al. 2018), as abiotic production values in the Enceladus ocean environment are currently not well defined (Steel et al. 2017).
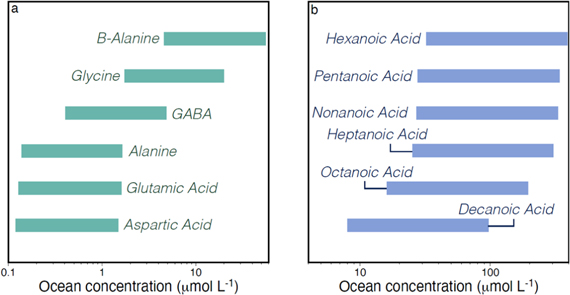
Figure 4. Range of expected (a) amino acid and (b) short-chain fatty acid concentrations in the bulk Enceladus ocean using an expected core aqueous processing depth range of 4–70 km.
Download figure:
Standard image High-resolution imageAdditional lines of evidence in support of life would include the relative abundance of amino and fatty acids observed in the sample. These compounds can be formed abiotically and have been detected in extraterrestrial samples; therefore, it is not just the presence, but the relative distribution of these species that specifies a biogenic origin (see Section 1.1). For amino acids, the abundance of other species relative to glycine could provide a possible indication of biological activity, as abiotic amino acid synthesis follows the free energy of formation and thus strongly favors the synthesis of simpler amino acids (Higgs & Pudritz 2009). The abundance of glycine is typically orders of magnitude higher than other larger molecular weight amino acids in extraterrestrial samples due to the thermodynamic and kinetic barriers present in abiotic chemical synthesis (Glavin et al. 2020). Thus, observing amino acid distributions in which other higher molecular weight amino acids are equal to or in greater abundance than glycine, such as those observed in terrestrial samples, would constitute a possible indication of biological activity. However, β-alanine has been shown to have similar abundances to glycine in carbonaceous chondrites and should thus be omitted in making this comparison (Burton et al. 2014). We also consider the ratios of nonmethane hydrocarbons to methane as a possible indicator of biological activity, as these ratios are very low (0.001) for biological sources but significantly higher for abiotic sources (0.1–0.01; Horita & Berndt 1999; McKay et al. 2008).
Although we present short-chain (C10 and below) fatty acid levels expected in the Enceladus ocean for a purely abiotic scenario (Figure 4), long-chain fatty acids (up to C40) are found in greater abundance in Earth-based life due to their cellular function and biological utility (Bajerski et al. 2017). Following an abiotic synthetic distribution, long-chain fatty acids are generally expected to be present in significantly lower abundance than their shorter counterparts in an abiotic environment. This trend is also observed in meteoritic fatty acid contents (Lai et al. 2019), which allows the short-chain fatty acid concentrations expected in the Enceladus ocean to serve as an upper limit for abiotic longer-chain fatty acid content. However, it is necessary to acknowledge that, due to the increasingly low solubility of fatty acids in water with increasing chain length (Ralston & Hoerr 1942), if present at the range of concentrations expected in an abiotic scenario (Figure 4), these species (and other large, insoluble organics) likely exist in a separate thin-film at the surface of the Enceladean water table (Porco et al. 2017) similar to the thin organic layer at the surface of Earth's oceans (Knopf et al. 2018), while the bulk ocean concentration of fatty acids is likely at their solubility limit. Analyses of Cassini data have shown that ice grains fall into three general populations (see Section 1.3) with distinct compositional differences: (1) salt-poor grains composed of almost entirely water, likely formed by homogeneous nucleation of water vapor; (2) organic-rich, salt-poor grains with unusually high organic content, likely formed by heterogeneous nucleation; and (3) salt-rich grains likely formed by the frozen spray of salty ocean water. The organic-rich grain type is expected to form via the bursting of the thin organic layer at the ocean's surface, forming organic aerosol droplets that can serve as nucleation cores for the formation of ice grains with significantly higher organic content than the bulk ocean (Postberg et al. 2018). This would enable the organic content of the ocean to be probed at significantly higher concentrations than would be possible analyzing the bulk ocean composition alone; however, this ice grain population would likely contain much higher organic concentrations than would be expected for the bulk ocean in a purely abiotic scenario. This results in some ambiguity in establishing a quantitative basis for evaluating life versus nonlife as a potential source for larger, water-insoluble organic molecules present in the plume. Thus, the organic composition of individual ice grains should be evaluated in the context of the likely mechanism by which they were formed in an effort to evaluate the bulk composition of the Enceladus ocean and the source of any putative organic material, as these processes could significantly affect the concentrations of organics detected in the various ice grain populations within the plume.
Larger molecular weight organics present at masses beyond the resolving capability of Cassini's mass spectrometers, such as the unresolved mass peaks from 250–2100 Da observed in the extended CDA mass spectrum (Postberg et al. 2018), could display patterning in repeating carbon chain units indicative of biological chemical processing and therefore should be well characterized. However, the vast majority of biologically relevant amino acids and fatty acids observed on Earth fall within the range of 2–600 Da; therefore, this mass range should be focused on specifically in assessing molecular biogenicity. This mass range would allow for the characterization of key organic compounds necessary in assessing biological potential for life as we know it (and as we do not), including the highest molecular weight amino acids and fatty acids (up to C40) utilized in terrestrial biology, as well as organic volatiles necessary in assessing isotope fractionation (see Section 2.1.2).
2.1.2. Isotopic Biosignatures
Stable isotope ratios measured at Enceladus for organic volatiles provide an additional means of distinguishing biological activity from abiotic chemical processing; however, this requires that we work toward establishing a quantitative threshold for stable isotope ratios in both a biotic and an abiotic scenario. Isotopic fractionation is commonly expressed in terms of δ values; for a compound A whose isotopic composition has been measured in the laboratory:

where RA is the respective isotope ratio measurement for an element in the compound being studied, and RSt is the defined isotope ratio of that element in a standard sample (Hoefs 2009). Unless otherwise noted, all δ values for H and C are given with respect to the Vienna Standard Mean Ocean Water and Vienna Pee Dee Belemnite standards, respectively. Here, we consider stable isotope ratios observed in H2, CO2, and CH4 in evaluating the biological potential at Enceladus due to previous detections of H2, CO2, and CH4 in the plume, and considering that a large portion of the carbon in CH4 found in Earth's atmosphere is emitted from biological methanogenesis (Tian et al. 2016).
On Earth, methane and other organic compounds in natural systems are sourced primarily through their isotopic compositions; however, the magnitude and direction of isotopic fractionation through abiotic synthetic pathways are currently not well constrained (McCollom & Seewald 2007). This, combined with uncertainties on the geological and hydrogeological boundary conditions influencing molecular stable isotope ratios at Enceladus, makes establishing a firm quantitative threshold between life and nonlife challenging using this approach (Taubner et al. 2018). Hydrogen stable isotope ratios could provide information regarding the provenance of any hydrocarbons detected, but hydrogen in extraterrestrial abiotic organic matter has shown δ2H-variation ranging from −500 to over +6000‰ (Hoefs 2009), and laboratory experiments examining isotopic fractionation in hydrothermal conditions have shown δ2H-variation as low as −590‰ (McCollom et al. 2010), which strongly overlap with δ2H values typically associated with biological systems. Although this could ambiguate data interpretation, previous work has shown that, through Fischer-Tropsch type reactions typically associated with abiotic organic synthesis in hydrothermal environments (Fu et al. 2007; Taran et al. 2010; McCollom et al. 2010; Etiope & Sherwood Lollar 2013), CH4 is depleted in δ2H by −35 to −80‰ relative to initial H2, thus comparison of δ2H values in H2 with those of CH4 could provide clues regarding the origin of sampled material. δ13C values provide an additional constraint on the possible origin of any observed organic molecules; however, experiments studying abiotic CH4 synthesis have shown that carbon isotope signatures from abiotic sources can nearly overlap with those traditionally associated with biological processes, having δ13C values as low as −57‰ (Horita & Berndt 1999; McCollom & Seewald 2006; Taran et al. 2007; McCollom et al. 2010; Etiope & Sherwood Lollar 2013). On the contrary, CH4 production by methanogens under high hydrostatic pressures in laboratory conditions mimicking hydrothermal systems has resulted in isotope fractionation typically associated with purely abiotic processes, which further obfuscates the interpretation of measurements in these environments (Takai et al. 2008).
With the above information in mind, we define the potentially biotic threshold at any δ13C values below −60‰; however, as stated above, these measurements would require context. The interpretation of these measurements could be aided further by comparing the differences in δ13C and δ2H values (Δ13C = δreactant—δproduct) between reactants and products for abiotic synthesis involving H2, CO2, and CH4 (e.g., Δ13C = δ13CCO2—δ13CCH4 and Δ2H = δ2HH2O—δ2HCH4) and, if unexplainable by typical fractionation patterns characteristic of abiotic processing, could constitute possible evidence for biology (Etiope & Sherwood Lollar 2013). It should be noted that, although laboratory-based experiments mimicking hydrothermal systems show a wide range of δ13C values often well within the biological range, these experiments are performed under varying conditions of uncertain relevance to abiotic hydrothermal organic synthesis, so it is unclear to what degree these experiments are representative of those that may be present in the hydrothermal environments on Earth (or Enceladus; McCollom & Seewald 2007). Another possible method of evaluating molecular biogenicity would involve the abundance of multiply substituted "clumped" isotopologues (13CH3D, for example), which serves as a proxy for determining methane formation temperatures. The relative abundance of clumped isotopologues allows information to be obtained regarding the temperature at which C-H bonds were formed or last equilibrated, further constraining the origin of the sampled material. However, this application relies on the assumption that isotope-exchange equilibrium is reached, or at least approached, during molecular formation (Wang et al. 2015). In utilizing a mass spectrometer to carry out these measurements, it is necessary that the 13CH3D+ ion is effectively separated from 13CH5 + and 12CH2D2 + ions and that 12CH3D+ and 13CH4 +are also separated (Ono et al. 2014), which would require an instrument mass resolution (m/Δm) of ∼12,000 at ∼17–18 Da.
2.2. Gravity Science Measurement Requirements
Two key geophysical parameters are necessary to ascertain whether Enceladus is indeed in thermal equilibrium: the power that is dissipated from Saturn into Enceladus and the power that is conducted through Enceladus' ice shell, where the former is characterized by Saturn's tidal dissipation quality factor Q, as the power Saturn can dissipate into Enceladus is indirectly proportional to Saturn's Q. Our null hypothesis states that these two values vary by more than 10% and that Enceladus is not currently in thermal equilibrium. As the power conducted through the ice shell is expected to be 20–40 GW (Hemingway & Mittal 2019), this differential would be at least 2 GW. At this rate, the ice shell would melt (or the ocean would freeze) in about 30 Myr, which is longer than the time it would take Enceladus' orbital eccentricity to stabilize (implying its eccentricity is not a recent increase) or the time required for changes in tidal heat to propagate through the ice shell. A greater power differential would firmly suggest the ocean is a recent phenomenon, while a lower power difference would be indicative of an older ocean. Therefore, it is necessary that Enceladus' power is determined with an error of less than 10% and, because the power dissipated into Enceladus is related to Saturn's Q, it is necessary that the relative error in the measurement of Q must also be 10%. Historically, Saturn's Q was thought to be independent of frequency (meaning the value is independent of the orbital period of the satellite) and have a minimum value of 18,000 (e.g., Meyer & Wisdom 2007; Charnoz et al. 2011; Cúk et al. 2016; Fuller et al. 2016; Lainey et al. 2020; see Goldreich 1965; Goldreich & Soter 1966; Gavrilov & Zharkov 1977; Sinclair 1983; Dermott et al. 1988), but more recent studies have revealed Q can be far lower with the assumption of "resonance locking," and is likely frequency-dependent (e.g., Fuller et al. 2016; Lainey et al. 2017, 2020). Cassini's measurements of Q at Titan's orbital frequency using radiometry therefore cannot necessarily be directly applied to Saturn's Q at the orbital frequency of Enceladus.
Saturn's Q at Titan was determined to be  from a coherent orbit of Titan reconstructed from the relative positions of the Cassini spacecraft with respect to Titan and Saturn (Lainey et al. 2020). Such an orbital reconstruction is impossible for Enceladus using Cassini data due to the limited temporal coverage of radiometric data in Enceladus' vicinity. In lieu of this, Lainey et al. (2020) derived a less certain value for Saturn's Q at Enceladus of
  using astrometry, with the resulting estimate varying by at least 1 order of magnitude. As the power available to Enceladus from Saturn is inversely proportional to Saturn's Q (Meyer & Wisdom 2007), current estimates of power available to Enceladus would also vary by an order of magnitude. Saturn's Q at Enceladus' orbital frequency is inversely related to Enceladus' orbital migration rate, i.e., the increase in Enceladus' semimajor axis (Meyer & Wisdom 2007; Lainey et al. 2012; Lainey 2016; Hemingway & Mittal 2019; Lainey et al. 2020). Fortunately, AXE would arrive at Enceladus more than 24 yr after the end of the Cassini mission, allowing a two-decade time span for the orbit to evolve. Accurate ephemerides of Enceladus would be obtained upon approach and could be compared to Enceladus' predicted orbital position from Cassini ephemerides, ultimately determining its orbital evolution and thus Saturn's Q. The semimajor axis of Enceladus' orbit is only expected to be growing by 2.1 ± 1.1 cm yr−1 from astrometric measurements (Lainey et al. 2020). During the 24 yr between the end of Cassini and the beginning of AXE, this would only increase the semimajor axis by 24–74 cm. However, the increased semimajor axis with every orbit will also incrementally increase the time it takes to complete that orbit. This compounds such that Enceladus would appear to lag behind where it should be as compared to a constant orbit. Enceladus experiencing some semimajor axis growth rate of da/dt would appear to lag behind an Enceladus with constant orbital period of T0
by some distance s after time t by
using astrometry, with the resulting estimate varying by at least 1 order of magnitude. As the power available to Enceladus from Saturn is inversely proportional to Saturn's Q (Meyer & Wisdom 2007), current estimates of power available to Enceladus would also vary by an order of magnitude. Saturn's Q at Enceladus' orbital frequency is inversely related to Enceladus' orbital migration rate, i.e., the increase in Enceladus' semimajor axis (Meyer & Wisdom 2007; Lainey et al. 2012; Lainey 2016; Hemingway & Mittal 2019; Lainey et al. 2020). Fortunately, AXE would arrive at Enceladus more than 24 yr after the end of the Cassini mission, allowing a two-decade time span for the orbit to evolve. Accurate ephemerides of Enceladus would be obtained upon approach and could be compared to Enceladus' predicted orbital position from Cassini ephemerides, ultimately determining its orbital evolution and thus Saturn's Q. The semimajor axis of Enceladus' orbit is only expected to be growing by 2.1 ± 1.1 cm yr−1 from astrometric measurements (Lainey et al. 2020). During the 24 yr between the end of Cassini and the beginning of AXE, this would only increase the semimajor axis by 24–74 cm. However, the increased semimajor axis with every orbit will also incrementally increase the time it takes to complete that orbit. This compounds such that Enceladus would appear to lag behind where it should be as compared to a constant orbit. Enceladus experiencing some semimajor axis growth rate of da/dt would appear to lag behind an Enceladus with constant orbital period of T0
by some distance s after time t by

After 24 yr, Enceladus would appear to have been displaced by 7–23 km. For 10% accuracy using photography, the product of the camera pointing uncertainty and the distance to Enceladus' center-of-mass must therefore be less than 700 m.
Although heat flow measurements have been made previously at the SPT (Spencer et al. 2013), the total global heat output at Enceladus remains poorly constrained. Determining the global heat output at Enceladus could be achieved by measuring the average thickness of the ice shell, which is inversely proportional to conductive heat flow through the ice shell (Hemingway & Mittal 2019). Using data obtained from three of Cassini's Enceladus flybys, Iess et al. (2014) were able to constrain Enceladus' mass distribution using gravity data, implying an ice shell and subsurface ocean overlying a rocky core with a density of ∼2400 kg m−3 (Iess et al. 2014). Because liquid and solid ice have similar densities, models with and without an ocean were indistinguishable using these gravity data. Later measurements of Enceladus' libration heavily suggest a subsurface, global ocean (Thomas et al. 2016). New measurements of the ice shell thickness as a distinct layer from the underlying ocean will answer the power output of Enceladus—which can then be compared to its power input to assess thermal equilibrium.
Using modeling of gravity data, physical libration, and fracture penetration, previous studies estimate the thickness of Enceladus' ice shell to be as thin as 5 km in the southern region to as thick as 70 km in the northern region (Iess et al. 2014; McKinnon 2015; Thomas et al. 2016; Lucchetti et al. 2017; Čadek et al. 2019; Hemingway & Mittal 2019). To measure the conductive heat flux to within 10%, the average thickness of the ice shell must be determined within 2 km (Hemingway & Mittal 2019; Ermakov et al. 2021). This could be achieved using radio science to collect gravity data. Gravity fields are often described using spherical harmonics, where the field is decomposed into different spherical harmonic degrees l. Each spherical harmonic degree corresponds to a wavelength over which the gravity field varies; this wavelength is approximately equal to Enceladus' circumference divided by the spherical harmonic degree l. A 2 km uncertainty in average ice shell thickness could be achieved using a degree-10 gravity field (Ermakov et al. 2021), which is equivalent to measuring how ice shell thickness varies across a 158 km wavelength (the circumference of Enceladus divided by 10). To satisfy the Nyquist-Shannon sampling theorem, a spatial resolution of at least 79 km would be required (half the wavelength over which the data varies). The amplitude of gravity data of all degrees l ≤10 can be compared with the amplitude of topography data at these degrees (obtainable through imaging; Thomas 2010). Dividing the amplitude of gravity variations by the amplitude of topography provides the admittance, for which its dependence on wavelength is related to the ice shell's density and thickness (Akiba et al. 2022). While the measurement of Enceladus' tidal phase lag would provide a more direct method of assessing the tidal power produced within Enceladus, this would require measurement of gravity to degree-20 or degree-30, as opposed to the degree-10 necessary to use ice shell thickness as a proxy for produced heat (Ermakov et al. 2021).
Gravity data can be used to constrain not only the state of differentiation, but also variations in ice shell thickness as well (Ermakov et al. 2021). An orbiting spacecraft could be utilized to measure the central body's deviations from sphericity by tracking the spacecraft's deviations from an ideal circular orbit. To precisely monitor the spacecraft's orbital trajectory, spacecraft velocities can be recorded by measuring the Doppler shift in its radio transmissions (Figure 5); however, thermal noise generated by the spacecraft would slightly affect the accuracy of these measurements (Ermakov et al. 2021). Systematic estimation errors introduced by slight mis-modeling of the spacecraft center of mass are also a common problem encountered in past missions when performing gravity science. However, as demonstrated by the successful use of radio tracking data for past planetary missions for gravity field determination, there are techniques for identifying and mitigating these effects (Mazarico et al. 2014). Moreover, any plasma scintillation effects could be dealt with by adding an additional S band or Ka band, the latter of which provides an order-of-magnitude higher accuracy in Doppler shift measurements relative to the X band due to its higher frequency (32 GHz compared to 8.4 Ghz), as seen by the Juno spacecraft at Jupiter, which detected Doppler shifts as low as 0.005–0.01 mm s−1 when integrated over 60 s (e.g., Buccino et al. 2022; Durante et al. 2022). Moreover, the Europa Clipper mission is expected to have similar accuracy utilizing the Ka band (Park et al. 2011). For the gravity measurements described herein, AXE would also utilize the Ka band.

Figure 5. Schematic representation of how gravity is extrapolated from the Doppler shift of a transmitted radio tone. The AXE spacecraft would emit a radio signal, and its frequency would change depending on whether the spacecraft is accelerating or decelerating relative to Earth. If the spacecraft is traveling away from Earth, an accelerating spacecraft will decrease its radio frequency while a decelerating spacecraft will increase its radio frequency. If the spacecraft is traveling toward Earth, an accelerating spacecraft will increase its radio frequency while a decelerating spacecraft will decrease its radio frequency. Because the frequency of the original radio tone is known, the Doppler shift in this tone can be used to calculate the change in velocity resulting from changing acceleration due to gravity from Enceladus. We note that the recorded changes in acceleration would only be the component pointed toward Earth. Because our mission requires gravity data from every flyby and adequate illumination for photography ∼6000 km to or from Enceladus (see our science mission profile in Section 5.1), the line of sight to Earth is approximately parallel to the flyby path. Knowledge of the angle between Enceladus' center of mass and the flyby path with respect to the AXE spacecraft could then be used to calculate the change in gravity as a whole, which can be corrected for distance to the center of Enceladus to obtain the distribution of gravity across the surface (pictured). At large length scales (low spherical harmonic degree), topographic highs are compensated for by thickening of the ice shell. Because the average ice shell thickness is finite, a thicker ice shell results in a higher detected gravity despite isostatic compensation. Gravity and topography are most correlated at the shortest wavelengths, where gravity is entirely due to uncompensated topography. The wavelengths over which this correlation changes can be used to calculate the average ice shell thickness. Whether the shell is compensated at a given wavelength is also affected by the ice shell's rheology and thus would need to be taken into account (Akiba et al. 2022).
Download figure:
Standard image High-resolution imageAnother potentially confounding variable would be the change in spacecraft velocity (and thus Doppler shift of its radio transmission), not due to variations in gravity, but to passing through Enceladus' exosphere and (in the case of south polar flybys) plume (Iess et al. 2014). Fortunately, the collision with these minute molecules creates a drag force in the direction opposite of the spacecraft's velocity vector, rather than in the same direction as changes in gravitational acceleration toward Enceladus. This allows for separation of force components and a fit to the change in spacecraft velocity from neutral drag. Cassini, for instance, experienced a 0.25 mm s−1 change in speed during the flybys through Enceladus' plume during which gravity data was recorded (Iess et al. 2014). Incidentally, this also provides an estimate of plume density: assuming the change in the spacecraft's momentum (mass msc
multiplied by change in velocity ΔV) is due to the impulse provided by the drag force over the time Δt spent in the plume, one can calculate the plume density ρp
as  , where Asc
is the cross section of the spacecraft as it passes through the plume and usc
is its speed. Taking Cassini's dry mass as 2500 kg, the area of its 4 m high-gain antenna as an estimate for its cross section, the change in velocity of 0.25 mm s−1 experienced by Cassini over the 20 s it flew through the plume (Iess et al. 2014) implies a number density of 6 × 109 cm−3 if assuming water molecules, as compared to the 1–5 × 109 cm−3 estimated by INMS detections (note 18 of Waite et al. 2006).
, where Asc
is the cross section of the spacecraft as it passes through the plume and usc
is its speed. Taking Cassini's dry mass as 2500 kg, the area of its 4 m high-gain antenna as an estimate for its cross section, the change in velocity of 0.25 mm s−1 experienced by Cassini over the 20 s it flew through the plume (Iess et al. 2014) implies a number density of 6 × 109 cm−3 if assuming water molecules, as compared to the 1–5 × 109 cm−3 estimated by INMS detections (note 18 of Waite et al. 2006).
The final potentially confounding variable we consider is the gravity signature due to the core itself. Koh et al. (2022) found that at Europa, core topography may dominate the gravity signal over that of ice-shell thickness variations up to degree-22. Given that Europa's diameter is 10 times larger than that of Enceladus and has a greater bulk density (∼3000 kg m−3 versus ∼1600 kg m−3 for Enceladus), the ratio of core mass to ice shell mass is much larger for Europa; therefore, the core's gravity signature would be much less significant in the case of Enceladus.
The Doppler shift δV detected from a spacecraft traveling at a velocity V scales as

where G is the gravitational constant, r is the distance of the spacecraft from Enceladus' center of mass, M is the mass of Enceladus, R is the radius of Enceladus, l is the spherical harmonic degree, and Jl
is the spherical harmonic coefficient of Enceladus' gravity field in degrees l (Iess et al. 2014). To truly ascertain if AXE could accurately determine the degree-10 gravity field of Enceladus, one would need to perform a covariance analysis using data from simulated flyby trajectories (e.g., Park et al. 2011). As an order-of-magnitude estimate, we instead scale Enceladus' degree-2 gravity to degree-10 by the same factor for which the Earth's Moon's degree-2 and degree-10 gravities differ (Lemoine et al. 2013). From this, we find that for a spacecraft moving at 4 km s−1 (typical for a flyby), the spacecraft would need to pass within 81 km of Enceladus to detect a Doppler shift of 0.01 mm s−1 due to degree-10 gravity. For a multi-flyby mission, this altitude and velocity is attainable. The same equation can be used to estimate the difference in Doppler shift due to the spacecraft's expected proximity to Enceladus for a constant orbit versus a growing orbit. In this case, degree-0 (l = 0) gravity is used. Because each coefficient represents variations in gravitational potential as a fraction of the total/average potential, J0 = 1, and therefore the difference in expected Doppler shift is simply  . For a 4 km s−1 flyby at 80 km altitude, the displacement of Enceladus by a minimum of 7 km would result in a difference in Doppler shift of 114 mm s−1.
Gravitational data regarding ice shell thickness could also be complimented with an updated measurement of Enceladus' physical libration, which is the oscillation of Enceladus' surface relative to its sub-Saturn point after removing the optical libration due to a constant rotation while orbiting in an ellipse (e.g., Thomas et al. 2016). Observing this oscillation enabled Thomas et al. (2016) to unambiguously conclude that Enceladus' ice shell was decoupled from its interior. This magnitude of the libration is calculated by measuring the apparent oscillation of crater positions relative to some reference across multiple images. The magnitude of the physical libration also provides information regarding the ice shell thickness, as one can predict the value of this libration from ice shell thickness estimates (e.g., Tajeddine et al. 2014; Thomas et al. 2016). For Enceladus, Thomas et al. (2016) predicted that to satisfy an observed physical libration of 0 120 ± 0014 (528 ± 31 m; see 0155 ± 0014 in Nadezhdina et al. 2016), the ice shell must have an average thickness of 21–26 km. This represents only an 11% uncertainty in ice shell thickness stemming from a 12% uncertainty in physical libration, and thus AXE would require only a marginally improved measurement of Enceladus' physical libration than Cassini provided. The uncertainty in physical libration would then be estimated by dividing the pixel size of the poorest resolution images by the square root of the total number of measurements, where two measurements exist for each control point in an image (supplementary material of Tajeddine et al. 2014). We may estimate an uncertainty in Enceladus' physical libration from Cassini imagery of ∼40 m, as compared to Thomas et al.'s (2016) reported uncertainty of 31 m. However, estimation of ice shell thickness from physical libration requires comparing the measured value to values predicted for a given ice shell thickness. This predicted physical libration depends upon assumed densities for the ice shell, ocean, and core of Enceladus, each of which may have up to 10% uncertainty from their assumed values (Thomas et al. 2016). The predicted physical libration will then itself have an uncertainty that scales with uncertainty in these densities. Uncertainty in predicted physical libration will then limit how certain a given ice shell thickness represents measured physical libration. Because of the resolution and sheer quantity of imagery planned to fulfill other objectives, we expect the physical libration of Enceladus measured by AXE to have a smaller uncertainty than what Cassini measured by one or more orders of magnitude (see Section 4.1). Estimation of the ice shell thickness from the physical libration would then be limited most significantly by the uncertainties in the densities of the multiple layers within Enceladus, which are demonstrably attainable through gravity data.
Through 30 Enceladus flybys where flyby tracks are roughly 79 km apart, global gravity coverage of Enceladus to degree-10 is obtainable. These measurements, achieved through a refined measurement of Enceladus' libration, would constrain the average ice shell thickness (and thus the power conducted through Enceladus' ice shell) to within 10%, which can then be used to compare to the power dissipated to Enceladus by Saturn (measured from its tidal quality factor Q) to ascertain whether Enceladus is in thermal equilibrium, and thus whether its ocean is a transient or long-lived feature.
2.3. Vent Imaging Measurement Requirements
To determine the morphology of the plumbing system underlying the plume, we would utilize surface observations including the morphologic differences predicted between either scenario and how they are each likely to be expressed at and near the mouth of the vent. Each model offers some predictions for how overall predicted plumbing structure will influence vent behavior in the near-surface. In particular, the observable width of the vent in an open-crevasse scenario is expected to fluctuate with time in association with tidal flexing of the ice shell, which induces ground motion at the surface (Kite & Rubin 2016); these changes are expected to be consistent along the strike of the vent, as the overall vent width is assumed to be largely homogeneous. In a purely point-source cryovolcanic scenario, in which eruptions are localized to specific points along the vent, any potential width changes associated with variations in eruption flux in response to tidal stresses should also be localized to the immediate vicinity of the eruption. As such, high-resolution, image-based observations of vent width, taken at multiple locations along a single tectonic fracture at different points in the predicted tidal flexing cycle, would provide the data necessary to distinguish between these two eruptive mechanisms by determining the magnitude and direction of vent width changes with tidal forcing and along the strike of the fracture, which is predicted to directly reflect the properties of the underlying plumbing system.
To identify changes in vent width over time, a measurement range of 1–20 m would be required. This range is developed from the possibility that, during a tidal cycle, the vents could heavily contract or dilate to become twice as large as currently estimated in the literature (Kite & Rubin 2016). The highest-resolution measurements from Cassini imagery suggest surficial vent widths of ∼ 10 m (Goguen et al. 2013), but vent width may vary between individual fractures and between active and (possibly) inactive vent locations along the fractures as faults merge (Helfenstein & Porco 2015). A minimum resolution of 1 m would enable variations of 10% in vent opening width to be resolved for the nominal vent width of 10 m identified by Goguen et al. (2013), providing sufficient resolution to distinguish between the predicted vent width changes described above and potentially smaller, stochastic variations driven by evaporation and recondensation along vent walls (Goguen et al. 2013). Estimates of total vent width change over one orbital period for the crevasse model suggest that total vent width change is expected to be ∼1 m for a 2 m wide vent (Figure 6; Kite & Rubin 2016), which is consistent with our proposed resolution. An Interferometric Synthetic Aperture Radar instrument would also be capable of measuring the surface displacements associated with flexure near cracks in the ice shell (see Sandwell et al. 2004); however, a repeat flyby would need to pass within 5 km of the reference flyby (Sandwell et al. 2004), which, combined with the cost associated with radar instruments, would likely be prohibitive given our proposed mission architecture.
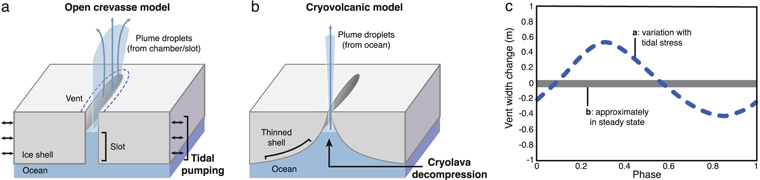
Figure 6. Enceladus plume eruption mechanisms in response to tidal forcing. In an open-crevasse scenario (a), tidal forcing throughout the orbital phase of Enceladus is expected to result in vent width variations (c) that are consistent along the strike of the vent. For a purely cryovolcanic scenario involving point-source eruptions (b), these vent width variations are expected to be localized to the immediate vicinity of the vent.
Download figure:
Standard image High-resolution imageWhile the Saturn system would be approximately halfway between southern autumnal equinox and southern winter when the spacecraft would arrive at the Saturn system, Saturn-shine (sunlight reflected by Saturn) would be sufficient for high-resolution imaging of the Enceladus vents. Using photometry of Saturn, previous work has demonstrated that the fraction of sunlight reflected, refracted, or transmitted by Saturn (its "full-disk albedo") varies between 0.5 and 0.2 depending on the angle formed by the Sun, Saturn, and the observer from 0°–90° (Dones et al. 1993; Dyudina et al. 2005). As Enceladus orbits at 4 Saturn radii, reflected sunlight is reduced by a further factor of 42. Thus, the illumination of the SPT with Saturn-shine is 1.3% that of direct sunlight at worst, which could be compensated for by increasing the exposure time of each vent image. Additional image smear induced by longer exposure times, if necessary, would be mitigated by the camera's gimbal (see Section 5). Images of the surface used for these measurements could be obtained with a single spectral band within the 200–1100 nm range, which encapsulates the full suite of potential illumination conditions expected for Enceladus. From these observations, the change in number of pixels associated with the vent interior (i.e., vent width) could be observed between successive images. However, imaging the vents at Enceladus with high resolution must account for potential environmental challenges in image collection, including photogrammetric effects (e.g., optical distortion from plume material) and variable illumination conditions, as well as subsequent analyses, as plume material could obscure or mask previously known fault scarp locations. Variable illumination conditions from oblique camera angles would be mitigated through images taken at roughly similar illumination conditions for all replicate observations (i.e., within 5° of incidence angle; Ferguson et al. 2020). Initial flybys during orbital pump-down would provide initial time for regional mapping necessary to solidify locations for high-resolution image passes.
To achieve these measurements, a minimum of three replicate observations of a single vent location during each flyby would be required at four positions throughout the orbital phase of Enceladus (apoapsis, intermediary 1, periapsis, and intermediary 2). These orbital locations were selected to ensure observation of vent width in maximally "open" and "closed" configurations as well as during periods of relative motion (both parallel and perpendicular to the vent) distinct from orbital maxima (Hurford et al. 2007). For each of the three replicate observations, coverage of multiple locations along the strike of a fracture would be achieved through imaging data, including at least one previously identified vent (Helfenstein & Porco 2015), as well as the region(s) between previously identified vents, where curtain-like rather than focused eruptions may persist (Spitale et al. 2015). Ultimately, this would require determining whether the vents have undergone consistent, significant change in width (e.g., 50%–60% of width, as proposed by Kite and Rubin) in conjunction with Enceladus' orbit, or if changes in vent width are only significant (50%–60% of total vent width) at specific, localized eruption sites. Three replicate observations of vents imaged throughout the orbital phase of Enceladus would provide sufficient spatial and temporal context, while the proposed range in image measurements would enable more subtle changes in vent structure to be resolved with respect to overall vent width. Together, these measurements would help determine the mechanisms by which the ocean below is connected to the plume above.
2.4. Global Surface Imaging Measurement Requirements
To explore the ancient geologic record of Enceladus, we would measure the morphology (diameter, depth, and aerial shape) and the spatial distribution of impact craters. This requires images and topographic data from the surface with sufficient range and resolution (both horizontal and vertical) to resolve the small (subkilometer) crater population. To quantify the horizontal measurement range, we consider that craters as small as ∼600 m in diameter have been detected on Enceladus, but although they are known to exist, subkilometer craters cannot be studied using Cassini data as they are at the resolution limit (O(100) m pixel−1; Bland et al. 2018). Preliminary studies indicate that small crater populations of diameter D ≤ 2 km are poorly resolved, spatially heterogeneous, and shallow (Kirchoff & Schenk 2009; Ferguson et al. 2020). Crater diameters as small as 100 m have been identified on Europa using Voyager and Galileo images; the apparent abundance of such small craters at high resolutions has been critical for informing parameters such as ice shell thickness in many Galilean moons (Schenk 2002). Identifying and mapping these 100 m diameter craters at improved resolution on Enceladus is a thus feasible means of determining the planetary-scale controlling processes behind their distribution and morphology. For the vertical (topographic depth) measurement range, we first consider that fresh craters at the 100 m scale have depth/diameter ratios of ∼0.2 (Bland et al. 2012). Thus, the smallest observed craters would likely be up to 20 m at their deepest.
For imaging resolution, ∼15 m pixel−1 would allow for a mapping resolution of 7 pixels in diameter for the smallest crater (100 m), which corresponds to the minimum needed for accurate morphometric mapping of a crater's aerial geometry (Ferguson et al. 2020). These images would then be used to generate topographic data; thus, the horizontal resolution of the topography would depend directly on the image resolution. Image stereo pairs generally produce topographic models with a resolution a factor of 4 lower (Shean et al. 2016), resulting in a resolution of ∼60 m pixel−1 for topographic data. Only a single depth value is needed for each crater, where the deepest point within a crater would be extracted to find its maximum depth. For craters at the limit of resolution and only a couple of pixels available, an average depth would be used instead. To assess how this measured average depth for a given crater relates to its true maximum depth, known inventories of craters could be downsampled to quantify how average values could be used to extrapolate maximum depth at the craters' centers, incorporating any errors from empirical relation values. Additionally, the vertical resolution of the topographic data set would be a factor of 4 higher than the horizontal resolution (∼15 m pixel−1 or equivalent to the original image horizontal resolution), which suggests the depths of the smallest craters (∼20 m) would still be detected within error (Shean et al. 2016; Breton et al. 2019).
Finally, semiglobal coverage (50%) would be required to obtain a crater population that is large enough to generate significant results. This requirement is based both on (1) the total coverage of ancient, cratered terrains on Enceladus, which cover roughly half of the surface (Crow-Willard & Pappalardo 2015), as well as (2) the number of craters required for analyses. With respect to the latter requirement, we begin by proposing that we predict a total detectable crater population of >40,000 craters (including all shapes and sizes above 100 m), based on existing crater populations from Enceladus and Rhea (Kirchoff & Schenk 2009) and assuming up to 50% tectonic resurfacing and removal (Crow-Willard & Pappalardo 2015). For the first approach, which makes use of all craters between 100 m < D < 1 km, we predict a total small crater population on Enceladus of >37,000, which includes up to 5% erasure from modeled plume infilling thicknesses directly adjacent to the SPT (Kempf et al. 2010; Southworth et al. 2019). This population exceeds existing crater databases for Saturnian moons (Kirchoff & Schenk 2009; Ferguson et al. 2020) and would allow for spatial analyses of plume fallout. For the second approach, we predict a crater population of >4000 elliptical craters, based on 10% elliptical populations from Tethys (Ferguson et al. 2020), which is more than required to successfully analyze reorientations through time (Holo et al. 2018). If only 50% of the surface is imaged, then these numbers are halved, and, crucially, >2000 elliptical craters are predicted. This is close in magnitude to the population used in Holo et al. (∼1500 craters), and lower coverage would risk limiting crater populations and thus the statistical significance of results (Holo et al. 2018). Thus, a 15 m pixel−1 stereo image data set with 50% coverage is required to successfully resolve the history of paleo plume and ice shell orientation in Enceladus.
Craters would be identified as quasi-circular patterns, and because geological and topographic interpretations require only contrasts in reflectance in the visible light as opposed to specific reflectance values at specific wavelengths, these images can be monochromatic. As such, the spectral range required is 400–750 nm (visible), which can be centered on an effective wavelength of ∼550 nm, with a minimum spectral resolution of ∼200 nm (the FWHM). This is comparable to the range and resolution of monochromatic images obtained from the Context Camera on board the Mars Reconnaissance Orbiter, which successfully mapped surface features at the meter-scale on Mars (Bell et al. 2013). For the images, a minimum of one scene acquisition across the surface at a constant altitude would be required to produce a consistent resolution data set. The previously generated surface map from Cassini data is limited by the resolution of the instruments and variable flyby altitudes. To generate topographic data, stereo observations would be performed requiring a minimum of 2 imaging sequences (with no particular temporal constraint) of each surface element with nadir < +/−20°. The range and resolutions of the physical and observation parameters above would allow high-resolution, semiglobal maps of crater populations to be constructed.
In the first approach, depth-to-diameter ratios (d/D) would be calculated for every resolvable small crater (>100 m). If d/D decreases (i.e., craters appear shallower relative to their diameter) systematically only with increasing proximity to the present-day plume, then the SPT has been the primary source for billions of years (Kirchoff & Schenk 2009); this serves as the null hypothesis. If the residual depths decrease systematically toward a different point location (such as the smooth unit in the LHT), this would suggest there may have been previous plume fallout sources in the past (paleo plume sources); this serves as the alternate hypothesis. Multiple source signals may occur but should point to a previously tectonized region that could have hosted plume vents. The largest observable d/D values are expected to be close to 0.2 for fresh craters and trend toward 0 for completely infilled craters (d = 0). The function d/D = f(distance to source) depends on plume intensity, duration, and particle size, but can be approximated by a power law (Southworth et al. 2019). As such, we would only investigate relative changes (power-law decrease/increase versus no effect) as opposed to assessing the numerical values of d/D. Ultimately, different systematic spatial distributions of d/D will help validate which of the hypothesized fallout sources is the primary crater shallowing mechanism, as well as if and where additional heat/plume sources have existed throughout Enceladus' geologic history (see Figure 7).

Figure 7. Schematic overview of science closure for crater morphology mapping (Objective 4). The top row summarizes Task 1, which utilizes crater depth and diameter to characterize crater shallowing as a function of space to identify potential paleo plume sources (a) and (b). The bottom row summarizes Task 2, which uses elliptical crater orientation to quantify potential ice shell reorientation (c) and (d). (a) Schematic diagram of Enceladus and key geometries for Task 1. Dashed lines are the swath from the north polar to the SPT. This hypothetical swath intersects a potential paleo plume source (black square). Blue circles symbolize mapped craters. (b) Hypothesized relationship between depth/diameter ratio (d/D) along a latitudinal swath from the north pole to the SPT, with each individual crater plotted as a blue data point (see panel (a)). If craters become shallower (decrease in d/D) only with increasing proximity to the SPT (light gray fitted line), this suggests the present-day SPT was the main source of plume deposit fallout for the duration of its geologic record. However, if there is a crater shallowing signal that points to another source location (dip in black fitted line), this would suggest there was another source of deposit fallout (a paleo plume). (c) Schematic diagram of Enceladus with elliptical crater populations (blue circles), which are likely to have major axis orientations (ø) aligned to its east–west orbit (see the text for an in-depth explanation). The present-day north pole is shown, in addition to a potential paleo north pole at a slight angle. (d) Rose diagram depicting the orientations of mapped elliptical craters (i.e., binned frequency distribution of orientations). If there is only a strong east–west contribution (gray-outlined bins), this would suggest the present-day ice shell and north pole configuration have been in place for the duration of its geologic record. If there is another significant contribution at a different orientation (black-outlined bin), this would suggest reorientation of the ice shell, as measured by the elliptical crater population alignment.
Download figure:
Standard image High-resolution imageIn the second approach, for every resolvable crater >100 m that is elliptical (ellipticity, e >1.1; Bottke et al. 2000), we would calculate its orientation (the direction of the major axis alignment). These can be expressed as azimuths, ranging from 0°–180° or binned into cardinal directions. The frequency distribution of ellipticity orientation is expected to exhibit a strong east–west predominance (90°), due to planetocentric impacts seen on other Saturnian satellites (Kirchoff & Schenk 2010; Ferguson et al. 2020, 2022). If there is only a strong contribution aligned along east–west, then the current ice shell arrangement has likely been in place for the entire cratering record of Enceladus; this serves as our null hypothesis. If instead we find an additional orientation contribution at any angle to east–west (≠ 90°) that is not random and statistically significant, then this would suggest the ice shell was aligned to a previous (paleo) pole. This polar wander scenario, which implies the ice shell has undergone reorientation, serves as our alternate hypothesis; these geometries are illustrated in Figure 7. Note that if enough elliptical craters are detected across the surface, which is very likely (as suggested by Ferguson et al. 2020), the spatial distribution of orientations within different terrains could also be used to assess if there are terrains of different ages that display preferred orientations, allowing ice shell orientation changes through geologic time to be quantified (Ferguson et al. 2020).
Despite the apparent simplicity of this twofold geomorphic analysis, potential confounding variables should be considered, including various deposition sources (plume versus E-ring), faulting/fracturing, secondary impacts, differing impactor populations (helio versus planetocentric), depth/diameter variability as a function of diameter on icy surfaces, variable impactor speed, and added complexity in reorientation histories. For all of these sources of noise, we discuss below ways in which these may be identified and mitigated in advance. Due to the large scale of the E-ring and its comparatively diffuse concentration of particles in comparison to the plume, it is possible to distinguish plume contributions to crater infill from E-ring contributions. In particular, the contribution from past and present plumes should vary on the surface over shorter sublunar scale wavelengths and converge to point paleo-sources. These variations would be superimposed on but distinct from longer, lunar scale wavelength variations from E-ring deposition. For faulting and fracturing, the proposed high-resolution image and topography data would allow for comprehensive identification and mapping of tectonic features, which are detectable through their linear or curvilinear morphology (Crow-Willard & Pappalardo 2015). Using this enhanced tectonic map, we would be able to eliminate crater morphologies from our mapping database that appear to intersect or be strongly affected by faulting, fracturing, volcanism, or other structural processes not related to impact formation (e.g., polygonal crater shapes, offset craters, slumping, or wall failures; Schenk 2002). The crater populations would be compared to those currently being cataloged for Tethys and Dione (Ferguson et al. 2021); for this simple comparative analysis, the effect of secondary impacts would not be a concern.
Further, to account for depth/diameter variability as a function of increasing diameter on icy surfaces (Melosh 1989), techniques similar to Schenk et al. (2002) would be utilized for a global Enceladus crater population (Schenk 2002). For example, in observing fresh craters of different diameters, least-square fits can be used to determine initial depth/diameter for each diameter bin (Schenk 2002). This would then be used to determine the likely depth/diameter ratio for fresh craters globally, and for which diameters the relationship breaks occur (from simple, to complex, to ringed craters; Melosh 1989). For preliminary studies, before full global coverage is available, depth/diameter ratios and functions from similar icy satellites could be utilized. Variable impactor populations may affect these results in two different ways. First, only planetocentric impactors result in east–west oriented elliptical craters, whereas heliocentric impactors can generate isotropic impactors. Because of this, heliocentric contributions would not affect the frequency distribution at any particular orientation as they are randomly aligned. Second, these two contrasting impactor populations have different impactor speeds, with planetocentric populations being slower. This would affect crater depth as faster impactors generate deeper craters for a given diameter. To account for this, we would utilize techniques similar to Ferguson et al. (2020) to identify the contribution of heliocentric versus planetocentric populations and calibrate from our global data set how these may affect depth-to-diameter ratios of fresh craters on Enceladus (Ferguson et al. 2020). Our results may also be compared to existing data sets from other Saturnian moons to compare the impactor contributions. Finally, in addition to the two hypotheses concerning elliptical crater orientations (one alignment versus >1 discrete alignments; Figure 7), there is also a third possibility that there is no consistent alignment observable (i.e., only a heliocentric distribution is present). However, this would also provide a novel quantitative insight into the impactor population and absolute age of Enceladus; if Enceladus was not affected by the debris disk that shaped the other two satellites, this would imply that Enceladus is much younger than Mimas and Dione (Ferguson et al. 2020). Thus, although potential confounding factors may exist, these can be accounted for and minimized to ensure the paleo plume and reorientation histories of Enceladus are effectively deconvolved from observed crater morphologies. Ultimately, these paleo plume and reorientation histories would inform us of the location of past heat sources and thus potential habitable environments beyond the south pole. It would also deepen our understanding of the physical and thermal history of Enceladus, shedding light on the critical relationship between available energy, liquid water, and the icy crust, and how their complex interactions may be recorded in Enceladus' geomorphologic and geological record.
3. Instruments
To address the science objectives proposed herein, the AXE science payload would include a high-resolution telescopic camera to produce images of Enceladus' surface and a mass spectrometer to conduct in situ analyses of plume material. Gravity science would also be conducted during flybys through the High Gain Antenna on board the spacecraft using the Ka-band radio links between AXE and the Deep Space Network (DSN). Although mission target selection and science formulation was made in response to the NF-4 AO, instrument selection and other spacecraft configurations, per instruction, were proposed and evaluated under the NF-5 cost cap, as this is the period AXE would be expected to fly. The instruments that would be utilized are proposed designs that have been selected to meet the science and engineering requirements of the AXE mission; however, we note that these instruments do not currently exist with the exact hardware configurations described in this section; each are based on existing instruments with flight heritage from previous missions or those currently in development for missions in the near future. Table 1 summarizes these instruments, their specifications, and the corresponding science objectives the measurements from these instruments would address.
Table 1. AXE Instrument Analogue Specifications
| Payload Accommodation Requirements | BEENIE | MAIAB |
|---|---|---|
| Heritage Instrument | LORRI | QITMS |
| Science Objectives | O2, O3, O4 | O1 |
| CBE Mass (kg) | 8.6 | 7.5 |
| CBE Power (W) | 5.8 | 40 |
| CBE Data Rate (Mb s−1) | 12 | 9.2 |
| Pointing | ||
| Knowledge (arcseconds 1σ) | Knowledge: 50 | N/A |
| Control (arcseconds 1σ) | Control: 104 | |
| Stability (arcseconds s−1 1σ) | Stability: 5.2 | |
| Slew (arcseconds s−1) | Slew: 2880 | |
| Viewing Direction in Body Coordinates | Nadir | Ram |
| CBE Dimensions (m) | 2.63 (l) × 0.28 (d) | 0.11 (l) × 0.29 (d) |
| CBE Cost ($M FY22) | 14.8 | 52 |
Download table as: ASCIITypeset image
3.1. Better Eyes on ENceladus IcE: BEENIE
The primary observational science of Enceladus' surface for Objectives 3 and 4 would be conducted through multiple high-resolution images taken by the Better Eyes on ENceladus IcE (BEENIE) telescopic camera. BEENIE is based on the LOng-Range Reconnaissance Imager (LORRI) used on the New Horizons mission, which is a narrow angle (field of view, FOV, = 0.29°), high-resolution (instantaneous field of view, IFOV, = 4.95 μrad pixels) telescopic imager (Cheng et al. 2008). The primary hardware modification that BEENIE would require from the heritage LORRI instrument includes the installation of a larger pixel array (2048 × 2048 versus the 1024 × 1024 array on LORRI) for the CCD detector, which would allow for a wider area of the Enceladus surface to be imaged simultaneously. Consequently, the IFOV would then be divided by half to 2.48 μrad. To measure the change in vent width expected through tidal forcing at the SPT (Objective 3), images from BEENIE would be taken at closest approach to Enceladus (<120 km altitude) to achieve the required resolution of 0.3 m pixel−1. To measure the depth, shape, and orientation of craters (Objective 4), BEENIE would be used to collect topographical images of Enceladus during flybys at higher altitudes (<6000 km). During these higher altitude approaches, 50% of the surface of Enceladus would be imaged at a resolution of 15 m pixel−1. To eliminate any potential pixel smear during imaging, the BEENIE camera would be mounted on a two-axis scan platform.
3.2. Molecular and Isotopic Analysis for Biomarkers: MAIAB
The analytical instrument suite initially proposed by our team to meet the proposed science objectives included a mass spectrometer analogue of the MAss SPectrometer for Planetary EXploration (MASPEX) instrument, which would satisfy all associated sampling requirements with margin (Brockwell et al. 2016). However, the initial mission architecture studies carried out with Team X necessitated a descope from a MASPEX instrument analogue to a JPL QITMS analogue due to the high mass and cost of MASPEX in the context of our budgetary constraints at the time. While the analytical performance of the QITMS (mass range, sensitivity, etc.) is sufficient for the associated measurement requirements in theory, in practice, the sampling capabilities of the QITMS alone without further instrument development would be insufficient for probing the complex organic chemistry expected at Enceladus, including any refractory organic or inorganic compounds present, as the QITMS was designed and is only currently able to probe volatile constituents. Although this would allow for the evaluation of isotope fractionation at Enceladus through the analysis of volatiles such as carbon dioxide and methane, which were detected within the plume by Cassini's INMS instrument (Waite et al. 2006), the ability to analyze ice grains is outside the capabilities of the QITMS in its current state.
Relics of heavier, potentially macromolecular nonvolatile organic compounds were detected in Enceladus ice grains by both the INMS and CDA instruments (Postberg et al. 2008, 2018), implying complex organic chemical processing ongoing within Enceladus. To successfully probe the chemical inventory at Enceladus and determine its provenance, it is therefore necessary that the proposed analytical suite possesses the capability to determine both ice grain and plume vapor composition. One option to achieve this would involve simply expanding the instrument's capabilities by using MASPEX as an instrument analogue instead of the QITMS, which would enable the analysis of both plume vapor and ice grains (Sephton et al. 2018). Like the INMS, MASPEX possesses the capability to analyze ice grains as they enter the gas inlet and vaporize from impact onto the antechamber, generating bursts of volatile species that can then be analyzed (Teolis et al. 2010). A potentially undesirable consequence of this trade would be that, while MASPEX possesses the capability to determine ice grain composition from impacts onto the antechamber walls, MASPEX is not specifically designed to perform compositional analysis of single ice grains, which could be prohibitive considering the variations in organic content expected between ice grains due to different potential formation processes (see Section 2.1.1). Moreover, in addition to producing a challenging mass spectrum, the most refractory organics and inorganic compounds would likely remain in the antechamber and evade compositional analysis. The significant increase in spacecraft mass and corresponding cost associated with this trade could also potentially result in budgetary constraints, requiring further trades to be made to accommodate the increased cost.
Another potential option would include the addition of a dust analyzer, which utilizes hypervelocity (>1 km s−1) impacts as an ionization method to probe the composition of individual dust and grains such as those comprising the Enceladus plume (Srama et al. 2004; Goode et al. 2021). An appropriate instrument analogue in this case would be the SUrface Dust Analyzer (SUDA) slated to launch with the Europa Clipper mission in 2024 (Kempf et al. 2014). With a mass of <4 kg, the mass burden resulting from the addition of a SUDA-type instrument would be minimal. In its current configuration, SUDA's power consumption varies between 11 W and 16 W during survey and flyby mode, respectively; however, a SUDA-type instrument developed for Enceladus applications would likely require less power as radiation tolerance is not a driving factor in instrument design in this case (S. Kempf, 2023, personal communication). As opposed to utilizing a MASPEX analogue exclusively, the combination of the QITMS and SUDA instrument analogues would allow isotope fractionation to be evaluated via the analysis of volatiles and nonvolatile organic molecular distributions to be examined via the analysis of ice grains. Because the ice grains within the Enceladus plume have been shown to differ markedly in composition, individual ice grain analysis would provide context to the organic content within them, as the composition of individual ice grains can be used to determine the likely mechanism by which they were formed, better enabling a quantitative interpretation of the environment they represent (Postberg et al. 2009, 2011, 2018).
The Molecular and Isotopic Analysis for Biomarkers (MAIAB) instrument presented herein is a proposed mass spectrometer based on heritage from JPL's Quadrupole Ion Trap Mass Spectrometer (QITMS; Simcic et al. 2021), which is currently in development and has completed technology demonstrations on board the International Space Station. MAIAB would be used to address Objective 1 by measuring the mass-to-charge ratio of organic compounds during flythroughs of the plume vapor, generating approximately 240 coadded mass spectra over the course of a single 4 minute flyby. MAIAB was chosen for its larger mass range (1–600 Da) compared to the INMS mass spectrometer on board Cassini (1–100 Da; Waite et al. 2004), which would enable measurements of volatile compounds within the water vapor plume. MAIAB would provide a significantly higher mass resolution (18,000 m/Δm at 40 Da) than Cassini's INMS instrument (up to 100 m/Δm), which, in addition to enabling isotopic analyses critical for addressing Objective 1, would enable a drastically increased differentiation of plume volatiles detected previously, as well additional compounds beyond the analysis capabilities of the Cassini INMS (Simcic et al. 2021). While the hardware for in situ analysis of plume volatiles would remain the same as the QITMS, MAIAB would require additional supplemental sampling capabilities to allow for the chemical compositional analysis of ice grains within the plume.
The inclusion of an SUDA-type dust analyzer would further supplement the compositional analysis capabilities of MAIAB by enabling the analysis of any nonvolatile species, providing a mass resolution m/Δm of 200–250 across a mass range of 1–250 Da. Although this mass range is insufficient for the direct detection of fatty acid species up to C40 specified previously (see Section 2.1.1), this mass range would allow for the direct detection, if present, of all amino acids utilized in terrestrial biology and fatty acids up to C15. Given the relative abundances of meteoritic amino acid and fatty acid contents (and subsequently those expected in the Enceladus ocean in an abiotic scenario), this modification would result in little impact on the mission's ability to address the science objectives outlined herein. Given the cost and mass margin available subsequent to the final mission architecture design iteration with Team X, the addition of a dust analyzer as a means to analyze refractory organics, inorganics, and other nonvolatile compounds would bolster the mission's science return while very likely falling within New Frontiers-5 cost cap. However, without the possibility of further iterations within a dedicated mission architecture study, this is difficult to conclude with certainty.
3.3. Radio Science
The high gain antenna on board the spacecraft and associated radio communications would be used to conduct gravity science investigations addressing Objective 2. During flybys, the gravitational field of Enceladus would be captured to degree-10 using spacecraft velocity measurements via the Doppler shift in a radio signal transmitted to Earth from the spacecraft. In Section 2.2, we demonstrate that we can determine the ice shell thickness of Enceladus to within 10% using degree-10 gravity field measurements with a spacecraft flying <4 km s−1 relative to Enceladus (what we expect of a flyby), at an altitude of <81 km. While the Ka band would be preferentially used for Doppler shift measurements and high data-rate science, AXE would still include the X band for additional uplink and downlink.
4. Data Sufficiency
To ensure the viability of the proposed mission concept, it is important to ensure that the sampling plan would generate sufficient data to address the proposed science questions. Similarly, it is necessary to determine whether there exists a sufficient intersection of broadcast/download speeds and data compression such that all acquired data could be returned for subsequent analysis.
4.1. Science Closure
For Objective 1, the ∼240 mass spectra generated from a single plume sampling flythrough (using the QITMS) could in principle be sufficient for biosignature detection; observing clear molecular patterning within these spectra unexplainable through abiotic chemistry would provide evidence for a potentially biological origin. However, the composition of ice grains has been shown to vary significantly in organic (Postberg et al. 2018) and salt (Postberg et al. 2022) content, and the observed ice grain content has shown to differ significantly with variations in sampling altitude as well (organic content in ice grains increases with decreasing altitude). Although the compositional diversity observed in the ice grain population likely does not reflect the same chemical diversity in the Enceladus ocean, five plume sampling flythroughs at altitudes between 30 and 60 km would provide redundancy in assessing any potential biosignatures and chemical indicators of habitability through a more robust data set, as well as account for any potential errors in sampling mechanisms. Of the 30 total flybys planned at Enceladus, we designate five of these flybys as in situ plume analyses, which can be performed in tandem with high-resolution vent imaging, gravity science measurements, and regional imaging (see below). Above 60 km, the relatively low plume density increases the risk of a low volume sample with reduced organic content, while below 30 km the abundance of larger plume particles increases risk to both the spacecraft and the MAIAB instrument. The vast majority of amino acids and fatty acids observed in terrestrial biology fall within the mass range of 2–600 Da; the MAIAB mass range of 1–600 Da would therefore possess the capability to thoroughly assess the biological potential of Enceladus. However, this would require that the instrument suite utilized in performing these measurements is capable of nonvolatile organic compositional analysis of ice grains (see Section 3.2). Moreover, in addition to allowing for the differentiation of isotopically distinct CH4, CO2, and H2, a mass resolution of up to 18,000 m/Δm satisfies the requirements for CH4 clumped isotopologue analysis with margin (see Section 2.1.2). With a robust data set of over ∼1200 mass spectra over the course of five plume flythroughs, ample mass resolution margin for the proposed plume analyses, and a mass range encompassing the vast majority of biologically relevant amino acids and fatty acids present on Earth, the data collected from the analyses proposed herein would enable the biogenicity of organic content within the plume to be fully evaluated.
The precision of Doppler shift readings addressing Objective 2 require the spacecraft to pass Enceladus at a maximum altitude of 80 km at closest approach. At least 30 flybys would be required to produce accurate global calculations of ice shell thickness (see Section 2.2); therefore, gravity science measurements would be performed during all 30 flybys and serve as the primary driver for the number of required flybys to achieve overall science closure. Determination of ice shell thickness obtained through these measurements would provide the basis for calculations of conductive heat flux and thus the maximum tidal heating budget of Enceladus (power output). With 30 trajectories needed for accurate gravity science, there is sufficient margin in the proposed mission design to fulfill all imaging science and plume sampling data requirements. Measurement of ice shell thickness can be further refined through observations of Enceladus' physical libration (see Section 2.2) using imagery captured for Objective 4. Importantly, Objective 4 requires repeat imagery to adequately assess crater topography. The difference in each crater's location in the Saturn-orbiting reference frame across two images measures the oscillation of Enceladus' ice shell (e.g., Tajeddine et al. 2014; Thomas et al. 2016). Because of BEENIE's high resolution and the required surface area of Enceladus to be imaged for Objective 4, we expect a nearly 200-fold improvement of uncertainty in physical libration relative to Thomas et al.'s (2016) measurement. This would provide a similar improvement to the uncertainty of ice shell thickness predicted by the libration. However, this prediction is still limited by uncertainties in the densities of the ice shell, ocean, and core. Luckily, gravity data would improve these measurements. Measurement of the ice shell thickness provides the estimate of heat conducted out of Enceladus, which must then be compared to a measurement of the heat input to Enceladus. This is achieved by a measurement of Enceladus displacement in its orbit when comparing its observed (migrating) orbit to its expected location assuming a constant orbital frequency. Using gravity as Lainey et al. (2020) used to measure Titan's migration, a difference of only 11 mm s−1 would need to be detected (see Section 2.2) for 10% error in the observed location of Enceladus and that predicted for an Enceladus with a constant orbital frequency.
Objective 3 requires that three high-resolution images of a vent location along the SPT are collected at four positions through the orbital phase of Enceladus. This would allow changes in vent width to be observed in response to changes in tidal forcing expected throughout the orbital phase, where vent widths are expected to be widest at/near apoapsis and narrowest at/near periapsis (Kite & Rubin 2016). Collecting these images in triplicate during each low-altitude flyby would allow for redundancy in assessing vent motion and additional data points along the strike of the vent selected for imaging; if vent motion is consistent along the strike of the vent throughout each image at a given orbital position, this would indicate an open-crevasse plume formation mechanism, whereas more localized changes in vent structure would indicate a primarily cryovolcanic, point-source mechanism. The AXE spacecraft is designed such that the MAIAB and BEENIE instruments can function simultaneously, allowing both in situ plume sampling and high-resolution vent imaging to take place during the five designated low-altitude plume sampling flybys if necessary. To assess vent width changes, we would observe the change in number of pixels associated with the vent interior between successive images. Changes in vent width on a scale of ∼1 m must be detectable in the resulting image data; an image resolution of ∼0.3 m pixel−1 is therefore required such that 1 m changes are resolvable across three pixels. Based on its FOV and detector size, the expected spatial resolution of the BEENIE instrument is 0.15 m pixel−1 at an altitude of 60 km, fulfilling the vent imaging resolution requirement with margin and thus enabling observations of the expected vent width changes in response to tidal forcing.
Objective 4 requires the acquisition of image data covering a majority of the cratered terrain, which comprises at least ∼43% of Enceladus' surface (Crow-Willard & Pappalardo 2015). Allowing margin for image overlap and additional targeted imaging of hypothesized paleo-plume locations, stereo image acquisition covering ∼50% of the surface at 15 m pixel−1 would allow us to thoroughly investigate the crater history of Enceladus. Considering the FOV and detector size of the BEENIE instrument, image acquisitions at 15 m pixel−1 would occur at an altitude <6000 km on approach before and/or retreat after gravity flybys. At this resolution, each image would have ground spatial dimensions of approximately 30 × 30 km and would allow for a mapping resolution of 7 pixels in diameter for the smallest craters of interest (100 m), fulfilling the requirements for accurate morphometric mapping of each crater's aerial geometry (Ferguson et al. 2020). Acquiring image data over ∼50% of the surface area (∼400,000 km2), plus a second round of image acquisition over the same area to allow for stereo imaging, would require approximately 846 individual images. This would fulfill the imaging requirements needed to cover the key cratered terrain regions (which account for ∼50% of the surface), enabling the construction of a sufficiently extensive new crater database consisting of small (subkilometer) and undeformed craters. These would in turn be used to determine global morphologic trends, shedding light onto potential past plume locations and ice shell reorientation events throughout Enceladus' geologic history.
4.2. Data Volume
Data acquisition was planned such that the data volumes collected per flyby do not exceed 2000 Mb. The proposed mission design allows for approximately 10 downlink passes between each flyby, during which 200 Mb of data could be transferred per pass using Ka-band downlink. This would allow for all data collected during each flyby to be downlinked before any additional data acquisition. However, the onboard data storage is sufficient to store the full planned mission data volume, which provides significant margin for changes to the data acquisition and downlink schedule. BEENIE image acquisition, with a 2048 × 2048 pixel detector and a 12 bit pixel depth, would produce individual images of 50.33 Mb each. To limit data collection such that all data acquired for each flyby can be fully downlinked before the next flyby, BEENIE could acquire 39 images per flyby and acquire all 846 images required for Objective 4 after 22 of these flybys. In this discussion, we assume 39 images on each of 22 flybys (in tandem with other data collection) for simplicity; for a real-world mission scenario, the exact number of images taken during a sequence may vary considerably between flybys and would be planned during a later phase of the mission, especially given the aforementioned surplus of data storage aboard the AXE spacecraft. During low-altitude flybys, MAIAB would collect approximately 50 mass spectra per second, which are coadded to produce a single mass spectrum and stored on a microSD card. Assuming an approximate Enceladus flyby sampling time of 4 minutes, this would generate 240 mass spectra per flyby, with an estimated data volume of 9.2 Kb per spectra and 2.2 Mb per flyby. Gravity science only requires the amount of data necessary to record the spacecraft trajectory at two points per flyby, which is estimated at 0.167 Mb per flyby. The total data volumes per flyby, categorized by flyby type, are shown in Table 2. In total, the mission data volume encompassing all planned data acquisition necessary to meet the four proposed science objectives is 5.49 GB. This value assumes a compression factor of 1, although 12 bit images are commonly compressed to 8 bit, slightly reducing the total image data volume. We note that the total data volume calculated here does not include the standard 30% overhead wrap; accounting for this would increase the total data volume to 7.14 GB, which is still well below the total onboard data volume storage capabilities of the spacecraft (see Section 5.4).
Table 2. Expected Data Volumes Generated from AXE Science Investigations
| South Pole Targeting | Regional Imaging | Gravity-only and Imaging Margin | ||
|---|---|---|---|---|
| number of flybys | 5 | 22 | 3 | |
| MAIAB | instrument altitude (km) | 45–80 | N/A | N/A |
| data volume per acquisition (Mbit) | 0.00917 | ⋯ | ⋯ | |
| acquisitions per flyby | 240 | none | none | |
| BEENIE | instrument altitude (km) | 60 | 6000 | N/A |
| data volume per acquisition (Mbit) | 50.33 | 50.33 | ⋯ | |
| acquisitions per flyby | 3 | 39 | (as needed) | |
| Doppler | instrument altitude (km) | 80 | 80 | 80 |
| data volume per acquisition (Mbit) | 0.167 | 0.167 | 0.167 | |
| acquisitions per flyby | 1 | 1 | 1 | |
| Total Data Volume per Flyby (Mbit) | 153.357 | 1963.037 | 0.167 | |
| Total Data Volume for All Flybys (MB) | 95.848 | 5398.352 | 0.063 | |
| Total Mission Data Volume (GB) | 5.49 | |||
Download table as: ASCIITypeset image
5. Mission Architecture
In the early stages of mission design, key science questions were approached without a defined mission architecture. This allowed for the consideration of multiple options for observational parameters, data collection methods, and instrumentation to arrive at an optimal mission architecture to address the proposed science objectives. In the process of refining the mission design, we considered lander, orbiter, and multi-flyby architectures alongside the instrumentation and observation requirements needed to meet each proposed objective. During the Team-X Architecture Study, a lander was deemed ineffective because a solitary, stationary spacecraft would severely limit the observational capabilities of the proposed science mission. This, in addition to planetary protection requirements, insufficient image data for safe landing site selection, the budgetary constraints of the NF-5 cost cap, and launch vehicle restrictions, made the possibility of a lander with a secondary spacecraft infeasible. An orbiter was considered; however, in exploring the observation requirements for each objective further, we determined that the data collection opportunities of an orbiting spacecraft were not significantly improved over a flyby trajectory, and that the additional change in velocity (Δv) required for Enceladus orbital insertion would instead severely limit our launch capacity and therefore our instrument capabilities. The measurement requirements established for each of our Science Objectives (Figure 2) guided the selection of scientific instruments, which then determined the required spacecraft altitude, speed, and orientation for optimal data collection. This information guided the design of the proposed flyby trajectories. The final design of the flight system and other spacecraft components, which was completed during the Team-X sessions in the PSSS culminating week, supports the collection, storage, and transfer of all necessary mission data, allowing for the science objectives proposed herein to be fully addressed.
5.1. Science Mission Profile
In addressing the science investigations described in Sections 1 and 2, the proposed mission would utilize two independent instruments, the BEENIE camera and MAIAB mass spectrometer, while employing the spacecraft's high gain antenna for gravity science (see Figure 8). A minimum of 30 Enceladus flybys would be required to address each science objective; the number of flybys required is driven primarily by gravity science requirements, with the second most significant driver being semiglobal coverage of cratered terrain required for Objective 4 (846 images), which would require 22 flybys at 39 images per flyby. The maximum altitude during close encounters is driven by both gravity science and high-resolution vent imagery of the SPT during south polar flybys. Objective 1 is addressed during a small subset of these 30 flybys as the spacecraft travels through the active plumes (<60 km altitude) at the south pole of Enceladus collecting plume material to be analyzed by MAIAB. Objective 3 is addressed through five flybys during which the spacecraft is <80 km altitude above the SPT, allowing high spatial resolution images of vent morphology to be collected using BEENIE. Lastly, Objective 4 is addressed during 22 of these flybys and would utilize a gimbal to point the BEENIE camera at Enceladus during approach and departure to construct topographic maps of Enceladus; this would also correct for image smearing effects caused by the high relative velocities of the spacecraft.

Figure 8. Schematic representation and description of AXE science operations at Enceladus.
Download figure:
Standard image High-resolution image5.2. Mission Design and Trajectory
The AXE spacecraft is designed to fit within the 4 m fairing of an intermediate-to-high performance class launch vehicle (see Expendable Launch Vehicle guide, NF-4 AO), with Kennedy Space Center serving as the launch site. Utilizing a 21 day launch window starting on 2033 February 22, a characteristic energy C3 of 15.3 km2 s−2 could be targeted. The interplanetary cruise to Saturn would utilize a heliocentric trajectory (Figure 9) and would rely on five gravity assists (Table 3), taking 9.1 yr to complete. Upon arriving at the Saturn system, the spacecraft would require a Δv of 1.0 km s−1 for a successful Saturn Orbital Insertion (SOI), after which it would require an additional 0.05 km s−1 throughout a period of 1 yr to pump-down. During the pump-down phase, multiple flybys of Titan are used to reduce the spacecraft's orbital eccentricity, allowing Enceladus to be targeted with the right inclination, geometry, and distance during flyby. After a successful pump-down, the spacecraft would enter a 4 yr tour phase, performing Enceladus flybys approximately every 2 weeks with minimum flyby altitudes of 30–60 km.
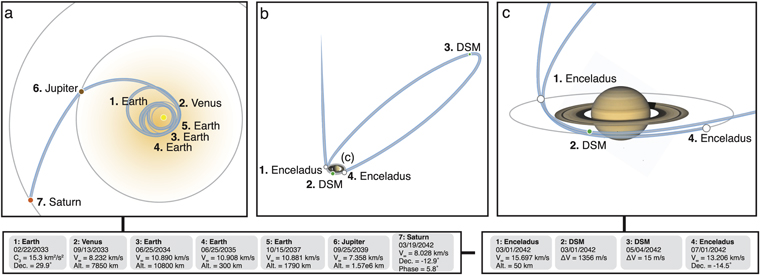
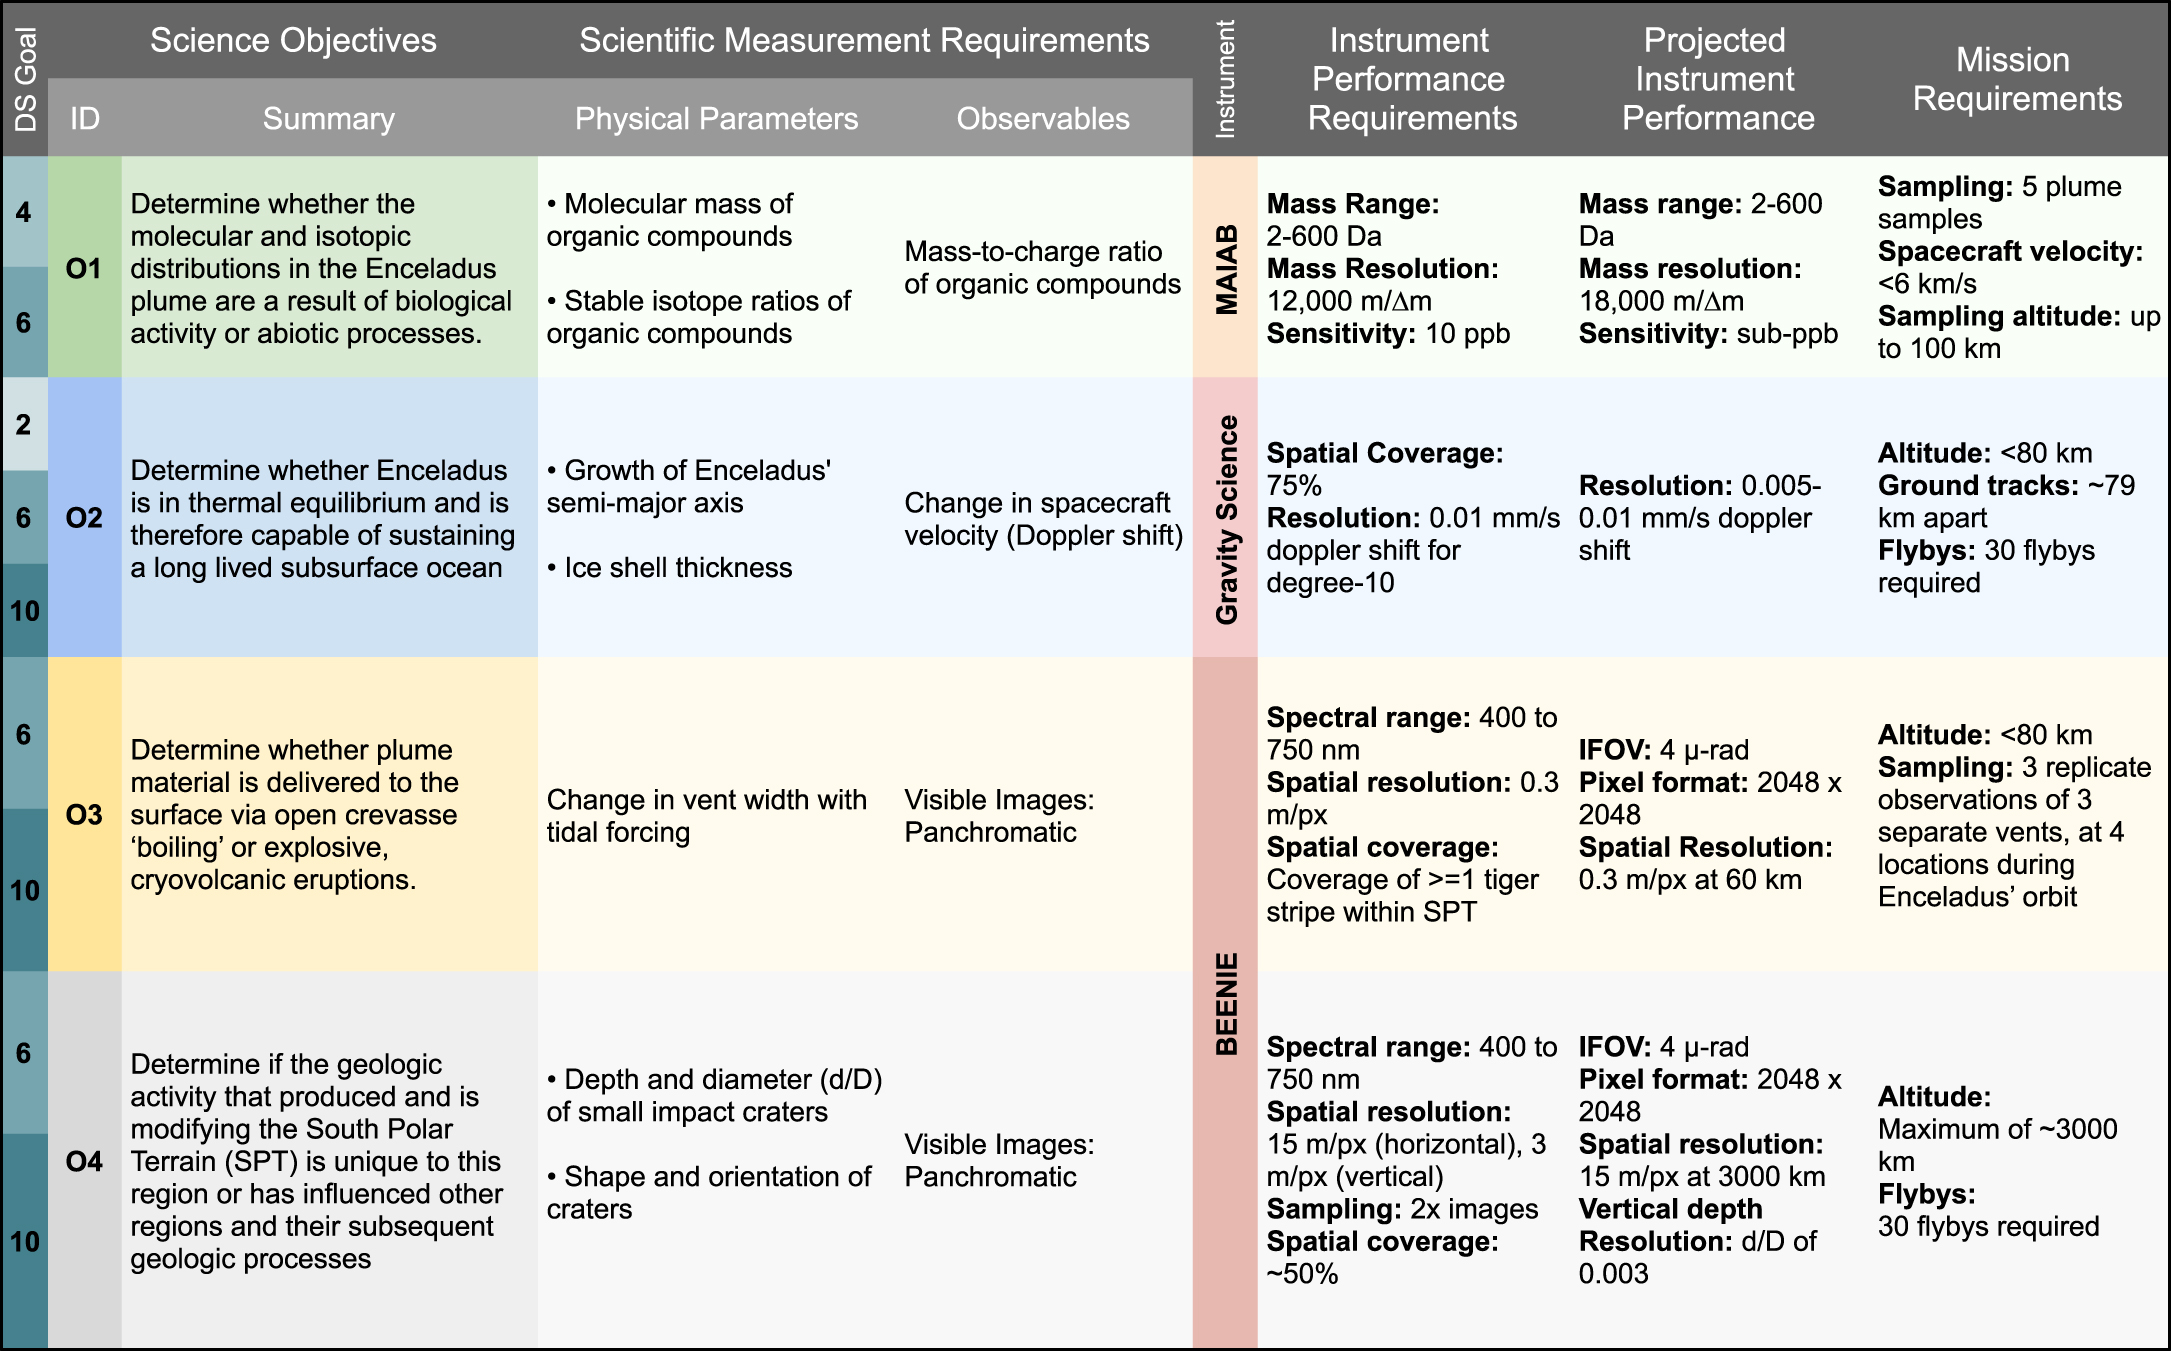
Figure 9. AXE interplanetary cruise and flyby trajectories, including associated deep space maneuvers (DSM) and C3, decl. (Dec.), altitude (Alt.), and Δv required for each phase of the mission, as well as the corresponding velocity of the spacecraft during each phase (V∞ ). (a) Gravity assists from Earth, Venus, and Jupiter would be utilized during the interplanetary cruise phase to reach the Saturn system. (b), (c) Pump-down and DSMs required to tailor spacecraft trajectories such that Enceladus can be targeted with the appropriate inclination, altitude, and velocity for science operations.
Download figure:
Standard image High-resolution image
Table 3. Gravity Assists AXE would Utilize during the Interplanetary Cruise Phase
| Body | Date | Vinf (km s−1) | Altitude (km) |
|---|---|---|---|
| Venus | 08/13/2033 | 8.232 | 7850 |
| Earth | 06/25/2034 | 10.809 | 10,800 |
| Earth | 06/25/2035 | 10.908 | 300 |
| Earth | 10/15/2037 | 10.881 | 1790 |
| Jupiter | 09/25/2039 | 7.358 | 1,570,000 |
Download table as: ASCIITypeset image
Each Enceladus flyby would require a deterministic (10 m s−1) and statistical (15 m s−1)Δv, where 10 m s−1 is used for targeting and 5 m s−1 is used for clean-up. To fulfill the measurement requirements for each Science Objective, we require at least 30 flybys of Enceladus, which would require a total of 0.75 km s−1Δv. These flybys would be designed in advance to maximize surface coverage at high resolution. Leveraging the heritage and experience from the Cassini and Europa Clipper missions, the spacecraft would rely on optical navigation (OpNav) for each flyby with the associated ground team. The 2 week interval between Enceladus flybys would allow the ground team to carefully plan each flyby on a timeline, allowing for sufficient margin to address any unforeseen concerns. Upon the conclusion of the mission, in compliance with NASA's Planetary Protection guidelines, we allocate an additional 0.2 km s−1 Δv for safe disposal of the spacecraft elsewhere in the Saturn system, bringing the total Δv required for the mission to 2.0 km s−1. This value is in compliance with NF-class constraints and budget limits; however, there is also significant propulsion design margin to accommodate any potential increases in the Δv budget (see Section 5.7).
5.3. Flight System
Two instruments would be housed on board the AXE spacecraft: a high-resolution telescopic camera (BEENIE) and a mass spectrometer (MAIAB; Sections 3.1 and 3.2, respectively). These instruments would be separately gimbaled such that BEENIE is allowed two degrees of freedom while MAIAB is allowed one degree of freedom, enabling both instruments to point in the required sampling directions while the radio dish is pointed toward Earth to transmit data during flybys for gravity science (see Section 5.1 for details). AXE would be powered by one Next Generation Radioisotope Thermoelectric Generator. This serves a dual purpose, providing a method of warming the spacecraft with waste heat (detailed in Section 5.9). The radio dish would also act as a heat shield during the Venus gravity assist portion of the interplanetary cruise phase and would also act as a shield during Enceladus plume flythroughs. The spacecraft design is conservative, avoiding risky structures such as long composite booms or deployables while drawing upon heritage from previous missions for thermal management (Section 5.9), propulsion (Section 5.7), and attitude control (Section 5.8). The Sphinx avionics system on board AXE (see Section 5.4) is planned to gain flight heritage on various CubeSat missions as well (Cohen et al. 2020).
5.4. Command and Data Handling
AXE would utilize the Sphinx avionics system (Imken et al. 2017) as the spacecraft's Command and Data System (CDS) flight hardware, providing a smaller, lower-power, and lower-cost alternative to the commonly used JPL Reference Bus (see Table 4). Sphinx was specifically designed for deep space missions; the standard CDS functionality of Sphinx is sufficient to support missions more complex and larger in scope than AXE, providing ample margin to support all flight operations and mission requirements. Sphinx includes 8 GB of onboard memory, exceeding the total mission raw data requirements estimated at 5.49 GB. This surplus in onboard data storage would allow data collection to be prioritized during flybys without the need to regularly downlink and clear mission data. The maximum data rate required by AXE instrumentation is 12 Mb s−1 and the anticipated telecommunication data rates are on the order of Kb s−1, while the maximum supported data rate of the Sphinx hardware is 200 Mb s−1. The inherent margins allowed by the Sphinx avionics system would allow for flexibility in mission planning and operations and would further support contingencies and potential mission extensions through a smaller, lower-power, and less-expensive system. Although Sphinx lacks the extensive flight heritage of the JPL Reference Bus, Sphinx will be launching on two upcoming CubeSat missions on board Artemis-1 (McIntosh et al. 2020) and has been designed and promoted as the next generation of JPL avionics subsystems for future deep space missions.
Table 4. Comparison of the Sphinx Avionics System with the JPL Reference Bus
| Sphinx | JPL Reference Bus | |
|---|---|---|
| Cost | $32 million | $45 million |
| Mass | 8 kg | 22 kg |
| Power | 8 watts | 53 watts |
| Heritage | coming soon | 20+ yr JPL flight heritage |
Download table as: ASCIITypeset image
5.5. Telecommunications
The DSN would be utilized for interplanetary communications including data uplink/downlink, telemetry, and communications. All uplink and downlink rates were determined assuming a 34 m DSN station and a 3 m high gain antenna (HGA) on board the spacecraft, which was chosen to provide increased thermal protection during the initial mission phase. The proposed telecommunications system would contain both a Ka- and X-band system for both uplink and downlink. Ka-band communications would be necessary for the gravity science measurements discussed in Section 2.2 and would operate through the HGA, enabling a downlink rate of 17.5 Kb s−1 during the science phase at Saturn. X-band communications (both uplink and downlink) would be operated through the low gain antenna at ≤4 au from Earth, the medium gain antenna at ≤7 au from Earth, and the HGA at ≥7 au from Earth. Uplink and downlink rates for the X band would be 7.9 Kb s−1 during the science phase at Saturn, while a minimum of 2 Kb s−1 uplink would be supported throughout the entire mission duration.
5.6. Power
The AXE spacecraft would be powered by a single Next-Generation Radioisotope Thermoelectric Generator and a secondary battery, providing a generous end of mission power output of roughly 330 W without adding excessive mass to the spacecraft. At a distance of over 9 au from Earth, a solar array architecture capable of meeting the mission's power needs at Enceladus would be infeasible. Multi-Mission Radioisotope Thermoelectric Generators were also considered but were ultimately not included in the final mission design due to their high rate of power degradation. After >10 yr of cruise time, a single RTG would be sufficient to power all mission operations with the exception of flyby science, for which supplemental power is provided by a 2.86 kg rechargeable lithium-ion battery, ensuring that a positive power balance would be maintained over the full course of the mission.
5.7. Propulsion
The propulsion system is sized for a total spacecraft wet mass of 3600 kg, fully accommodating the spacecraft for launch vehicle allocation, and would accomplish the required Δv budget of 2.075 km s−1, which includes ∼25 m s−1 per flyby for the V-E-E-E-J gravity assists, 1 km s−1 for SOI, 25 m s−1 per flyby (30 total Enceladus flybys), and 200 m s−1 for disposal. Any spacecraft mass margin present under 3600 kg would increase the Δv budget. This configuration includes an Aerojet R-42 bipropellant main engine (200 lbf), four monopropellant Aerojet MR-107T thrusters (25 lbf) for trajectory correction maneuvers, and eight monopropellant Aerojet MR-106E thrusters (5 lbf) for the attitude control system. Additional hardware includes four pressurant tanks and three fuel and oxidizer tanks. The proposed AXE propulsion system consists entirely of flight heritage hardware, drawing from the MILSTAR, GRO, and MSL missions, and would constitute a significant fraction of the spacecraft mass, with propellant accounting for 2043.4 kg, resulting in a total spacecraft mass of 3455 kg.
5.8. Altitude Determination and Control
The attitude determination and control system was designed to provide three-axis stability with reaction wheels using star sensors, star trackers, and inertial measurement units (IMUs) for attitude determination. This design is driven by agility, pointing, translational maneuver, and on-orbit calibration mission and science requirements using state-of-the-art sensors and control actuators. Specifically, the agility requirements are driven by imaging science and general maneuvering at 0.8° s−1 and 0.0167° s−1, respectively. For Δv translational maneuver requirements, a slew rate of 0.0167° s−1 would be required. Further analysis would be necessary with respect to navigation for pointing requirements for translational motion. Four reaction wheels fulfill requirements for general maneuvering of the AXE spacecraft. However, during Enceladus flybys, an additional scanning platform for the BEENIE instrument would increase its slew rate for points of interest, for which BEENIE requires a knowledge of 50'', control of 104.4'', and stability of 5.2'' s−1. For momentum dumping of the reaction wheels, eight balanced thrusters with 22 N of thrust each would be used.
For on-orbit calibration, the thrust level and alignment to the spacecraft would be corrected 1–2 months after launch. In addition to thruster calibration on-orbit, IMUs must have periodic initializations with the star trackers, and the HGA pointing must be calibrated in conjunction with telecommunications. Eight Sun sensors with 1° accuracy would be used initially for coarse attitude estimation after launch and during all modes of the mission, including safe mode. Following this, two star trackers with <2'' accuracy would be used to provide fine attitude estimates during all modes. For science and general maneuvers (launch, telecom, SOI, flyby science, and safe mode), IMUs would be used to provide fine attitude estimation (<1'' accuracy) relative to knowledge updates from the star trackers, which would increase the sampling rate to further reduce the attitude uncertainty from sensor measurements. To reduce power expenditure, the IMUs would not operate during the quiet cruise mode and recharge mode. Similarly, the reaction wheels, which provide the precise pointing required for the HGA (telecom mode) and BEENIE (flyby science mode), would not be operated outside these modes. Alternatively, thrusters (with a max capacity of 12 Nms) would be used to coarsely point (with deadbanding at an allowed attitude error) during the launch, quiet cruise, SOI, recharge, and safe modes.
5.9. Thermal
Successful mission operations require that avionics are maintained at temperatures between 253 and 323 K (the allowable range), with the goal of maintaining all equipment and propellant near room temperature. To achieve this, AXE would use a passive temperature control approach by utilizing RTG waste heat and thermal rejection via radiators with louvers. A maximum power consumption of 205 W steady state is expected during the telecom phase; therefore, a 0.2 m2 shunt radiator would allow for the dissipation of excess power. The temperature of extraneous equipment would be maintained by a number of radioisotope heater units (RHUs) and variable radioisotope heater units (VRHUs) providing 86 W of power; in particular, 13 VRHUs would regulate the temperature of the 13 thruster valves (two RHUs per VRHU assembly) and 60 RHUs would be distributed as needed for other equipment/payload interfaces.
The two main thermal resources influencing the flight system are the heater power required to maintain minimum temperatures under the worst case cold (WCC) scenario and the heat rejection system for the worst case hot (WCH) scenario. The WCH scenario would likely occur during the Venus flyby at >10,000 km altitude, where overheating and equipment damage would be mitigated by pointing the HGA toward the Sun during this flyby to provide thermal shielding. During Venus flyby, the radiator-side of the spacecraft would face away from the planet at altitudes <3000 km to prevent damage to the spacecraft. To regulate temperature during the WCH scenario, waste heat would be rejected into space through a 0.655 m2 radiator with louvers. The WCC scenario would occur at Enceladus, where the solar load is 1/100 of that experienced at Earth; however, the RTG waste heat (∼175 W, allowed by a chamber around the fuel and oxidizer tanks) would be sufficient for propellant regulation. Batteries and avionics would be held at operating temperatures from their own waste heat; however, heat generated by the RTG could also be utilized to maintain these temperatures by radiating heat from the propellant bay to the bus bay. Heaters with a power output of 87 W are also included as redundancy in risk mitigation but are not expected to be necessary.
6. Cost and Risk Assessment
6.1. Cost
Mission cost was assessed using the Jet Propulsion Lab Institutional Cost Model (ICM) with the assumption that this mission would be funded under the NF-5 Cost Cap of $900M for the principal investigator (PI) managed mission cost (PIMMC) for phases A–D. The ICM is used to estimate the developmental costs of the mission for each Work Breakdown Structure (WBS) element (Table 5) using an analogy/parametric methodology. Using this methodology, the AXE mission cost was estimated at $809.5M FY22 dollars with 30% reserves on all WBS elements. Mission Phases E and F would encumber $341.3M, bringing the total mission cost (Phases A–F) to $1150.8M (Table 6), including 30% reserves (5% more than the New Frontiers call requires). An initial margin of $90.5M (Phases A–D) could be used to make various trades, specifically regarding the MAIAB mass spectrometer (discussed previously in Section 3.2) and potentially the addition of a thermal imaging camera as well to enhance the science return of the mission (see Section 8.2). The AXE instrument suite (WBS element 5) was estimated using the NASA ICM. The AXE spacecraft would require a 4 m high-performance fairing launch vehicle, incurring a $22M penalty based on the NF-4 AO; however, the magnitude of this penalty is expected to change with the release of the NF-5 AO, as launch vehicles have been steadily decreasing in cost with the release of the NF-4 AO. The AXE spacecraft was also designed with the Next Generation Radioactive Power System (RPS) in mind, which would incur a cost of $70M, resulting in a total launch system cost of $92M.
Table 5. Work Breakdown Structure (WBS) Elements, Their Life Cycle Costs, and Their Methods of Estimation
| WBS | Full Life Cycle Cost (FY22, Phases A–D) | Method of Estimation |
|---|---|---|
| 1 Project management | $40.6M | Estimated from JPL ICM |
| 2 Project Systems Engineering | $23.7M | Estimated from JPL ICM |
| 3 Safety and Mission Assurance | $23.5M | Estimated from JPL ICM |
| 4 Science | $13.2M | Subsystem Estimated in JPL ICM |
| 5 Payload System | $70.3M | Subsystem Estimated in JPL ICM |
| 6 Spacecraft System | $297.1M | Subsystem Estimated in JPL ICM |
| 7 Mission Operations System | $24.7M | Subsystem Estimated in JPL ICM |
| 8 Launch System | $92M | $22 M High-performance 4 m fairing; $70 m next-gen RPS |
| 9 Ground System | $19.7M | Subsystem estimated in JPL ICM |
| 10 Project System I&T | $27.9M | Subsystem estimated in JPL ICM |
| Reserves | $165.4M | 30% JPL ICM |
| Total | $809.5M |
Download table as: ASCIITypeset image
Table 6. Total Estimated Cost for Phases A-F (FY22)
| Phase | Cost with Reserves | Cumulative |
|---|---|---|
| A | $7.2 M | $7.2 M |
| B | $64.6 M | $71.8 M |
| C/D | $645.7 M | $717.5 M |
| Launch/RPS | $92 M | $809.5 M |
| PIMMC | $809.5 M | |
| Cost Cap | $900 M | $90.5 M remaining |
| E/F (total proposed cost) | $341.3 M | $1150.8 M |
Download table as: ASCIITypeset image
6.2. Risk
Risk assessment was conducted in association with Team X using a standard risk assessment matrix (Table 7). The most significant risks identified through this study fall into two categories: those resulting from technology development needs and those resulting from impactable interplanetary particles present in the intended flight path. Here, we present mitigation strategies to retire these risks with margin. The highest-risk item identified during risk assessment (Item #1, Table 7) was the development required for the MAIAB instrument, as the current instrument analogue (QITMS) is currently at Technology Readiness Level (TRL) 6 as of this writing and has not yet been included in a planetary mission science payload. If MAIAB heritage does not work as expected during development, the mission could possibly be delayed; this was identified as a moderate likelihood and impact, although MAIAB is expected to be sufficiently developed for flight by the intended launch date. The proposed 21 day launch window would allow for days to weeks of slip with little to no impact on the mission; however, if multiple months of mission slip were to occur, the resulting C3 change could require changes in spacecraft design or the corresponding launch vehicle to accommodate the spacecraft.
Table 7. AXE Risk Mitigation Matrix
| Item # | Description of Risk | Likelihood and Impact | Mitigation Strategy |
|---|---|---|---|
| 1 | MAIAB instrument is TRL 6 but has never flown | 3,3 | (1) By launch, MAIAB is expected to be sufficiently developed for flight |
| MAIAB heritage does not work as expected during development; mission is delayed | (2) 21 day launch window allows for days to weeks of slip | ||
| (3) If months+ of mission slip, C3 change may require change to spacecraft design or launch vehicle | |||
| 2 | AXE flies through an active plume and is impacted by plume material | 2,2 | (1) Flythroughs scheduled to achieve other necessary science before taking this risk |
| (2) Calculations incorporating AXE's mass and velocity yield lower-energy impacts than incurred by Cassini, which successfully carried out multiple (20+) Enceladus plume flythroughs | |||
| (3) Multilayer insulation and inclusion of a Whipple shield would provide additional protection from micrometeorites | |||
| 3 | Sphinx heritage (TRL 6) does not work as expected during development; mission is delayed | 1,2 | (1) By the proposed launch date, Sphinx is expected to have TRL 9 heritage on flown cubesats |
| (2) See Item #1, Mitigation Strategies 2 and 3 | |||
| 4 | AXE flies through the rings of Saturn to approach Enceladus and is impacted by ring material | 1,1 | (1) The proposed trajectory would have AXE pass through the gap between Saturn and the D ring, minimizing likelihood of impacts |
| (2) See Item #2, Mitigation Strategies 2 and 3 |
Note. Likelihood and impact are presented on a 1–5 scale, with 1 being the lowest likelihood and impact and 5 being the highest likelihood and impact.
Download table as: ASCIITypeset image
The second highest-risk item identified was potential damage to the spacecraft resulting from hypervelocity impacts of dust and grains onto the spacecraft during traversals through the Enceladus plume; this was identified as a mild likelihood and impact. Calculations incorporating the AXE spacecraft's mass and relative velocity yielded lower-energy impacts than those incurred during Cassini's flythroughs of the Enceladus plume, which previously established precedent for plume sampling without negatively impacting mission success. Multilayer insulation in the proposed spacecraft design, as well as the inclusion of a Whipple shield if necessary (Pai et al. 2022), would provide additional protection from micrometeorite and ice/dust grain impacts. The proposed mission architecture includes sufficient cost and mass margins to accommodate either option if necessary to retire this risk.
Two lower-likelihood risks were also identified. Similar to the risks associated with MAIAB instrument development, Sphinx technology demonstrations (presently at TRL 6) could not proceed as expected prior to launch, potentially delaying the mission's launch date. However, Sphinx is expected to achieve TRL 9 heritage through CubeSat flight missions in the near future. Similar to the risks associated with Enceladus plume flythrough, the AXE spacecraft would pass through the rings of Saturn during approach to Enceladus and could be impacted by ring material. The trajectory proposed herein would involve the spacecraft passing through the gap between Saturn and the D ring, however, which holds very little ring material and would therefore pose little risk to the spacecraft.
7. Team Organization and Structure
A major difference between the formation of the PSSS team structure and those of traditional mission proposal teams is that members were selected from a pool of applicants and assigned roles within the team not necessarily based on merit, but on interest as well. Six roles within the PSSS team structure, termed "Hex roles," (PI, proposal manager, capture lead, cost lead, project manager, and project systems engineer) were elected based on written statements of intent from team members interested in Hex roles; the remaining 12 mission roles were assigned based on interest and availability.
The PSSS team leadership structure, as designed, follows a hierarchical order; the elected Principal Investigator (PI) acts as the arbiter for the decisions made within the team, the other Hex leads support the PI in these endeavors, and the remaining members of the team contribute within their respective roles as needed. In practice, our group was more interested in lateral, cooperative leadership such that everyone felt that their opinion was taken into consideration and were heard when decisions were made. For example, major (and sometimes minor) decisions made within the team were often taken to a vote to determine the course of action taken. The leadership structure organically evolved to include a Deputy-PI and an additional "objective lead" for each science objective. This allowed those outside the traditional (PSSS) leadership roles to have the opportunity to contribute equally to the direction and focus of the mission concept. We found that evolving our leadership structure accordingly in response to the individual strengths of our team members greatly improved our PSSS experience.
8. Discussions
8.1. Mission Architecture Development and Constraints
In contrast to the multiyear timescales typically required to develop and mature New Frontiers class planetary science mission concepts, the mission concepts developed during the PSSS are done so through 10 weeks of instruction followed by a culminating week in which the mission architecture is developed, rapidly iterated upon, and finalized through three rigorous sessions with JPL's Advanced Project Design Team (Team X). After ruling out both an orbiter and landed mission architecture due to a combination of a high Δv required for SOI, planetary protection concerns, and no foreign contributions to offset cost, initial estimates of the cost for a multi-flyby architecture suggested that, although feasible, the mission concept exceeded the NF-5 cost cap. This prohibited the inclusion of instrument additions/modifications and required minor descopes to accommodate the increased cost (however, we show here that compelling science can still be achieved using only two instruments). Through multiple iterations of the proposed mission architecture exploring various trades to offset the increased mission cost, our final session with Team X resulted in a mission concept that closed at $809.5 M ($90.5 M under the NF-5 cost cap of $900 M). Unfortunately, due to the limited time allowed with Team X during the PSSS, further iterations to expand the mission's science capabilities with the remaining budget were not possible. Although further trade space was unable to be explored during the PSSS itself due to time constraints, the additional cost margin leftover could be utilized to enhance already existing instrument capabilities (see Section 3.2) and/or add an additional instrument to the spacecraft payload.
8.2. Expanding Imaging Science Capabilities
Taking into account that considerable cost and mass margin remained after the final mission design iteration with Team X, we explore the possible addition of Thermal Infrared (TIR) imaging capabilities to further increase the science return of the AXE mission while still potentially falling within the NF-5 cost cap. While the proposed high-resolution camera would be sufficient for high-resolution imaging of the vents populating the SPT, including periods in which the Saturn system is approaching southern winter (see Section 2.3), the addition of a TIR instrument would further supplement Objective 3 by providing additional data collection options to probe the physical structure of south polar vents. This would include assessing the relative contributions of open-crevasse boiling and point-source eruptions to the plume by measuring the temperature distribution surrounding them. In the crevasse boiling endmember case, the temperature along the vents is expected to be homogenized by water within the vent, while in the case of point-source eruptions, the ice temperatures are expected to reach local maxima near the point sources but be colder between the eruption sites along the vent (Kite & Rubin 2016). Thermal mapping of select regions of the surface of Enceladus could also aid in determining the heat flux conducted through the ice shell, allowing for the determination of heat flow, including the spatial distribution and variability of tidal stress and associated dissipation mechanisms. This would be measured as background heat in addition to what is predicted to be emitted by Enceladus as a blackbody; for Europa, this is predicted to be a 1–2 K difference (Hayne et al. 2017). Determining the global heat flow of Enceladus is a critical aspect of the proposed science investigations, and while not strictly necessary to adequately address Objective 2, the addition of a TIR instrument would allow a second method to calculate the heat flow of Enceladus and further determine whether the ocean is a permanent feature.
TIR instruments have enabled numerous science investigations upon previous planetary missions (Christensen et al. 1992, 2004; Paige et al. 2010; Christensen et al. 2018) and have been continuously selected for upcoming missions (Howell & Pappalardo 2020; Olkin et al. 2021). Although the AXE baseline mission concept did not include a TIR instrument, the review panel during the culminating week of the PSSS concluded that a TIR instrument would likely fit within mass and cost constraints. Although not strictly necessary to address the science objectives proposed herein, the science return of the AXE mission would be significantly enhanced with the addition of a TIR instrument while still potentially falling within the NF-5 cost cap.
8.3. Hypervelocity Sampling
Accomplishing Objective 1 would require multiple hypervelocity flybys through the Enceladus plume. Unfortunately, hypervelocity impacts of dust and grains within the plume onto the instrument's sample capture mechanisms during flythrough could impart enough kinetic energy to severely fragment the molecular contents of the material. Conveniently, for an impact ionization mass spectrometer, such as a SUDA instrument analogue (see Section 3.2), these impacts act as an ionization source, allowing the molecular contents of the sample to be detected using time-of-flight mass spectrometry. However, it is important to acknowledge that different flyby velocities may vary fragmentation patterns, which can influence data interpretation. If these velocities are too low, impact-induced ionization is too inefficient to provide an adequate mass spectrum of the sampled material; if flythrough velocities are too high, these impacts could ambiguate any potential evidence for biological activity or geochemical processing that could be present. With this in mind, it is important that plume flythrough velocities are selected such that both impact ionization is efficient and the integrity of any molecular compounds present is preserved. Recent theoretical (Jaramillo-Botero et al. 2021) and experimental (Klenner et al. 2019) work suggests that, to enable both efficient impact-induced ionization and the survival of any molecular biosignatures present, flythrough velocities should be limited to 4–6 km s−1. AXE spacecraft flybys, given our current mission architecture, are carried out at relative velocities between 4 and 6 km s−1, which would enable the successful ionization and detection of organics within the plume during sampling.
8.4. The Standard of Evidence
Pierre-Simon Laplace stated that "the weight of evidence for an extraordinary claim must be proportioned to its strangeness." This principle is at the core of the scientific method and holds especially true for a life-detection mission, as the detection of life outside of Earth for the first time represents civilization-level science. The science investigations presented herein would both directly search for potential biosignatures within the plume and carry out geophysical measurements necessary in providing context to any chemical biosignatures detected at Enceladus. However, it is important to be aware that no single chemical or geophysical measurement necessarily constitutes a positive detection for life; multiple supporting lines of evidence must be present to allow a biological conclusion to be drawn. Measurements of Enceladus' power output and the longevity of its ocean could confirm the presence of an ocean persistent over geologic timescales, dramatically increasing the ocean's habitability. Surface morphology of the tectonic fractures at the SPT would help elucidate the mechanisms by which the plume is formed, which has implications in our interpretations of ice grain measurements and of the habitability of the ocean from which the plume is sourced. Crater morphologies would allow us to identify the locations of any past plumes (if previously present), and ultimately if any sites other than the SPT have hosted high-energy habitats, which has implications in Enceladus' spatial and long-term habitability. Finally, evaluation of organic molecular distributions and isotopic fractionation at Enceladus would provide direct evidence of any biological activity if present. Despite the exciting information these measurements have the potential to provide, none of these single measurements alone (or any single measurement) would unambiguously confirm the detection of life. However, together, these measurements would synergistically provide a more compelling case for the existence or likelihood of any past or present life at Enceladus. Although a framework for drawing a biological conclusion and an itemized evaluation of the various permutations for the collection of biosignatures from the AXE investigation is outside the scope of this manuscript, the authors direct the reader to the Ladder of Life detection (Neveu et al. 2018) and the Europa Lander Science Definition Team Report (Hand et al. 2017) for a more detailed description of biosignature evaluation in various contexts.
9. Conclusions
The Cassini-Huygens mission completely transformed our understanding of the Saturn system, revealing many more exciting science questions to pursue. Enceladus represents a unique and enticing opportunity to sample the contents of a global, subsurface liquid water ocean laden with salts and organic compounds in situ through an orbiter or multi-flyby mission architecture, and was identified as a high-priority target for both New Frontiers and Flagship class missions in the 2023–2032 DS (National Academies of Sciences & Medicine 2022). Enceladus harbors the only confirmed and most well-studied habitable environment beyond Earth, and very likely harbors the ingredients required for life as we know it (Cable et al. 2021), representing what could be the best chance at discovering life beyond Earth in our solar system. In addition to directly searching for evidence of life, AXE would provide measurements that would increase our understanding of Enceladus surface and interior properties, chemistry, and the geophysical and hydrogeological processes from which they result, addressing a key objective of the 2018 NASA strategic plan. The science objectives of AXE are synergistic in nature, with life detection and overall habitability assessment as the unifying theme; these objectives would address four of the 10 2013–2022 DS priority science questions, addressing all three cross-cutting science themes listed therein, and address four of the 12 2023–2032 DS priority science questions as well. Despite the budgetary constraints associated with outer-planetary NF class missions, we show that compelling science at Enceladus can be achieved within the constraints of an NF-5 class budget using a modest instrument suite, demonstrating flexibility in future mission designs. In response to the many incredible discoveries made by Cassini, the next logical step in our search for life beyond Earth is a return mission to Enceladus.
Acknowledgments
This research was carried out in part at the Jet Propulsion Laboratory, California Institute of Technology, under a contract with the National Aeronautics and Space Administration (80NM0018D0004) © 2023. All rights reserved. We acknowledge PSSS Administrator Joyce Armijo, PSSS School Manager Leslie Lowes, JPL's Team X, and those who reviewed this proposal. The authors thank Morgan Cable for fruitful discussions regarding biosignature detection strategies and quantitative measurement requirements, Karl Mitchell for enlightening conversations on south polar vent dynamics, and Francis Nimmo for discussions on strategies for measuring the geophysical properties of Enceladus. We also thank the NASA HQ Science Mission Directorate and the NASA Planetary Science Division for providing continued financial support for JPL's PSSS. Finally, we thank the anonymous reviewers for their insightful and highly constructive comments on the manuscript. The cost information contained in this document is of a budgetary and planning nature and is intended for informational purposes only. It does not constitute a commitment on the part of JPL and/or Caltech. The information provided is pre-decisional and for planning and discussion purposes only.