


Abstract
The amount and distribution of water on the lunar surface are related to the input and production of water by solar wind and meteoroid bombardment, balanced by photodestruction and mobility across the surface. Using the Stratospheric Observatory for Infrared Astronomy (SOFIA), we imaged the 6.1 μm feature that uniquely traces molecular water, covering 1/4 of the lunar nearside surface south of −60° latitude with 5 km resolution on 2022 February 17 UTC. The water feature strength varies significantly across the region, being drier at +28° longitude to more wet (170 ppm) at −7° longitude, and also decreasing toward the pole. Significant local enhancements are found, associated with south-facing, high-altitude topographic features. This includes relatively high H2O concentrations in a "wet ridge" just north of the Curtius crater; the south-facing, northern, inner rims of the most prominent craters; the south face of the central peak of the Moretus crater; and permanently shadowed polar regions.

Original content from this work may be used under the terms of the Creative Commons Attribution 4.0 licence. Any further distribution of this work must maintain attribution to the author(s) and the title of the work, journal citation and DOI.
1. Introduction
The question of whether water is present on the Moon and how it might arise has long been a subject of debate (Arnold 1979; Crotts 2011). Most lunar rocks and minerals contain very little hydrogen (Albarède et al. 2015), though there are notable exceptions that are of high interest (McCubbin et al. 2015). The lunar surface is covered by regolith, a fragmental layer of debris formed by repeated meteorite impact (McKay et al. 1991), which is exposed to hydrogen from the space environment. The solar wind implants protons into the lunar surface, some of which can be retained as molecular hydrogen, hydroxyl, or molecular water (Zeller et al. 1966; Housley et al. 1973; Bradley et al. 2014). The Moon is also bombarded by water-bearing meteorites, asteroids, and comets, all of which contribute a portion of their water to the lunar environment (Watson et al. 1961; Arnold 1979). The hydrogen content of the lunar regolith outside the polar regions measured by orbital neutron spectroscopy is on the order of 100 μg g−1 (Lawrence et al. 2022), consistent with laboratory measurement of samples returned by the Apollo landing missions (Warren & Brandt 2008). Space-based and ground-based measurements show that the lunar surface exhibits absorption bands in the UV and at 3 μm from high-latitude, low-temperature regions (Pieters et al. 2009; Sunshine et al. 2009; Hendrix et al. 2019; Honniball et al. 2020; Chauhan et al. 2021; see the recent review by Lucey et al. 2022). At high latitudes the abundances of water or hydroxyl inferred from near-infrared measurements are consistent with the abundance of hydrogen estimated from orbital neutron measurements. But because both hydroxyl and water have strong absorption at these wavelengths, their relative abundances cannot be separated.
Water ice has been detected in permanently shadowed portions of the lunar polar regions that stay colder than 100 K (Paige et al. 2010). The Lunar Crater Observation and Sensing Satellite (LCROSS) mission impacted an expended rocket booster to excavate buried ice at the shadowed polar crater Cabeus, where they found evidence of ice in the ejecta at an abundance of several percent by weight (Colaprete et al. 2010). Indications from the neutron experiment on the Lunar Prospector showed that hydrogen is concentrated in polar regions (Lawrence et al. 2006). Near-infrared reflectance measurements from the Moon Mineralogy Mapper (M3) instrument on the Chandrayaan-1 spacecraft and UV observations by the Lunar Reconnaissance Orbiter (LRO) showed spectral features consistent with water ice in permanently shadowed portions of craters near the lunar poles (Hayne et al. 2015; Li et al. 2018).
Water ice rapidly sublimates at the temperatures of solid bodies 1 au from the Sun (Andreas 2007; Huebner & Mukherjee 2015), so it will not persist from the primordial material from which the Moon originated nor from an Earth–Moon separation event. Lunar volatiles, including hydroxyl, ice, and molecular water, are likely delivered by the solar wind, comets, or volcanism (Arnold 1979). By extension from the Moon, other airless bodies may contain exogenic water. The presence of water on Mercury (Butler et al. 1993; Lawrence et al. 2013) and Ceres (Küppers et al. 2014) shows how condensed volatiles can even exist relatively close to the Sun. Constraining the lunar water origin and survival will allow informed hypotheses about whether asteroids, dwarf planets, or exoplanets may have surficial H2O in permanently shadowed regions generated by surface depressions, resonantly locked orbits, and/or tilted rotation axes.
Water molecules were recently detected even on the sunlit surface of the Moon (Honniball et al. 2021, 2022), and this paper extends those results to present the first well-sampled, wide-area images of localized variations in water abundance. A 6.1 μm spectral feature uniquely detects H2O (as opposed to just the O–H bond) because it arises from an H–O–H bending mode that requires all three atoms of the molecule. This feature was detected at a sunlit region near the Clavius crater (Honniball et al. 2021) and has been confirmed over a larger area with more recent measurements (Honniball et al. 2022). In this work, we present the results for part of the southern polar region, in order to determine whether the 6.1 μm water feature correlates with other localized structures. The region near the lunar south pole is of high importance for future space exploration, with multiple spacecraft preparing to go there, including the soon-to-launch NASA Volatiles Investigating Polar Exploration Rover (VIPER) mission (Colaprete et al. 2020).
2. Observations
2.1. Observing Method
Observations were made on 2022 February 17 (07:57 to 10:07 UTC) using the Stratospheric Observatory for Infrared Astronomy (SOFIA; Young et al. 2012), which flew a 2.5 m effective aperture telescope just above the tropopause and 99.9% of terrestrial water vapor. The science instrument was the Faint Object infraRed CAmera for the SOFIA Telescope (FORCAST), with its 256 × 256 pixel SiAs short-wavelength camera (Herter et al. 2012). A 2 4 wide slit and grism dispersing element illuminated the detector with emission from the sky covering 5.1–8.0 μm in wavelength and 191'' in space. The secondary mirror oscillated between the target position and a reference position with an amplitude of 180'' every 0.4 s with a nearly square-wave pattern. The detector integrated signal when the secondary mirror directed the line of sight to the target, then again (with signal multiplied by −1) when the secondary mirror directed the line of sight to the sky reference. For each pointing, 8 s of on-source integration (and another 8 s off source) was used. The telescope was then moved 600'' away, off the southern edge of the Moon, and an identical observation was made. The basic observing sequence comprised tiles with eight such chop-nod observations, with the slit offset by its 24 width, to build a fully covered map tile of 19'' × 190''.
To calibrate systematic effects in the FORCAST spectra, water estimates are relative to standard reference sites. Results from M3 and ground-based observations (Li et al. 2018; Honniball et al. 2020) suggest that low-latitude, high-temperature locations should host the least amount of water, based on the intensity of the 3 μm water/hydroxyl feature. For this work we used reference sites in equatorial Mare Fecunditatis and Oceanus Procellarum. After each map tile, the reference field in Mare Fecunditatis was observed for five exposures. In the second half of the observations, an additional field with a low H2 abundance in Oceanus Procellarum was also observed, as an extra reference.
A nearby star was also observed after each map tile, as a pointing reference, in order to remove the drift of the telescope relative to its nominal pointing; this drift accrues over time when unguided observations, such as our lunar maps, are made. Nine adjacent sequences of tile+reference+star observations were performed, starting from the East, to cover the observed region fully. The first six tiles were observed from an altitude of 40,000 feet (12.2 km), then the aircraft climbed during the 7th tile, with tiles 8 and 9 at 43,000 feet (13.1 km).
2.2. Data Processing
All of the raw data were processed using the SOFIA/FORCAST pipeline in the software package "redux" (version 2.10.3), to obtain calibrated, spatially and spectrally rectified two-dimensional images for each chop-nod observation as is done for all archived SOFIA science observations (Herter et al. 2012; Clarke et al. 2015). The telluric features due to small amounts of water vapor above SOFIA were removed using an atmospheric transmission model generated using ATRAN (Lord 1992). The data processing that improves the telluric correction and calibration for these observations is described in detail by Arredondo (2023) and is summarized here. A suite of ATRAN models spanning the range of likely precipitable telluric water vapor was generated, then the model that best minimizes the telluric features in the spectra was applied. To remove the residual atmosphere and instrumental response further, we generated a correction image using reference observations: we averaged them together, then for each row (spectrum), a smooth function (second-order polynomial) was fitted and divided out. The resulting reference calibration image is unit normalized and includes residual atmospheric emission, evidenced by peaks at the location predicted by ATRAN (but with relative strengths different from the model), as well as an uncalibrated instrumental pixel-to-pixel flat-field response. The reference calibration spectral image also contains the average emissivity spectrum of Mare Fecunditatis.
We divided each on-target chop-nod observation by the reference calibration spectral image. The result comprises the surface brightness spectrum on that part of the Moon divided by the average emissivity spectrum of the reference. Thus, all of our measurements are relative to the reference, and the water features are the ratio of water features at the target site to any water features that may be present at the reference site. This means that if there is water at Mare Fecunditatis, we will underestimate the absolute amount of water at the target position. The lunar time of day at the reference was 16:15, and evidence from 3 μm OH+H2O observations suggests that while the lunar maria are themselves are drier than other places, there does tend to be hydration (though not necessarily molecular water) at that time of day. When observing other relatively dry areas, a zero or even negative spectral feature can be anticipated due to our calibration procedure, for regions that are as dry or drier than the reference. We analyzed the SOFIA Mare Fecunditatis observations using Oceanus Procellarum, where the lunar time of day was 09:05 and very likely dry (Honniball et al. 2020), as reference. There is no strong signal from water in Mare Fecunditatis relative to Oceanus Procellarum.
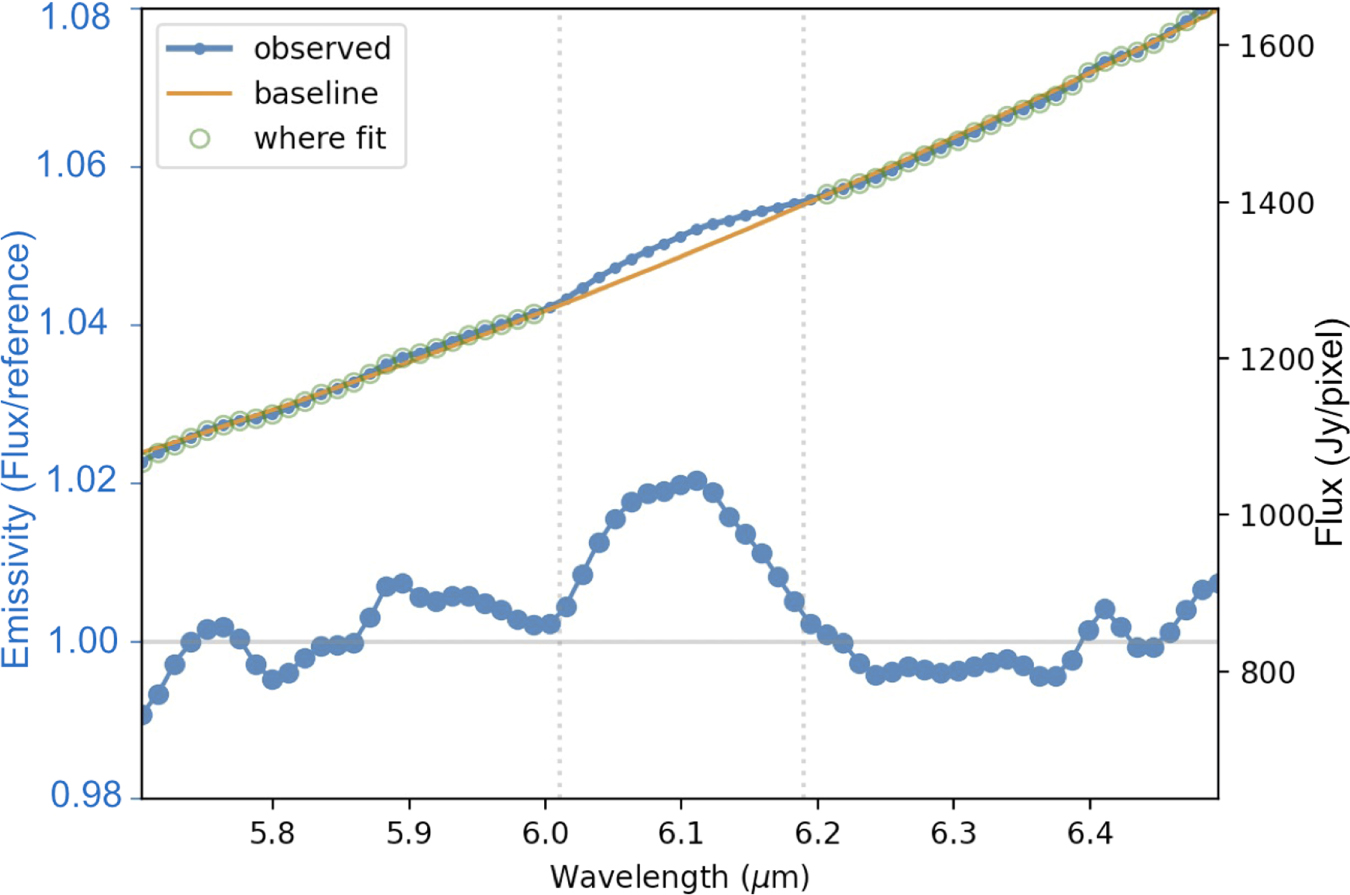
The calibrated and reference-corrected images were used to extract the 6.1 μm emissivity feature of H2O. A local second-order polynomial baseline was fitted to each of these spectra, from 5.7 to 6.5 μm (excluding ±0.1 μm centered on 6.1 μm); the spectra were then divided by this baseline. A first-order baseline generates an almost indistinguishable map of the integrated water strength, but the spectra with only a first-order baseline suffer from artifacts due to the inability to fit the curvature of the thermal continuum (Wien portion of the Planck function) over the fitting window, artificially suppressing the amplitude of the feature. Figure 1 shows a spectrum and baseline fit for an individual pixel of the spectral cube with a bright H2O feature. All spectra were combined to generate a spatial–spectral data cube, using the redux software (Clarke et al. 2015) and taking into account the relative lunar motion between ephemerides used at the telescope for each tile. We made cubes for the calibrated spectra, then for the reference-corrected spectra, and finally for the residual (baseline-removed) spectra. The cubes have 276 × 396 pixels of 0768 size, oversampling the 27 width of the spatial point response function measured for calibration stars, which allows for artifact-free image transformations.

Figure 1. Spectrum of the 6.1 μm line from a single pixel of the spectral cube. The upper curve with the small blue dots is the reference-corrected spectrum. The orange curve is the baseline fit, with the green circles indicating where the baseline was fitted. These curves use the right-hand flux scale. The lower curve with the large blue dots is the baseline-divided spectrum, and the vertical dotted gray lines show the wavelengths that were summed to generate the H2O image.
Download figure:
Standard image High-resolution imageFor the northern portions of the mapped region, surface features were readily visible in the SOFIA/FORCAST data, making their association with known features straightforward. In the near-polar, southern regions (in particular, south of −85° latitude), the sky-plane view is highly foreshortened. To map the data onto selenographic coordinates, we used the images taken with the guide camera throughout the period of observation. The sharpest of the guide camera images taken during each FORCAST exposure was compared to an LRO image with matching illumination for the observation time. Together with the known location of the FORCAST slit in the guide camera pixels, we determined the lunar coordinates of each pixel along the FORCAST grism slit, for each exposure in each tile. This mapping enables identification of features even close to the south pole.
3. Distribution of Water Emission in the Southern Hemisphere
Figure 2 shows a sky-plane H2O map for the observed region, which spans from the Moretus to Manzinus craters on the west and east, and from Curtius to the lunar limb (including the south pole) from north to south. The H2O feature is strong only in the western and northern portions of the field. The eastern half of the region has only weak H2O, with an apparent negative feature on the easternmost side. Recalling the reference scheme described above, this means that the eastern side of the observed region has less H2O than the Mare Fecunditatis reference, at the time of observation.

Figure 2. (a) LRO Wide Angle Camera image of the southern limb of the Moon, oriented with celestial pole at the top as appropriate for 2022 February 17, with a lunar coordinate grid overlaid and an outline of the region observed with SOFIA (blue lines). (b) Color rendition of SOFIA water and continuum emission. The color image combines the 6 μm continuum surface brightness (green) and the 6.1 μm water feature strength W (blue). The diagonal empty regions on the water image mask a defect on the surface of the detector that leads to significantly higher noise. (c) The 6 μm continuum surface brightness, together with a color bar in Jy pixel−1, for a pixel size of 0768. (d) The 6.1 μm integrated water band strength, W, defined in Equation (1).
Download figure:
Standard image High-resolution imageThe H2O emission is highest in the northwestern portion of the observed field, with distinct spatial structures. The spatial structure has some correspondence to lunar topography, but there is no one-to-one relationship. Most notable is a "wet ridge" that runs across the northern edge of the Curtius crater and extends well beyond it to the western edge of the map. Also notable is water around the rim of the Moretus crater. The water emission is just outside the bright crater seen in the continuum.
Figure 3 shows the H2O 6.1 μm feature strength along a slice running from the top to bottom of the map, beginning at a lunar longitude, latitude of −3°, −64° and ending at the lunar limb near −130°, −89°. The residual spectra were summed between 6.01 and 6.19 μm to generate integrated H2O band strengths for each spectrum. The dimensionless feature brightness was calculated from the observed spectrum, Fν , by summing the excess emissivity over the channels between 6.01 and 6.19 μm:

where Bν is the baseline continuum fit. The spectral channel width was 0.012 μm. Thus a 1% amplitude emissivity excess spanning 0.12 μm would have W = 0.1. An estimate of the water concentration (relative to the reference) can be made using an empirical calibration derived from observations of glass beads and radiative transfer modeling (Honniball et al. 2021), which yields water concentrations (in units of parts per million, or μg g−1) of approximately 900 × W. In this paper we use the purely empirical measure W, and we address trends rather than the absolute quantity of water. Using W can underestimate the water abundance if the spectral feature shifts in wavelength or is wide enough to spill out of the 6.01–6.19 μm sum. Inspecting the variations of the feature center and width, the summed wavelengths should include essentially all of the emission. Also note that W is a lower limit because the water feature from the reference position was removed in the calibration process.

Figure 3. Water profile through Moretus. The top panel, aligned with the lower panel along the horizontal axis, shows a two-dimensional spectrum from a single pointing of the spectrometer. The shades of blue indicate the emissivity, relative to the continuum fit, from 0.997 (no color) to 1.019 (dark blue). The thick, horizontal dark band is the 6.1 μm water feature. The lower panel shows spatial profiles of the 6.1 μm feature summed brightness W (blue) and the continuum (black). The profiles extend from the northernmost edge of Figure 2, just right of the left-hand edge, traversing several labeled features including the "wet ridge" of high H2O content, and the central peak of the Moretus crater. The spatial structures are significant local enhancements in H2O content, and they are superposed on a gradual trend that decreases from north to zero (immeasurably low) at the limb beyond the permanently shadowed crater Cabeus. In the top panel, the horizontal stripes are electronic artifacts on the detector triggered by saturated pixels, and the small white patch near 101'' offset and 6.08 μm wavelength is due to a defect on the detector surface (mentioned in the Figure 2 caption).
Download figure:
Standard image High-resolution imageThe 6.1 μm feature is strong in the northern part of the mapped region, with a gradual trend that decreases approaching the south pole. High-amplitude fluctuations are superposed in this trend variation, beginning with the "wet ridge," then the northern rim of Moretus, then a dip at the northern face of the Moretus central peak and a peak at the southern side of the Moretus central peak, then the southern rim of Moretus, both rims of the Short crater, then a decrease to near-zero values with peaks at the rims of the Newton and possibly Cabeus craters. The northern edges of the crater-related features in the H2O image are all shifted southward from the actual crater rims in the reflected light or in 6 μm continuum emission.
The central peak of Moretus also has a distinct water pattern, with emission on the southern face and a deficit of emission on the northern slope (Figure 4). The SOFIA observation was made near full Moon, so the center of solar illumination is north of the region. The H2O on the more-illuminated side is significantly decreased, while that of the shaded, southern face has a significant peak of H2O emission. This pattern is reminiscent of the well-known effect that the north face of a mountain in the northern hemisphere has more snow than the southern face. The surface temperature, measured by Diviner and compiled by Williams et al. (2017) at 15 km sampling, shows that the southern face of the Moretus central peak is anomalously cold. In particular, the duration of its heated day is much shorter than the surroundings. At three hours after noon in lunar time, the Diviner sample closest to the south face of Moretus central peak is already down to 177 K, in contrast to the sample 15 km away, where the temperature is still at its noon-time value (298 K). The significantly higher water abundance measured by SOFIA, faster cooling measured by Diviner, and reduced insolation evident from the LRO/LOLA altimetry all suggest the poleward, southern face of the central peak of Moretus is a distinct environment from its surroundings and worthy of further investigation.

Figure 4. Details of the water emission at Moretus. These SOFIA images of 6.1 μm H2O emission (left) and 6 μm continuum (center) are centered on the Moretus crater. The visible-light image (right) is from Change 2, using the Virtual Lunar Atlas (Chevalley & Legrand 2023), at approximately the same illumination conditions (by coincidence). The purple asterisk indicates the top of the central peak in the crater, and the purple arcs are guides to the locations of the north and south rims. These same markers are copied over to the left-hand panel. Both the rims and the central peak are shifted southward in the H2O image compared to the continuum image, consistent with a higher H2O abundance on the sides of topographic features that are less illuminated.
Download figure:
Standard image High-resolution image4. Distribution of Water Emission Near the South Pole
On the date of the SOFIA observation, the lunar south pole and a small portion of the far side were visible from Earth. To show the distribution of water closer to the south pole, Figure 5 shows an orthographic projection. Significant local concentrations of water emission follow the northern rim of Cabeus, the center of Haworth, and the southern rim of Nobile. Compared to the trends seen at higher latitudes, the Cabeus northern rim is consistent with what was seen at Curtius, Moretus, and other craters. The Cabeus and Haworth craters contain permanently shadowed regions (Cisneros et al. 2018) and include evidence of water ice, notably Cabeus from the LCROSS impact (Colaprete et al. 2010), so the near-polar craters may have larger regions that are amenable to procuring and/or retaining molecular water (Farrell et al. 2015). The molecular water emission closely follows the location of shadows in the LRO image, even though the truly shadowed regions are too cold to contribute significantly to the mid-infrared FORCAST images. The strong peak of molecular water on the southern rim of Nobile may be of interest to inform the VIPER rover (Colaprete et al. 2020), which is set to explore that region in late 2024. The details of the distribution of 6.1 μm water emission and its relation to the shadowed regions requires a detailed study, taking into account the effects of local topography and highly oblique viewing that control which surfaces are actually seen in the SOFIA observations.

Figure 5. Distribution of water near the lunar south pole. (a) In false color, a stereographic projection of the 6.1 μm H2O emission. (b) In grayscale, an LRO image of the exact same area. The longitude 0° and 90° meridians are shown in both panels, and latitude circles are labeled panel (b). The pixels in the SOFIA image are elongated due to reprojection from the foreshortened, Earth-centered view of the pole, which was close to the lunar limb but just visible at the time of the SOFIA observation. Arcs (gray in panel (a) and purple in panel (b)) delineate some of the water emission features. Particularly noteworthy in this projection is bright water emission from just inside the northern rims of Cabeus and Haworth. The water emission appears to be from the crater floors just at the inner base of the northern rims; this also occurs at Shomberger.
Download figure:
Standard image High-resolution image
5. Discussion of the Potential Relation to the Source of the Lunar Water
The lunar south polar region, from Curtius to Manzinus and down to the south pole, shows a significant 6.1 μm emissivity feature that is uniquely associated with H2O based on its central wavelength and width. The presence of the feature confirms the prior detections in this region of the Moon (Honniball et al. 2021), and the large-scale contiguous mapping now shows systematic spatial variations associated with lunar surface features.
An overall trend of decreasing H2O toward the south pole is seen in the data. This trend can be compared to prior observations, taken at somewhat different locations and lunar times of day. Honniball et al. (2021) showed the water feature was stronger (W ∼ 0.4) at latitude −75° and decreased to a plateau (W ∼ 0.2) at latitude −55°; the range of values is similar to what is seen in the map reported here, but the trend versus latitude is different. Honniball et al. (2022) showed in a larger regional map that the water feature was stronger (W ∼ 0.3) for the higher-flux surface at latitudes around −60° and decreased (to W ∼ 0.1) toward the lower-flux surface at latitudes around −80°. The latitude trends from the limited prior observations are different from the the trend derived from the new data reported here, but the prior observations did not go to the pole and covered different longitudes. The different latitude trends could be due to local differences due to different parts of the lunar surface that were sampled, or due to the different lunar times. The subsolar longitude was −12° for the observations presented in this paper, compared to +21° for the prior regional map (Honniball et al. 2022); at the Moretus crater, that means the lunar time of day was just 0.4 hr after noon for the new observations and 1.8 hr before noon for the prior regional map. It is possible that the lunar time of day plays a significant role in the mobility of water at high latitudes. Further observations with SOFIA were performed of both the southern and northern polar regions, which will allow this issue to be studied in more detail in the future. A decreasing trend with latitude could potentially be related to the lower flux of solar wind and meteoroids that contribute to lunar hydration (Klima & Petro 2017). The solar wind flux has a cosine-of-latitude variation, with relatively little reaching the pole. The meteoroid influx on the Moon is of order 2 tons/day mostly from Jupiter-family comets (Carrillo-Sánchez et al. 2020), which could coat the entire surface of the Moon with a depth of 7 cm if spread uniformly with a volume averaged mass density of 1 g cm−3 over 4 Gyr. The influx of sporadic meteoroids has a helion source of small particles (β-meteoroids) moving radially outward from the Sun, but most of the mass flux is in the apex/antapex sources, due to larger particles on elliptical orbits arising from comets and asteroids (Wiegert et al. 2009; Pokorný et al. 2014). A tenuous lunar dust atmosphere driven by meteoroid bombardment has been associated with the apex source (Szalay & Horányi 2015). Both solar wind implantation and sporadic meteoroid bombardment provide a source function for water onto the Moon that should decrease toward the poles. That trend is consistent with the decrease in 6.1 μm H2O we see in the SOFIA observations presented in this paper, which must be noted as covering only a fraction of the lunar surface. The trend is opposite from the equator-to-pole OH+H2O trend seen with M3 (Li et al. 2018), but it only covers a limited latitude range. Meteoroid streams associated with individual comets on inclined orbits (Brown et al. 2008) give rise to significant increases when the Moon traverses them, which would contribute cometary water input at higher latitudes. Indeed, the existence of water produced by impacts from meteoroids in known streams was discovered by LADEE, though it can be interpreted as preexisting lunar water liberated by the impacts rather than exogenic delivery (Benna et al. 2019). Analysis of the LCROSS plume indicates a cometary origin for the volatiles in the permanently shadowed region of Cabeus (Mandt et al. 2022), where we also detect water with SOFIA. Further SOFIA observations covering a wider range of latitudes are being analyzed and will address latitude variations as well as localized emission in the 6 μm feature.
6. Conclusions
The presence of significant small-scale variation in water content associated with topographic features (Figure 2), with amplitude comparable to an underlying smooth latitude variation (Figure 3), shows that local processes on the lunar surface (at least partially to topography) control the distribution of water as much as any exogenic input. The systematic shift of water distribution away from solar illumination shows that the water has higher abundance just south of the topographic maxima. As the mapped region is in the far southern hemisphere, the shift is consistent with more water in the more-shadowed regions hidden for longer portions of the day by local topographic maxima. Figure 4 shows that the exposed, inner side of the southern rim of Moretus has a weak water signal. The shadowed, outer part of the southern crater rim (which rises 2.1 km above the mean surface and is much higher than the northern rim, which rises only 1.1 km) has a relatively high water abundance. Similarly, there is a water signal associated with the northern rim, from the shadowed, inner side of that rim.
A distinct H2O emission pattern appears near the Moretus central peak (Figure 4). Both the northern and southern faces of the Moretus central peak have extensive steep (60°) slopes (Barker et al. 2016), extending vertically to 2.5 km above the crater floor. The base of the central peak has a size comparable to the physical resolution of the data (4.5 km), and the elongated shape is consistent with foreshortening of the crater at −70° latitude. This means that some of the spatial variation is smoothed out by the observing technique. Nonetheless the data reveal a clear excess of H2O on the southern face as well as a clear deficit (relative to the surroundings) in H2O on the northern face of the central peak. The excess emission is likely related to insolation, which is only for a much shorter portion of the lunar day on the southern side. The decrease of water on the northern side of the central peak, below the water level at the floor of the crater, indicates that the steep northern slopes lose their water at a significantly higher rate, due to their long exposure to sunlight each lunar day. The steep slopes of the central peak could also lead to different regolith properties and depth, but the strong distinction between water on the north and south sides suggests that insolation is a more significant effect in controlling the water distribution.
The presence of localized enhancements in water abundance may support the hypothesis that at least part of the water produced by solar wind and meteoroid bombardment on the lunar surface may subsequently migrate toward the poles (Schorghofer et al. 2017; Hendrix et al. 2019), that localized topography and roughness may play a role in water retention on the lunar surface (Davidsson & Hosseini 2021), and that colder portions of the polar regions may retain water even if not permanently shadowed (Kloos et al. 2019; Hayne et al. 2021). Both the observations from Deep Impact (Sunshine et al. 2009; Laferriere et al. 2022) and SOFIA show higher H2O abundances where the surface is locally colder, and where migrating water may collect in cold traps and be reduced at high temperature on a diurnal cycle. The observational results presented in this paper pertain to the distribution of water traced by the 6.1 μm emissivity feature, which arise from water molecules very near the surface but could trace a more pervasive source. In addition to the localized enhancements of H2O in colder regions that are detailed in this paper, there remains widespread H2O seen as a 6.1 μm emissivity peak (Honniball et al. 2022) and OH+H2O seen as a 3 μm reflectivity dip (Wöhler et al. 2017) across the lunar surface, which may arise from extensive amounts of water in glasses or minerals.
This work is based in part on observations made with the NASA/DLR Stratospheric Observatory for Infrared Astronomy (SOFIA). SOFIA was jointly operated by the Universities Space Research Association, Inc. (USRA), under NASA contract NNA17BF53C, and the Deutsches SOFIA Institut (DSI) under DLR contract 50 OK 0901 to the University of Stuttgart. Financial support for the observational and theoretical work in this paper was provided by NASA through award #09_0171 issued by USRA.
Facility: SOFIA - Stratospheric Observatory For Infrared Astronomy.
Software: Virtual Moon Atlas (Chevalley & Legrand 2023), Lunar QuickMap (Malaret et al. 2022), astropy (Astropy Collaboration et al. 2022), matplotlib (Hunter 2007).