


Abstract
We present the first observations of in situ electron acceleration at corotating interaction region (CIR) shocks near 1 au, utilizing measurements from Wind and Magnetospheric Multiscale (MMS) mission in the interplanetary medium. As the forward (reverse) shock of the 2018 January CIR (the 2020 February CIR) moves from Wind at [206, 92, −7]RE ([257, 25, 3]RE) to MMS1 at [24, 2, 7]RE ([25, 3, 0.5]RE), the shock's thickness becomes 8 (3) times thinner, but the convective electric field Edrift gets weaker (stronger) along the shock; both the upstream and shocked suprathermal electrons exhibit a flatter flux energy spectrum, while the electron shock acceleration becomes less (more) significant. For the shocked suprathermal electrons with significant flux enhancement, the flux ratio across the shock appears to peak in the direction perpendicular to the magnetic field. Therefore, the CIR shock acceleration of solar wind suprathermal electrons at 1 au exhibits an efficiency increasing with the Edrift strength. These results also suggest that such acceleration through the interplanetary medium can contribute to the formation of solar wind suprathermal electrons.
Export citation and abstract BibTeX RIS

Original content from this work may be used under the terms of the Creative Commons Attribution 4.0 licence. Any further distribution of this work must maintain attribution to the author(s) and the title of the work, journal citation and DOI.
1. Introduction
The solar wind suprathermal electrons near 1 au consist of a halo/strahl population at ∼0.1–2 keV and a superhalo population at energies above ∼2 keV (e.g., Pilipp et al. 1987; Wang et al. 2012). The strahl/halo electron populations can be described by a kappa distribution (Maksimovic et al. 1997; Štverák et al. 2009; Tao et al. 2021), while the superhalo population is generally characterized by a power-law distribution (e.g., Wang et al. 2012; Wang 2022). Shock acceleration can be one important interplanetary source of these suprathermal electrons (Yang et al. 2019; Liu et al. 2020a).
However, the shock electron acceleration process is not fully understood yet. Many theoretical studies have proposed two major shock acceleration mechanisms (e.g., Kallenrode 2004; Qin et al. 2018): shock drift acceleration (SDA) and first-order-Fermi shock acceleration (FFA), respectively, which are thought to be more efficient at quasi-perpendicular and quasi-parallel shock geometries. In SDA, charged particles are energized through the gradient drift along the convective electric field, E drift = − U × B , at the shock surface for both particle reflection and transmission. In FFA, charged particles gain energy via multiple reflections/scatterings between converging upstream and downstream waves (e.g., Drury 1983; Desai & Giacalone 2016). In a steady state, the classical FFA theory predicts a power-law energy function of accelerated particle differential fluxes, J ∝ ε−β , with a power-law index of β = (r + 2)/(2r − 2) depending only on the shock density compression ratio, r.
For interplanetary coronal mass ejection–driven shocks at 1 au, Yang et al. (2019) reported that the observed suprathermal electron flux ratio between the downstream and ambient solar wind, JD /JA , ranges from ∼1 to 20 with a significant enhancement (JD /JA > 1.5) rate of 55% (100%) at ∼1.5 keV. And for the terrestrial bow shock at 1 au, Liu et al. (2022) reported that the observed suprathermal electron flux ratio between the downstream and ambient solar wind, JD /JA , ranges from ∼10 to 3000 with a significant enhancement (JD /JA > 1.5) rate of 100% at ∼1.5 keV. For both shock types, the significantly enhanced JD /JA ratio shows a positive correlation with the magnetic compression ratio rB , and it peaks in the direction perpendicular to the interplanetary magnetic field (IMF). Moreover, the observed power-law spectrum of significantly shocked suprathermal electrons is much steeper than the FFA theoretical prediction (Gosling et al. 1989; Oka et al. 2006; Yang et al. 2018; Liu et al. 2020a). These results suggest that the SDA process likely dominates the electron acceleration at these shocks.
The shocks at the edges of corotating interaction regions (CIRs), formed by high-speed solar wind overtaking low-speed solar wind, are another important shock type in the interplanetary medium (IPM). Ulysses's observations beyond 3 au showed that the reverse shock is a more effective source of energetic electrons than the forward shock for the long-lived CIRs (Simnett & Roelof 1985; Kunow et al. 1999; Simnett 2017). For the first time, we investigate the evolution of in situ suprathermal electron acceleration at CIR shocks near 1 au, utilizing measurements by Wind and Magnetospheric Multiscale (MMS) mission.
2. Observations
Since mid-May in 2004, the Wind spacecraft has remained in a halo orbit around the first Sun–Earth Lagrange point (Wang 2009). In the Wind onboard 3D Plasma and Energetic Particle instrument (Lin et al. 1995), electron electrostatic analyzers (EESA-L and EESA-H) detect ∼3 eV–30 keV electrons, and silicon semiconductor telescopes (SSTs) measure ∼25–400 keV electrons. The observed three-dimensional electron distributions from EESA and SST are binned into eight pitch-angle (PA) bins with a 22.5° angular resolution (Wang 2009), according to the IMF direction measured by the Wind onboard Magnetic Field Investigation instrument (Lepping et al. 1995).
Since their launch in 2015 March, the MMS (MMS1, MMS2, MMS3, and MMS4) spacecraft have been put into a highly elliptical orbit around the Earth with an apogee of ≳12 RE . The Fast Plasma Investigation (FPI; Pollock et al. 2016) detects the electrons at 10 eV–30 keV, while the Fly's Eye Energetic Particle Spectrometer (FEEPS; Blake et al. 2016) measures the electrons at 25–650 keV. The observed three-dimensional electron data from FPI and FEEPS are binned into 16 pitch-angle (PA) bins with an 11.25° angular resolution according to the direction of the magnetic field (Torbert et al. 2016). Here we only utilize the MMS1 measurements since the four MMS spacecraft are separated only by ∼10 km (that is smaller than the spatial scale of CIR shocks near 1 au).
After searching through the measurements from 2015 September to 2020 December, we select two CIR cases with a clear shock structure and good suprathermal electron data at no less than seven energy channels, respectively in 2018 January (Figures 1–2) and 2020 February (Figures 3–4), detected both by Wind and MMS1 in the IPM. Here we identity the electrons with a flux intensity at least 5 times higher than the thermal Maxwellian distribution (that is determined by the measured electron density and temperature of solar wind plasma; see Figure 2(a)) as suprathermal electrons, after excluding the electron measurements dominated by the instrument background/noise (Liu et al. 2020a).

Figure 1. The CIR # 1 measured by the Wind ((a)–(c)) and MMS1 ((d)–(h)) spacecraft from 2018 January 8 to 9. Wind measurements: (a) omnidirectional electron fluxes at 18 eV–66 keV; (b) electron PA distributions at 427 eV, normalized by the PA-average flux for each time bin; (c) IMF magnitude (black) and solar wind speed VSW (blue). The vertical orange line indicates the SI that is determined by a sudden decrease in solar wind density NSW and increase in VSW (Wimmer-Schweingruber 1997; Jian et al. 2006; Tao et al. 2021). MMS1 measurements: (d) omnidirectional electron fluxes at 12 eV–439 eV; (e) NSW; (f) VSW; (g) electron PA distributions at 312 eV, normalized by the PA-average flux for each time bin; (h) IMF magnitude. In panels ((a)–(c)) ((d)–(h)), the vertical solid and dashed black lines indicate the arrivals of forward and reverse shock at Wind (MMS1), respectively. (i) The positions of Wind and MMS1 in GSE coordinates at the arrival of CIR shocks. The circle marks the Earth's location, while the gray surface indicates the best single-surface fitting bow-shock model (Jerab et al. 2004). The purple (black) plane represents the surface of the forward (reverse) shock with an arrow indicating the fitted-shock normal  .
.
Download figure:
Standard image High-resolution image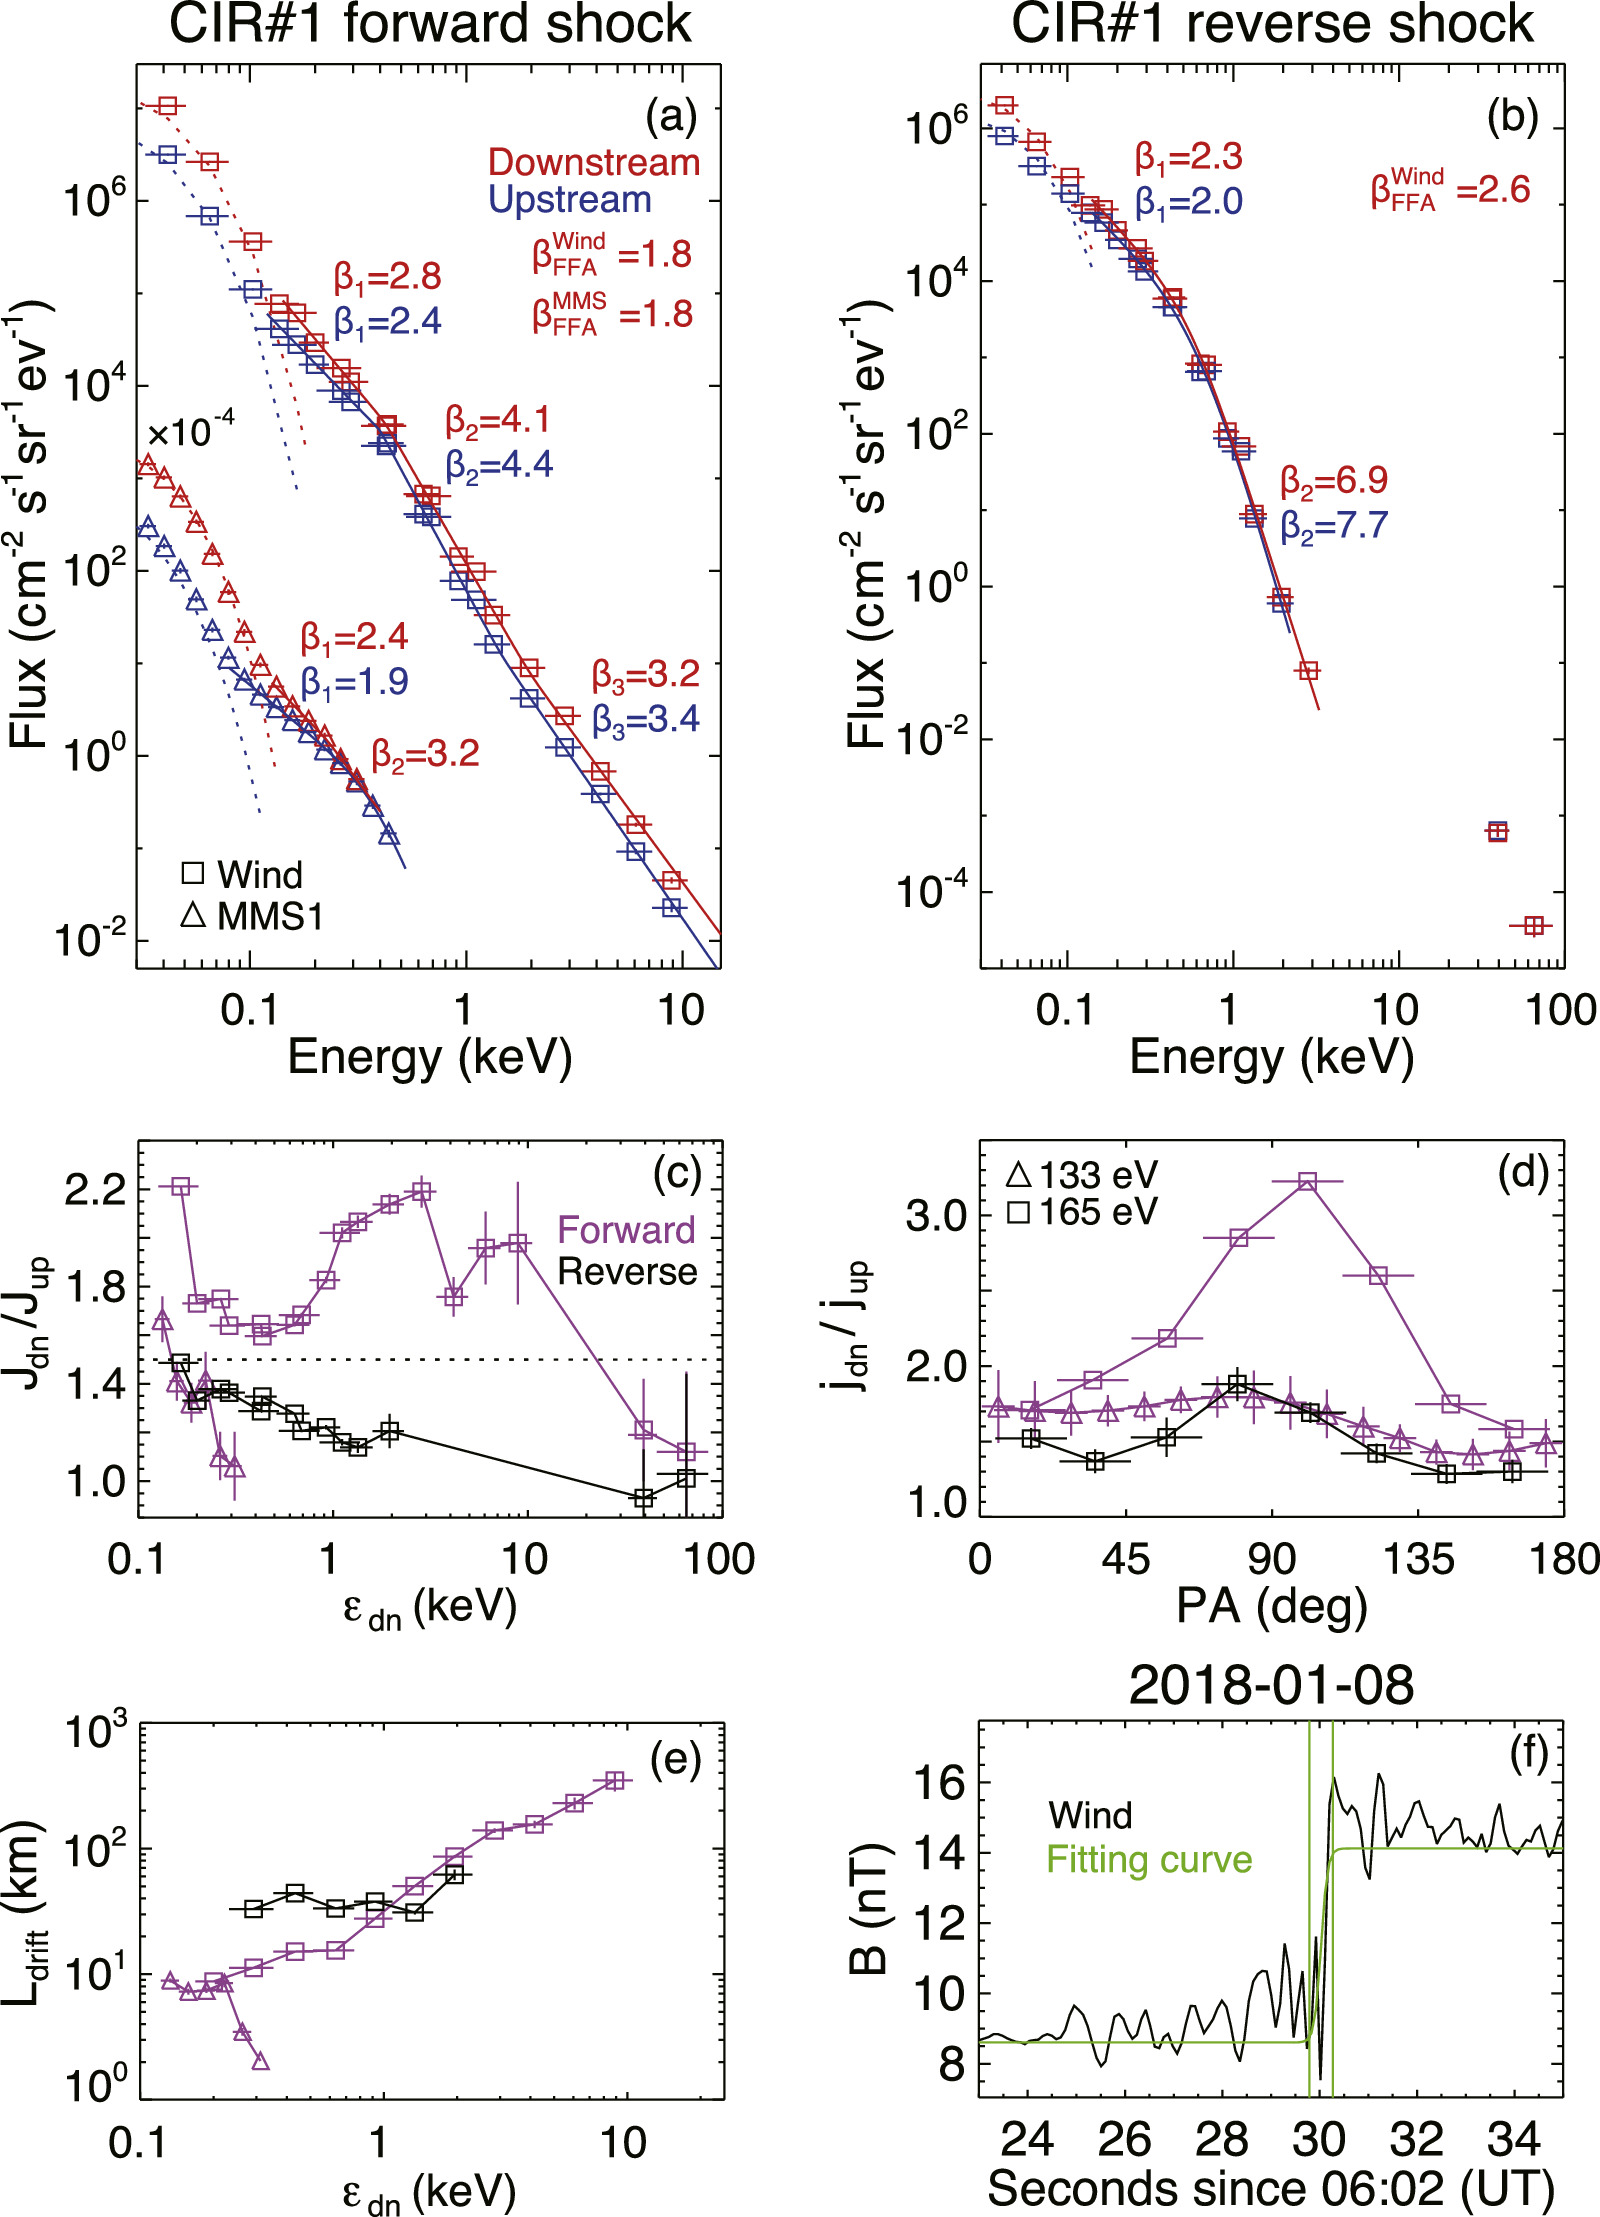
Figure 2. The upstream (blue) and downstream/shocked (red) electrons measured by Wind (squares) and MMS1 (triangles) near the CIR #1 forward and reverse shock. ((a)–(b)) Omnidirectional electron flux vs. energy spectra for the forward shock and reverse shock. The dotted lines show the thermal Maxwellian distribution that is estimated from the observed solar wind electron density and temperature. The solid lines represent the best fit from the (extended) pan-spectrum fitting. (c) The omnidirectional  ratio vs. the downstream electron energy
  . (d) The
  ratio vs. PA at 165 eV by Wind (at 133 eV by MMS1). (e) The estimated Ldrift vs.
  . In panels ((c)–(e)), the purple (black) color indicates the forward (reverse) shock. (f) The temporal profile of IMF magnitude measured by Wind. The green curve shows the best fit for the tanh function. The green vertical lines show the time at which
  equals
  . And time between the two vertical lines is the duration time Δt of the ramp.
Download figure:
Standard image High-resolution image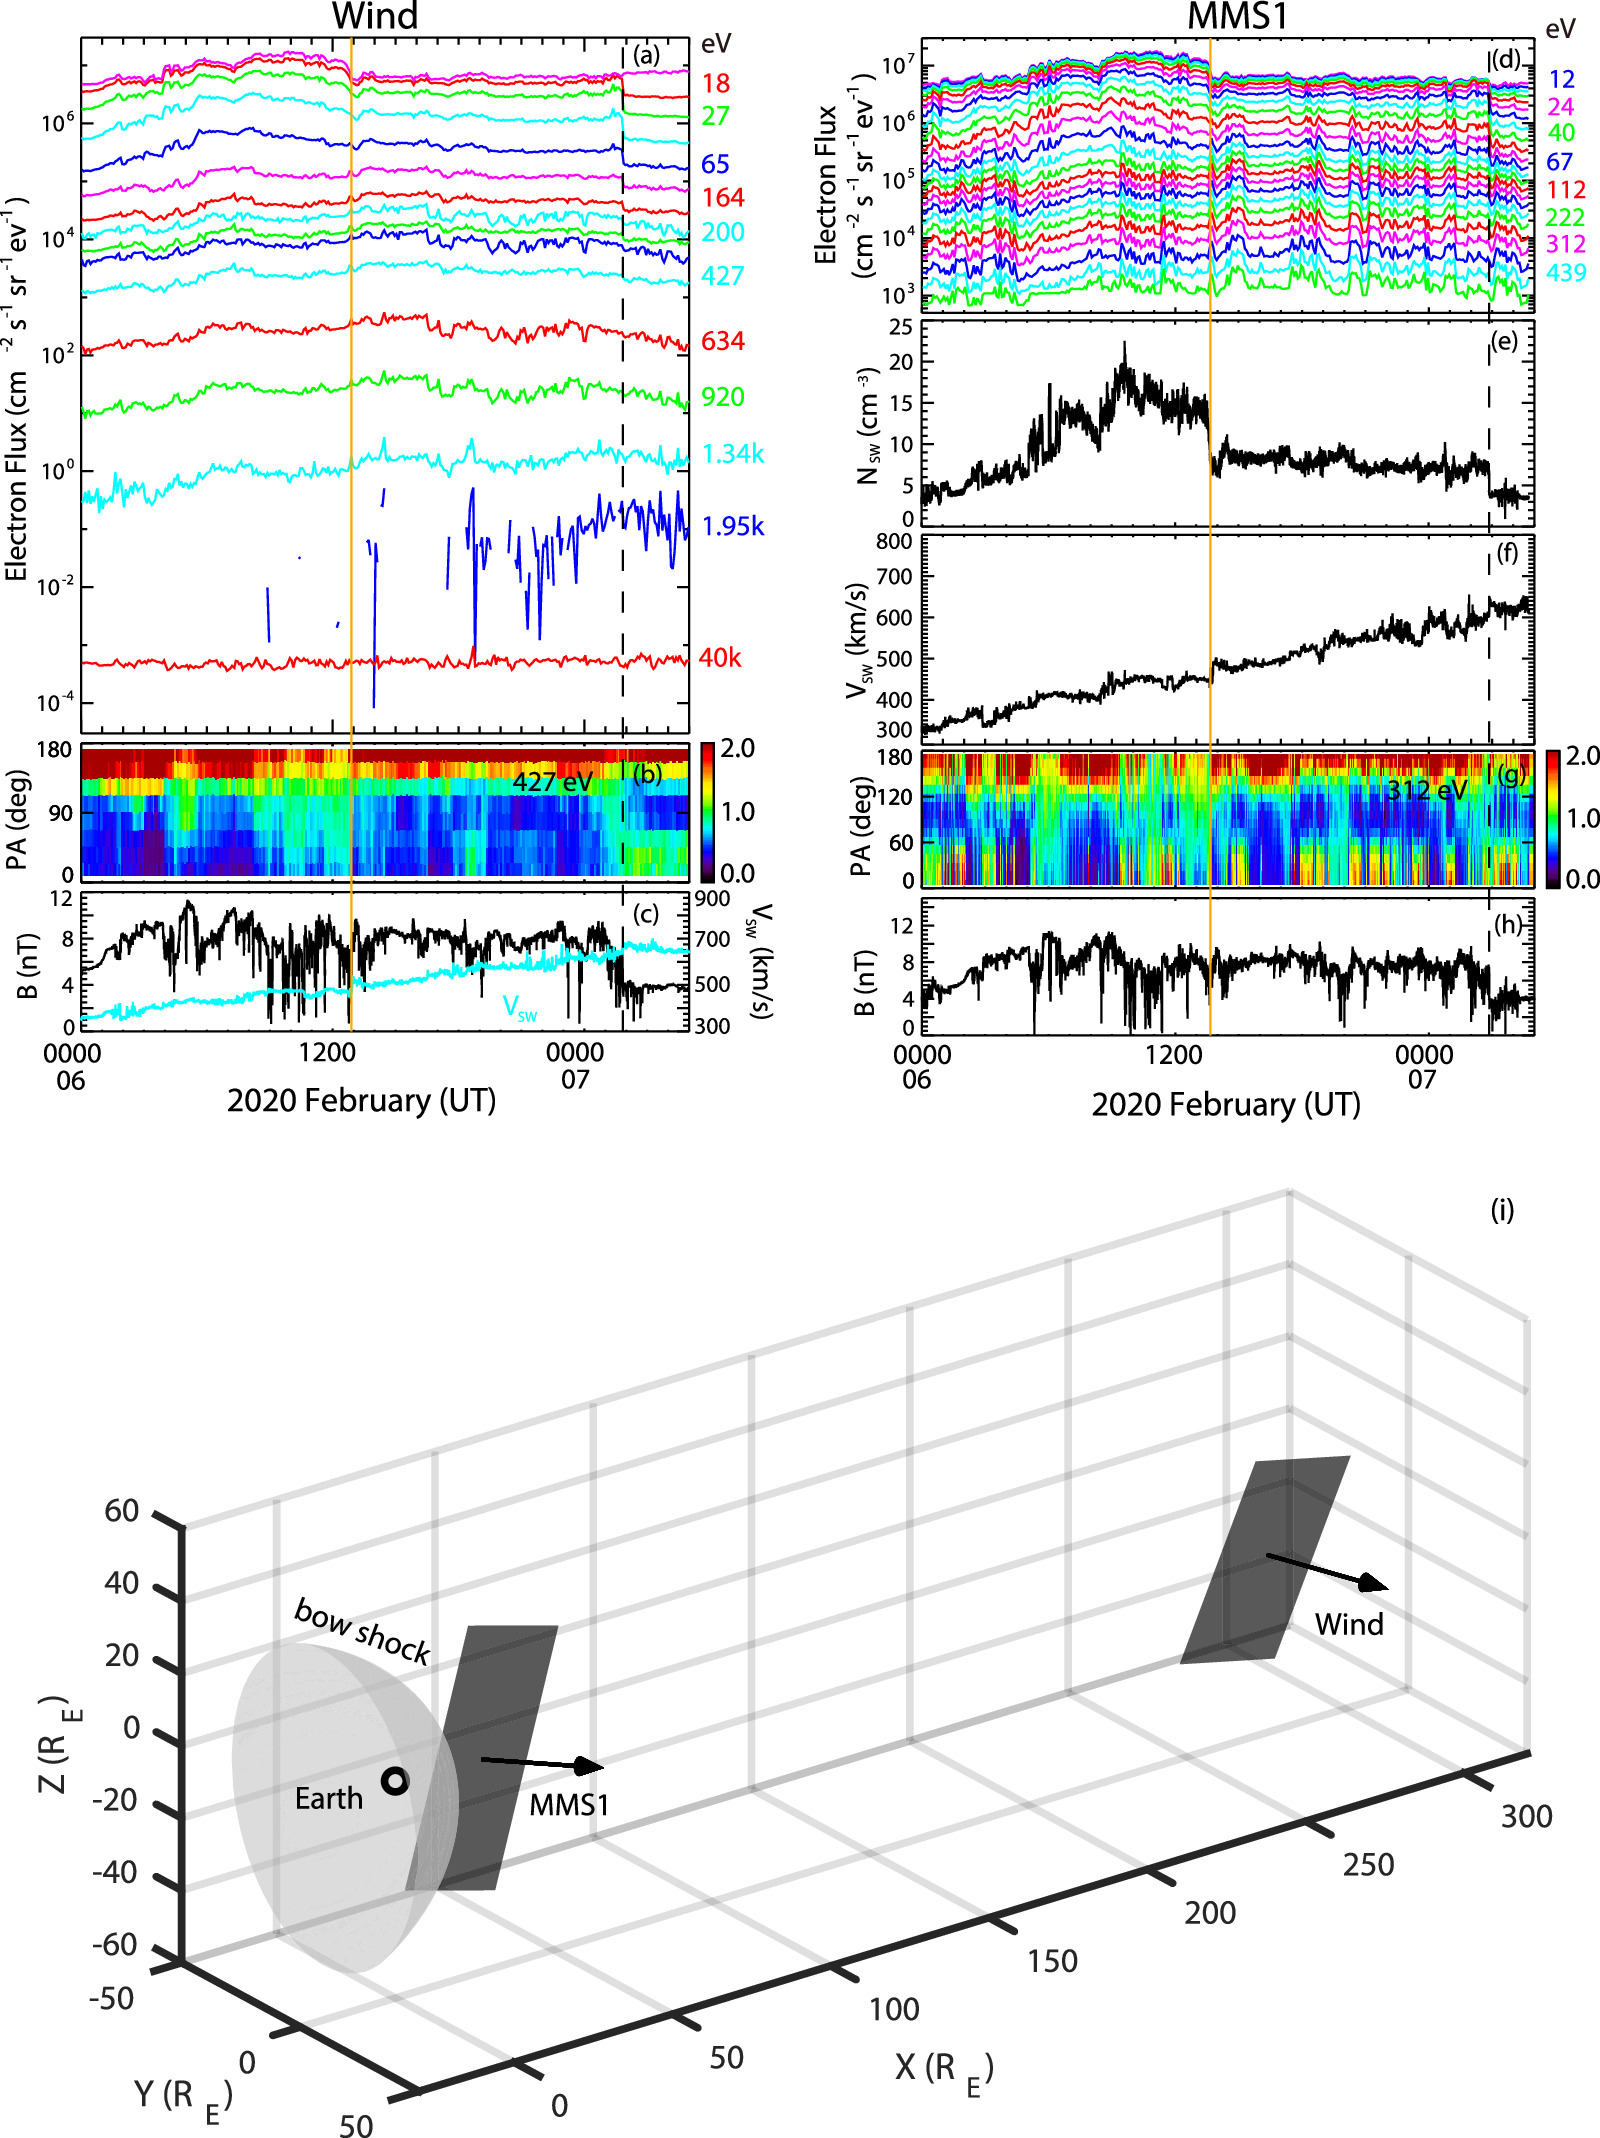
Figure 3. The CIR #2 measured by the Wind ((a)–(c)) and MMS1 ((d)–(h)) spacecraft from 2020 February 6 to 7. Same legend as Figure 1.
Download figure:
Standard image High-resolution image
Figure 4. The upstream (blue) and downstream/shocked (red) electrons measured by Wind (squares) and MMS1 (triangles) near the CIR #2 reverse shock. ((a)–(c)) Same legend as panels ((b)–(d)) of Figure 2. (d) The temporal profile of IMF magnitude measured by MMS1. The green curve shows the best fit for the tanh function.
Download figure:
Standard image High-resolution image
For both CIR cases, we apply the nonlinear least-square shock-fitting techniques (Koval & Szabo 2008; Liu et al. 2022) to obtain the shock parameters: the shock normal  , shock speed Vsh, angle θBn between the shock normal and upstream IMF, fast magnetosonic Mach number Mf
, r, and rB
, as well as the average magnetic field magnitude Bup (solar wind velocity
U
up) in upstream and Bdn (
, shock speed Vsh, angle θBn between the shock normal and upstream IMF, fast magnetosonic Mach number Mf
, r, and rB
, as well as the average magnetic field magnitude Bup (solar wind velocity
U
up) in upstream and Bdn ( ) in downstream. The convective electric field at the shock surface is calculated as
 ![${{\boldsymbol{E}}}_{\mathrm{drift}}=-[({{\boldsymbol{U}}}_{\mathrm{up}}-{V}_{\mathrm{sh}}\hat{n})\times {{\boldsymbol{B}}}_{\mathrm{up}}+({{\boldsymbol{U}}}_{\mathrm{dn}}-{V}_{\mathrm{sh}}\hat{n})\times {{\boldsymbol{B}}}_{\mathrm{dn}}]/2$](https://content.cld.iop.org/journals/2041-8205/966/1/L12/revision1/apjlad3d5fieqn10.gif) (Liu et al. 2020a; Wilson et al. 2021). Afterward, we fit the observed temporal profile of magnetic field magnitude around the shock to a formula of
(Liu et al. 2020a; Wilson et al. 2021). Afterward, we fit the observed temporal profile of magnetic field magnitude around the shock to a formula of  (Bale et al. 2003), where
  and
and  . The time derivative of
  can be given as
 ![$\dot{\tilde{B}}(t)=| {B}_{2}| /(\phi {\cosh }^{2}\,[(t-{t}_{0})/\phi ])$](https://content.cld.iop.org/journals/2041-8205/966/1/L12/revision1/apjlad3d5fieqn15.gif) , with the maximum occurring at t0. Then we estimate the thickness of the shock's ramp as
, with the maximum occurring at t0. Then we estimate the thickness of the shock's ramp as  (Liu et al. 2022), where
V
sc is the spacecraft velocity. In this study, the ramp's duration time Δt is defined as the time interval when
(Liu et al. 2022), where
V
sc is the spacecraft velocity. In this study, the ramp's duration time Δt is defined as the time interval when  is greater than
  (Figure 2(f) and Figure 4(e)), i.e.,
  .
.
For suprathermal electrons observed at no less than ten energy channels, we can fit their omnidirectional flux J to an extended pan-spectrum formula (Li et al. 2023, 2024):
where ε is the electron energy, α1 (α2) describes the sharpness and width of low-energy (high-energy) transition with a center energy at ε1 (ε2), β1 (β3) is the power-law index at energies below (above) the low-energy (high-energy) spectral transition, and β2 is the power-law index at energies between the two transitions. This formula can be rewritten to a piecewise form of generalized triple-power-low (TPL) function:
When β2 matches β3, Equation (1) is reduced to the pan-spectrum function (Liu et al. 2020b) that is useful for fitting a suprathermal electron spectrum measured at no less than six energy channels. The pan-spectrum function can be rewritten to a generalized double-power-law (DPL) function (Wang et al. 2023):
According to the fitted parameters, thus, we can self-consistently determine the energy spectral shape of suprathermal electrons, e.g., a (single, double, or triple) power-law, kappa distribution, Ellison–Ramaty (ER) function, kappa distribution (at low energy) plus power law (at high energy), etc. For example, when β2 = β3 and both β2 and ε1 approach infinity, Equation (1) is transformed to an ER-like function:

where the cutoff energy is  .
.
2.1. Case #1 in 2018 January
For this CIR (Figure 1), Wind (MMS1) crosses the forward shock at 06:02 UT (06:41 UT) on 2018 January 8, with a location of [206.1, 92.2, −7.3] RE ([24.2, 2.0, 7.0] RE) in GSE coordinates. Wind also crosses a stream interface (SI) at 12:50 UT on January 8 and a reverse shock at 00:32 UT on January 9, while MMS1 has no electron and plasma measurements available around the SI and reverse shock. Note that the SI acts as a barrier between the suprathermal electrons in low-speed and high-speed wind.
For the forward-shock passage by Wind (MMS1), the fitted/estimated parameters are  [−0.74, 0.17, −0.64] ([−0.76, 0.04, −0.64]), Vsh = 340 ± 7 km s−1 (381 ± 5 km s−1), θBn = 60° ± 2° (64° ± 2°), Mf
= 1.40 ± 0.05 (1.75 ± 0.03), r = 2.15 ± 0.08 (2.20 ± 0.12), rB
= 1.64 ± 0.03 (2.17 ± 0.05), Dramp = 165 ± 21 km (21 ± 2 km), and ∣
E
drift∣ = 3.5 mV m−1 (2.4 mV m−1). As this forward shock moves from Wind to MMS1, it retains a similar
[−0.74, 0.17, −0.64] ([−0.76, 0.04, −0.64]), Vsh = 340 ± 7 km s−1 (381 ± 5 km s−1), θBn = 60° ± 2° (64° ± 2°), Mf
= 1.40 ± 0.05 (1.75 ± 0.03), r = 2.15 ± 0.08 (2.20 ± 0.12), rB
= 1.64 ± 0.03 (2.17 ± 0.05), Dramp = 165 ± 21 km (21 ± 2 km), and ∣
E
drift∣ = 3.5 mV m−1 (2.4 mV m−1). As this forward shock moves from Wind to MMS1, it retains a similar  and r but evolves to have a slightly faster Vsh, larger Mf
, higher rB
, smaller ∣
E
drift∣, and 8 times thinner Dramp.
and r but evolves to have a slightly faster Vsh, larger Mf
, higher rB
, smaller ∣
E
drift∣, and 8 times thinner Dramp.
Regarding this shock crossing by Wind, the electron measurements are dominated by suprathermal electrons at ∼0.14–8.9 keV (∼0.16–8.9 keV) and at ∼40–66 keV in the upstream (downstream), while they are significantly affected at ∼8.9–27 keV by the instrumental background and at energies above 66 keV by penetrating cosmic rays (Wang et al. 2015). We select a 10 minute interval of 05:50–06:00 UT in upstream and of 06:04–06:14 UT adjacent to the shock in downstream, respectively, to obtain the average electron fluxes for the seed population and shocked population. For suprathermal electrons in the upstream (downstream), the omnidirectional Jup versus εup (Jdn versus  ) spectrum is self-consistently determined to exhibit a TPL shape (Equation (2)), with β1 = 2.41 ± 0.21 (2.79 ± 0.11) at energies below ε1 ≃ 0.4 keV, β3 = 3.39 ± 0.08 (3.18 ± 0.06) at energies above ε2 ≃ 1.5 keV (2.0 keV), and β2 = 4.35 ± 0.11 (4.07 ± 0.13) at energies between ε1 and ε2 (Figure 2 and Table 1). The omnidirectional
  ratio between the shocked and unshocked suprathermal electrons varies between 1.6 and 2.2 at 0.16–8.9 keV, indicative of the presence of significant electron enhancement at these energies (Yang et al. 2019), while the
  ratio is around 1 at 40–66 keV (Figure 2 (c)). Furthermore, the flux ratio of
  mostly peaks around 90° PA at 0.16–8.9 keV (Figure 2 (d)), suggesting that the strongest electron enhancement occurs in the direction essentially perpendicular to the IMF.
Table 1. The Fitted Parameters
| Case #1 in 2018 January | Case #2 in 2020 February | ||||||
|---|---|---|---|---|---|---|---|
| Forward Shock | Reverse Shock | Reverse Shock | |||||
| January 8 | January 9 | February 7 | |||||
| Wind | MMS1 | Wind | MMS1 a | Wind | MMS1 | ||
| Time (UT) | 06:02 | 06:41 | 00:32 | ⋯ | 01:50 | 02:51 | |
| Location (RE ) c | [206.1, 92.2, −7.3] | [24.2, 2.0, 7.0] | [206.9, 93.2, −7.1] | ⋯ | [256.6, 25.2, 3.1] | [24.9, 3.3, 0.5] | |

| [−0.74, 0.17, −0.64] | [−0.76, 0.04, −0.64] | [0.87, −0.17, 0.47] | ⋯ | [0.89, 0.17, −0.43] | [0.95, 0.10, −0.28] | |
| Vsh (km s−1) | 340 ± 7 | 380 ± 5 | 367 ± 9 | ⋯ | 432 ± 21 | 415 ± 15 | |
| θBn (deg) | 60 ± 2 | 64 ± 2 | 79 ± 2 | ⋯ | 51 ± 8 | 82 ± 5 | |
| Mf | 1.40 ± 0.05 | 1.75 ± 0.03 | 1.20 ± 0.09 | ⋯ | 1.49 ± 0.10 | 1.18 ± 0.04 | |
| r | 2.15 ± 0.08 | 2.20 ± 0.12 | 1.70 ± 0.02 | ⋯ | 1.90 ± 0.13 | 1.82 ± 0.10 | |
| rB | 1.64 ± 0.03 | 2.17 ± 0.05 | 1.76 ± 0.09 | ⋯ | 1.61 ± 0.10 | 1.82 ± 0.08 | |
| Dramp (km) | 165 ± 21 | 21 ± 2 | 312 ± 41 | ⋯ | (2.41 ± 0.48) × 104 | (7.91 ± 0.37) × 103 | |
| Edrift (mV m−1) | 3.5 | 2.4 | 0.8 | ⋯ | 0.9 | 1.4 | |
| predicted βFFA | 1.80 ± 0.09 | 1.75 ± 0.12 | 2.64 ± 0.06 | ⋯ | 2.17 ± 0.24 | 2.33 ± 0.22 | |
| β1 | upstream | 2.41 ± 0.21 | 1.92 ± 0.08 | 2.02 ± 0.18 | ⋯ | 1.95 ± 0.16 | 1.74 ± 0.26 |
| downstream | 2.79 ± 0.11 | 2.43 ± 0.15 | 2.30 ± 0.15 | ⋯ | 2.36 ± 0.05 | 2.09 ± 0.76 | |
| β2 | upstream | 4.35 ± 0.11 | N/A b | 7.65 ± 0.41 | ⋯ | 7.81 ± 0.34 | 4.58 ± 0.49 |
| downstream | 4.07 ± 0.13 | 3.16 ± 0.52 | 6.85 ± 0.18 | ⋯ | 6.80 ± 0.19 | 4.36 ± 1.80 | |
| β3 | upstream | 3.39 ± 0.08 | N/A b | N/A b | ⋯ | N/A b | N/A b |
| downstream | 3.18 ± 0.06 | N/A b | N/A b | ⋯ | N/A b | N/A b | |
| ε1 or εc (keV) | upstream | 0.40 ± 0.03 | 0.40 ± 0.05 d | 0.62 ± 0.06 | ⋯ | 0.54 ± 0.05 | 0.27 ± 0.05 |
| downstream | 0.42 ± 0.04 | 0.23 ± 0.03 | 0.55 ± 0.04 | ⋯ | 0.47 ± 0.02 | 0.28 ± 0.08 | |
| ε2 (keV) | upstream | 1.45 ± 0.17 | N/A b | N/A b | ⋯ | N/A b | N/A b |
| downstream | 1.97 ± 0.47 | N/A b | N/A b | ⋯ | N/A b | N/A b | |
Notes.
a Data gap. b Not enough energy channels of electron measurements to fit. c In GSE coordinates d The cutoff energy εc .Download table as: ASCIITypeset image
For the forward-shock crossing by MMS1, the electron measurements are dominated by suprathermal electrons at ∼0.09–0.44 keV (∼0.13–0.31 keV) in the upstream (downstream), while they are significantly affected at energies above by the instrument background/noise (Liu et al. 2020a). We select a 1 minute interval of 06:39:20–06:40:20 UT in upstream and of 06:41:20–06:42:20 UT in downstream, respectively, to obtain the average electron fluxes for the seed and shocked suprathermal electrons. For suprathermal electrons in the upstream (downstream), the omnidirectional flux energy spectrum is determined to have an ER-like (DPL) shape, with β1 = 1.92 ± 0.08 at energies below εc
≃ 0.4 keV (β1 = 2.43 ± 0.15 at energies below ε1 ≃ 0.2 keV and β2 = 3.16 ± 0.52 at energies above). The omnidirectional  ratio across the shock roughly decreases with energy from 1.7 at 0.13 keV to 1.1 at 0.31 keV. When the omnidirectional
  ratio is greater (less) than 1.5,
  slightly peaks at 90° PA (appears roughly isotropic in PA). Therefore, the electron acceleration at this forward shock becomes less effective as the shock propagates from Wind to MMS1.
Regarding the reverse-shock passage by Wind, the fitted-shock parameters are  [0.87, −0.17, 0.47], Vsh = 367 ± 9 km s−1, θBn = 79° ± 2°, Mf
= 1.20 ± 0.09, r = 1.70 ± 0.02, rB
= 1.76 ± 0.09, Dramp = 312 ± 41 km, and ∣
E
drift∣ = 0.8 mV m−1. For the Wind electron measurements at suprathermal energies of 0.16–2 keV (0.16–2.8 keV) in upstream (downstream), the omnidirectional Jup (Jdn), averaged over 00:20–00:30 UT (00:34–00:44 UT), shows a DPL spectrum with β1 = 2.02 ± 0.18 (2.30 ± 0.15) at energies below ε1 ≃ 0.6 keV and β2 = 7.65 ± 0.41 (6.85 ± 0.18) at energies above. The omnidirectional
[0.87, −0.17, 0.47], Vsh = 367 ± 9 km s−1, θBn = 79° ± 2°, Mf
= 1.20 ± 0.09, r = 1.70 ± 0.02, rB
= 1.76 ± 0.09, Dramp = 312 ± 41 km, and ∣
E
drift∣ = 0.8 mV m−1. For the Wind electron measurements at suprathermal energies of 0.16–2 keV (0.16–2.8 keV) in upstream (downstream), the omnidirectional Jup (Jdn), averaged over 00:20–00:30 UT (00:34–00:44 UT), shows a DPL spectrum with β1 = 2.02 ± 0.18 (2.30 ± 0.15) at energies below ε1 ≃ 0.6 keV and β2 = 7.65 ± 0.41 (6.85 ± 0.18) at energies above. The omnidirectional  ratio roughly decreases with the energy from 1.5 to 1.0. At the suprathermal energies below (above) ∼2 keV,
  peaks at 90° PA (appears roughly isotropic in PA). For this CIR, the suprathermal electron enhancement at reverse shock is less efficient than at forward shock.
2.2. Case #2 in 2020 February
In 2000 (Figure 3), this CIR passes both spacecraft with the absence of a forward shock, while it crosses Wind (MMS1) with the presence of an SI at 12:55 UT (13:40 UT) on February 6 and a reverse shock at 01:50 UT (02:51 UT) on February 7, with a fitted/estimated Vsh = 432 ± 21 km s−1 (415±15 km s−1),  [0.89, 0.17, −0.43] ([0.95, 0.10, −0.28]), θBn = 51° ± 8° (82° ± 5°), Mf
= 1.49 ± 0.10 (1.18 ± 0.04), r = 1.90 ± 0.13 (1.82 ± 0.10), rB
= 1.61 ± 0.10 (1.82 ± 0.08), Dramp = (2.41 ± 0.48) × 104 km ((7.91 ± 0.37) × 103 km), and ∣
E
drift∣ = 0.9 mV m−1 (1.4 mV m−1). As this reverse shock moves from Wind to MMS1, it remains a similar Vsh and r but evolves toward a smaller Mf
, slightly higher rB
, stronger ∣
E
drift∣, and 3 times thinner Dramp.
[0.89, 0.17, −0.43] ([0.95, 0.10, −0.28]), θBn = 51° ± 8° (82° ± 5°), Mf
= 1.49 ± 0.10 (1.18 ± 0.04), r = 1.90 ± 0.13 (1.82 ± 0.10), rB
= 1.61 ± 0.10 (1.82 ± 0.08), Dramp = (2.41 ± 0.48) × 104 km ((7.91 ± 0.37) × 103 km), and ∣
E
drift∣ = 0.9 mV m−1 (1.4 mV m−1). As this reverse shock moves from Wind to MMS1, it remains a similar Vsh and r but evolves toward a smaller Mf
, slightly higher rB
, stronger ∣
E
drift∣, and 3 times thinner Dramp.
For the reverse-shock crossing by Wind, the electron measurements are dominated by suprathermal electrons at ∼0.14–1.95 keV and at 40 keV, while the measurements are significantly affected at ∼2.8–27 keV by the instrumental background and at energies above 40 keV by penetrating cosmic rays, in both the upstream and downstream (Figure 4). We select a 10 minute interval of 01:39–01:49 UT (01:54–02:04 UT) to average the suprathermal electron fluxes in the upstream (downstream). For the upstream (shocked) suprathermal electrons at ∼0.14–1.95 keV, the omnidirectional flux energy spectrum exhibits a DPL shape with β1 = 1.95 ± 0.16 (2.36 ± 0.05) at energies below ε1 ≃ 0.5 keV and β2 = 7.81 ± 0.34 (6.80 ± 0.19) at energies above. The omnidirectional  ratio is about 1.6 at 1.95 keV and significantly less than 1.5 at other energies. The
  ratio tends to peak near 120° PA.
Regarding the shock crossing by MMS1, the upstream (downstream) electron measurements are dominated by suprathermal electrons at ∼0.11–0.53 keV (∼0.13–0.44 keV) and by instrumental noise/background at energies above. We select a 1 minute interval of 02:50–02:51 UT (02:52–02:53 UT) to average the suprathermal electron fluxes in upstream (downstream). For the upstream (shocked) suprathermal electrons, the omnidirectional flux energy spectrum also shows a DPL shape with β1 = 1.74 ± 0.76 (2.09 ± 0.76) at energies below ε1 ≃ 0.3 keV and β2 = 4.58 ± 0.49 (4.36 ± 1.80) at energies above. At 0.13–0.44 keV, the omnidirectional  ratio weakly decreases with the energy from ∼1.6 to ∼1.4, while the
  ratio appears to peak at 90° PA. Therefore, the electron shock acceleration becomes more significant as this reverse shock propagates from Wind to MMS1.
3. Summary and Discussion
We have examined the evolution of in situ shock acceleration of solar wind suprathermal electrons in two CIRs observed by Wind and MMS1 at 1 au, respectively, in 2018 January and 2020 February. As the forward (reverse) shock in CIR #1 (#2) moves from Wind at [206, 92, −7]RE
([257, 25, 3]RE
) to MMS1 at [24, 2, 7]RE
([25, 3, 0.5]RE
), the shock's thickness Dramp becomes 8 (3) times thinner and the convective electric field
E
drift gets weaker (stronger); both the upstream and shocked suprathermal electrons at MMS1 exhibit a flatter flux energy spectrum than at Wind, while the electron flux enhancement across the shock,  , becomes less (more) significant. For CIR #1 observed by Wind,
  is larger at the forward shock with a stronger ∣
E
drift∣ compared to the reverse shock.
is larger at the forward shock with a stronger ∣
E
drift∣ compared to the reverse shock.
For the two CIR cases, both the upstream and shocked suprathermal electrons tend to show a TPL flux energy spectrum (when the electron measurements are available at ∼0.1–66 keV) that bends downward at a break energy near ∼0.2–0.5 keV and further bends upward at a break energy near ∼1.5–2.0 keV (Figures 2 and 4). The downstream suprathermal electron fluxes are caused by suprathermal electrons accelerated locally at shock, as well as those trapped within CIRs and/or crossing the shock multiple times (Kunow et al. 1999). However, such nonlocal effects would contribute to the suprathermal electron observations at Wind and MMS1 to a very similar extent since these two spacecraft were separated only by <0.01 au. Therefore, the comparison of  between Wind and MMS1 can reveal the evolution of local shock electron acceleration from Wind to MMS1.
For the forward shock of CIR #1 observed by Wind (MMS1) with ∣
E
drift∣ = 3.5 (2.4) mV m−1, the  ratio across the shock roughly decreases from 2.2 (1.4) at ∼0.16 keV to 1.7 (1.1) at ∼0.3 keV, while the
  ratio at Wind varies between 1.6 and 2.2 at ∼0.4–8.9 keV. For the reverse shock of CIR #2 observed by Wind (MMS1) with ∣
E
drift∣ = 0.9 (1.4) mV m−1, the
ratio at Wind varies between 1.6 and 2.2 at ∼0.4–8.9 keV. For the reverse shock of CIR #2 observed by Wind (MMS1) with ∣
E
drift∣ = 0.9 (1.4) mV m−1, the  ratio weakly decreases from 1.3 (1.6) at ∼0.14 keV to 1.2 (1.4) at ∼0.4 keV. These observations suggest that the efficiency of local electron shock acceleration appears to increase with the
E
drift strength as these CIR shocks move from Wind to MMS1.
ratio weakly decreases from 1.3 (1.6) at ∼0.14 keV to 1.2 (1.4) at ∼0.4 keV. These observations suggest that the efficiency of local electron shock acceleration appears to increase with the
E
drift strength as these CIR shocks move from Wind to MMS1.
For CIR #1, Wind also detects the presence of a reverse shock with ∣
E
drift∣ = 0.8 mV m−1. This reverse shock exhibits a smaller  ratio that roughly decreases from 1.5 at ∼0.16 keV to 1.1 at ∼1.5 keV, compared to the corresponding forward shock. It may indicate that for CIR #1, the local electron shock acceleration, likely depending on the
E
drift strength, tends to be less efficient at the reverse shock than at the forward shock.
ratio that roughly decreases from 1.5 at ∼0.16 keV to 1.1 at ∼1.5 keV, compared to the corresponding forward shock. It may indicate that for CIR #1, the local electron shock acceleration, likely depending on the
E
drift strength, tends to be less efficient at the reverse shock than at the forward shock.
In the downstream of CIR #1 forward shock observed both by Wind and MMS1 (Figure 1), the suprathermal electron fluxes first decrease rapidly and then vary gradually with distance from the shock. Therefore, the downstream electron flux Jdn adjacent to the shock is mainly caused by suprathermal electrons due to local shock acceleration. For the significantly shocked suprathermal electrons ( 1.5), the fitted power-law spectral indices barely agree with the FFA theoretical prediction (Table 1), while the
  ratio appears to peak near 90° PA. These results suggest that the in situ electron acceleration at these forward shocks near 1 au could be dominated by the SDA process, similar to that at the terrestrial bow shock and shocks driven by coronal mass ejections. Assuming that electrons retain their phase-space density after SDA (Liouville's theorem), we can obtain the energy gain Δε and then calculate the drift length Ldrift = Δε/q∣
E
drift∣ (Yang et al. 2018; Liu et al. 2020a). For the CIR #1 forward shock (Figure 2), the estimated Ldrift at Wind appears to increase with the downstream electron energy
ratio appears to peak near 90° PA. These results suggest that the in situ electron acceleration at these forward shocks near 1 au could be dominated by the SDA process, similar to that at the terrestrial bow shock and shocks driven by coronal mass ejections. Assuming that electrons retain their phase-space density after SDA (Liouville's theorem), we can obtain the energy gain Δε and then calculate the drift length Ldrift = Δε/q∣
E
drift∣ (Yang et al. 2018; Liu et al. 2020a). For the CIR #1 forward shock (Figure 2), the estimated Ldrift at Wind appears to increase with the downstream electron energy  from about 10 km at ∼0.2 keV to about 400 km at ∼9 keV, while the estimated Ldrift at MMS1 is about 2–9 km at ∼0.1–0.3 keV.
In summary, the in situ acceleration of solar wind suprathermal electrons at CIR shocks near 1 au exhibits an efficiency that increases with the strength of convective electric field E drift along the shock. As the forward (reverse) shock moves from Wind to MMS1, the shock's thickness becomes much thinner, but ∣ E drift∣ gets weaker (stronger), leading to less (more) significant electron shock acceleration. These results also suggest that the CIR shock acceleration in the IPM can contribute to the formation of halo electrons and superhalo electrons.
Acknowledgments
This research at Peking University is supported in part by NSFC under contracts 42225404, 42127803, and 42150105; by National Key R&D Program of China No. 2021YFA0718600; and by ISSI-BJ through the international team 581. L.Y. is partially supported by DFG HE 9270/1-1.