


Abstract
We present high-definition observations with the James Webb Space Telescope (JWST) of >1000 Cepheids in a geometric anchor of the distance ladder, NGC 4258, and in five hosts of eight Type Ia supernovae, a far greater sample than previous studies with JWST. These galaxies individually contain the largest samples of Cepheids, an average of >150 each, producing the strongest statistical comparison to those previously measured with the Hubble Space Telescope (HST) in the near-infrared (NIR). They also span the distance range of those used to determine the Hubble constant with HST, allowing us to search for a distance-dependent bias in HST measurements. The superior resolution of JWST negates crowding noise, the largest source of variance in the NIR Cepheid period–luminosity relations (Leavitt laws) measured with HST. Together with the use of two epochs to constrain Cepheid phases and three filters to remove reddening, we reduce the dispersion in the Cepheid P–L relations by a factor of 2.5. We find no significant difference in the mean distance measurements determined from HST and JWST, with a formal difference of −0.01 ± 0.03 mag. This result is independent of zero-points and analysis variants including metallicity dependence, local crowding, choice of filters, and slope of the relations. We can reject the hypothesis of unrecognized crowding of Cepheid photometry from HST that grows with distance as the cause of the "Hubble tension" at 8.2σ, i.e., greater confidence than that of the Hubble tension itself. We conclude that errors in photometric measurements of Cepheids across the distance ladder do not significantly contribute to the tension.
Export citation and abstract BibTeX RIS

Original content from this work may be used under the terms of the Creative Commons Attribution 4.0 licence. Any further distribution of this work must maintain attribution to the author(s) and the title of the work, journal citation and DOI.
1. Introduction
In the past decade, an intriguing and persistent discrepancy referred to as the "Hubble tension" 7 has been apparent at high significance (>5σ) between the Hubble constant (H0) directly measured from redshifts and distances, which are independent of cosmological models, and the same parameter derived from the ΛCDM model calibrated in the early Universe (for a recent review, see Verde et al. 2023).
The most significant disparity arises from the strongest constraints. These come from measurements of 42 local Type Ia supernovae (SNe Ia) calibrated by Cepheid variables, yielding H0 = 73.0 ± 1.0 km s −1 Mpc (SH0ES Collaboration; Riess et al. 2022, hereafter R22), compared to the analysis of Planck observations of the cosmic microwave background (Planck Collaboration et al. 2020), predicting H0 = 67.4 ± 0.5 km s −1 Mpc −1 in conjunction with ΛCDM. Cepheids are the preferred primary distance indicators in these studies due to the Leavitt law (P–L relation; Leavitt 1912), their extraordinary luminosity (MH
∼ − 7 mag at a period of 30 days), intrinsic precision (approximately 3% in distance per star), reliable identification based on periodicity and light-curve shape (Hertzsprung 1926), and comprehensive understanding (since Eddington 1917). They also serve as the best-calibrated distance indicators accessible in the largest volume of SN Ia hosts (D ∼ 50 Mpc), thanks to the consistent use of a single stable instrument, Hubble Space Telescope (HST) WFC3 UVIS+IR, by the SH0ES team in measurements within SN hosts and in several independent geometric anchors: the megamaser host NGC 4258 (Reid et al. 2019), the Milky Way (through parallaxes, now including Gaia EDR3; Gaia Collaboration et al. 2021), and the Magellanic Clouds (via detached eclipsing binaries; Pietrzyński et al. 2019). Near-infrared (NIR) observations are crucial to mitigating the impact of dust, a challenge faced by many cosmic probes. Yet, the modest NIR resolution of HST, ∼0 1, has limited the inherent precision of individual Cepheid measurements due to the effects of crowding in nearby galaxies. As noted by Freedman et al. (2019), "[p]ossibly the most significant challenge for Cepheid measurements beyond 20 Mpc is crowding and blending from redder (RGB and AGB) disk stars, particularly for near-infrared H-band measurements [...]."
The James Webb Space Telescope (JWST) provides new capabilities to scrutinize and refine the strongest observational evidence contributing to the tension. Specifically, the significantly greater resolution of JWST over HST has greatly reduced—in practical terms, almost eliminated—the main source of noise in NIR photometry of Cepheid variables observed in the hosts of nearby SNe Ia. The resolution of JWST provides the ability to cleanly separate these vital standard candles from surrounding photometric "chaff." This study extends the scope of JWST measurements of Cepheids along the distance ladder, building upon measurements in one SN Ia host (NGC 5584) and the distance scale anchor NGC 4258 (Riess et al. 2023, hereafter R23). Here we present a greatly expanded sample of such measurements that doubles its distance range to span the full range of distances of nearby SN calibrators (the second rung of the distance ladder) and triples the Cepheid sample size, while raising the number of SN hosts studied from one to five and the number of SN Ia calibrated from one to eight. In Section 2 we present the observations, in Section 3 their analysis, and in Section 4 we discuss their interpretation.
2. Data
The targets of this program, GO-1685, were selected at those richest in Cepheids and SN Ia from the SH0ES host sample of 37. The first two to execute, NGC 4258 and NGC 5584, were presented in R23 and the four presented here executed after, in mid 2023. The observational parameters of our JWST NIRCam imaging campaigns for four SN Ia hosts (NGC 1448, NGC 1559, NGC 5468, and NGC 5643) are provided in Table 1 and shown in Figure 1 (see R23 for the same information for NGC 4258 and NGC 5584). As in R23, the four new hosts were imaged with three filters (F090W, F150W, and F277W, centered at 0.9, 1.5, and 2.8 μm, respectively; see Figure 2 in R23 for filter curves) in two epochs separated by 15–16 days, with one short wavelength module of the NIRCam instrument covering the host and the other placed on a far halo field as shown in Figure 1. The epoch separation was selected by the JWST schedulers subject to the requirements of a 15–30 days spacing and an orientation difference within 5°. For the closer two hosts, NGC 1448 and NGC 5643, we swapped the A and B modules on the host on consecutive visits and thus doubled the spatial coverage of the far halo field on opposite sides.

Figure 1. NIRCam fields superimposed on Digitized Sky Survey color images for four hosts (top) and NIRCam RGB images (F090W/F150W/F277W) showing positions of Cepheids (cyan circles) (bottom). North is up and east is to the left.
Download figure:
Standard image High-resolution imageTable 1. Observation Log
| Date | MJD | Epoch | Exposure a | Filter1 | Filter2 | Exp. Time (s) | R.A. (J2000) | Decl. (J2000) | Orientation |
|---|---|---|---|---|---|---|---|---|---|
| 2023-06-30 | 60125.43 | N1559e1 | 001001_02101_* | F090W | F277W | 418.7 × 4 | 64.39918 | −62.78429 | 216.0 |
| 2023-06-30 | 60125.46 | N1559e1 | 001001_04101_* | F150W | F277W | 526.1 × 4 | 64.39918 | −62.78429 | 216.0 |
| 2023-07-15 | 60140.66 | N1559e2 | 002001_03101_* | F090W | F277W | 418.7 × 4 | 64.39906 | −62.78429 | 221.0 |
| 2023-07-15 | 60140.69 | N1559e2 | 002001_03103_* | F150W | F277W | 526.1 × 4 | 64.39906 | −62.78429 | 221.0 |
| 2023-07-07 | 60132.13 | N5643e1 | 011001_02101_* | F090W | F277W | 311.4 × 4 | 218.16850 | −44.17334 | 91.7 |
| 2023-07-07 | 60132.15 | N5643e1 | 011001_04101_* | F150W | F277W | 418.7 × 4 | 218.16850 | −44.17334 | 91.7 |
| 2023-07-22 | 60147.17 | N5643e2 | 012001_03101_* | F090W | F277W | 311.4 × 4 | 218.18105 | −44.12627 | 96.7 |
| 2023-07-22 | 60147.19 | N5643e2 | 012001_05101_* | F150W | F277W | 418.7 × 4 | 218.18105 | −44.12627 | 96.7 |
| 2023-08-02 | 60158.89 | N1448e1 | 013001_02101_* | F090W | F277W | 418.7 × 4 | 56.16443 | −44.61610 | 251.0 |
| 2023-08-02 | 60158.91 | N1448e1 | 013001_04101_* | F150W | F277W | 526.1 × 4 | 56.16443 | −44.61610 | 251.0 |
| 2023-08-18 | 60174.19 | N1448e2 | 014001_03101_* | F090W | F277W | 418.7 × 4 | 56.17600 | −44.66334 | 256.0 |
| 2023-08-18 | 60174.21 | N1448e2 | 014001_05101_* | F150W | F277W | 526.1 × 4 | 56.17600 | −44.66334 | 256.0 |
| 2023-06-28 | 60123.27 | N5468e1 | 007001_02101_* | F090W | F277W | 204.0 × 6 | 211.66669 | −5.40969 | 114.6 |
| 2023-06-28 | 60123.29 | N5468e1 | 007001_02103_* | F150W | F277W | 472.4 × 6 | 211.66669 | −5.40969 | 114.6 |
| 2023-07-14 | 60139.55 | N5468e2 | 008001_02101_* | F090W | F277W | 311.4 × 5 | 211.66745 | −5.41007 | 115.6 |
| 2023-07-14 | 60139.57 | N5468e2 | 008001_02103_* | F150W | F277W | 526.1 × 5 | 211.66745 | −5.41007 | 115.6 |
Note.
a All exposures start with jw01685.Download table as: ASCIITypeset image
We analyzed the wave front history of JWST over the time span of the observations from the telescope monitoring data, 2023 June–August, as shown in Figure 2 to determine the photometric stability of our data set. There was a moderately large tilt of mirror segment C5 detected on July 16 (not present on July 14) that was corrected July 22 and we had no observations between these two dates. The wave front modeling indicates no large changes at the time of the observations and that variations in encircled energy at small radii (similar to point-spread function, PSF, photometry) would be <0.005 mag (less at longer wavelengths). Based on this we judged the epochs to be photometrically consistent and proceeded with our measurements. We note the impact to photometry due to changes in the shape of the PSF between epochs is further negated by the determinations of aperture corrections from stars within each frame.
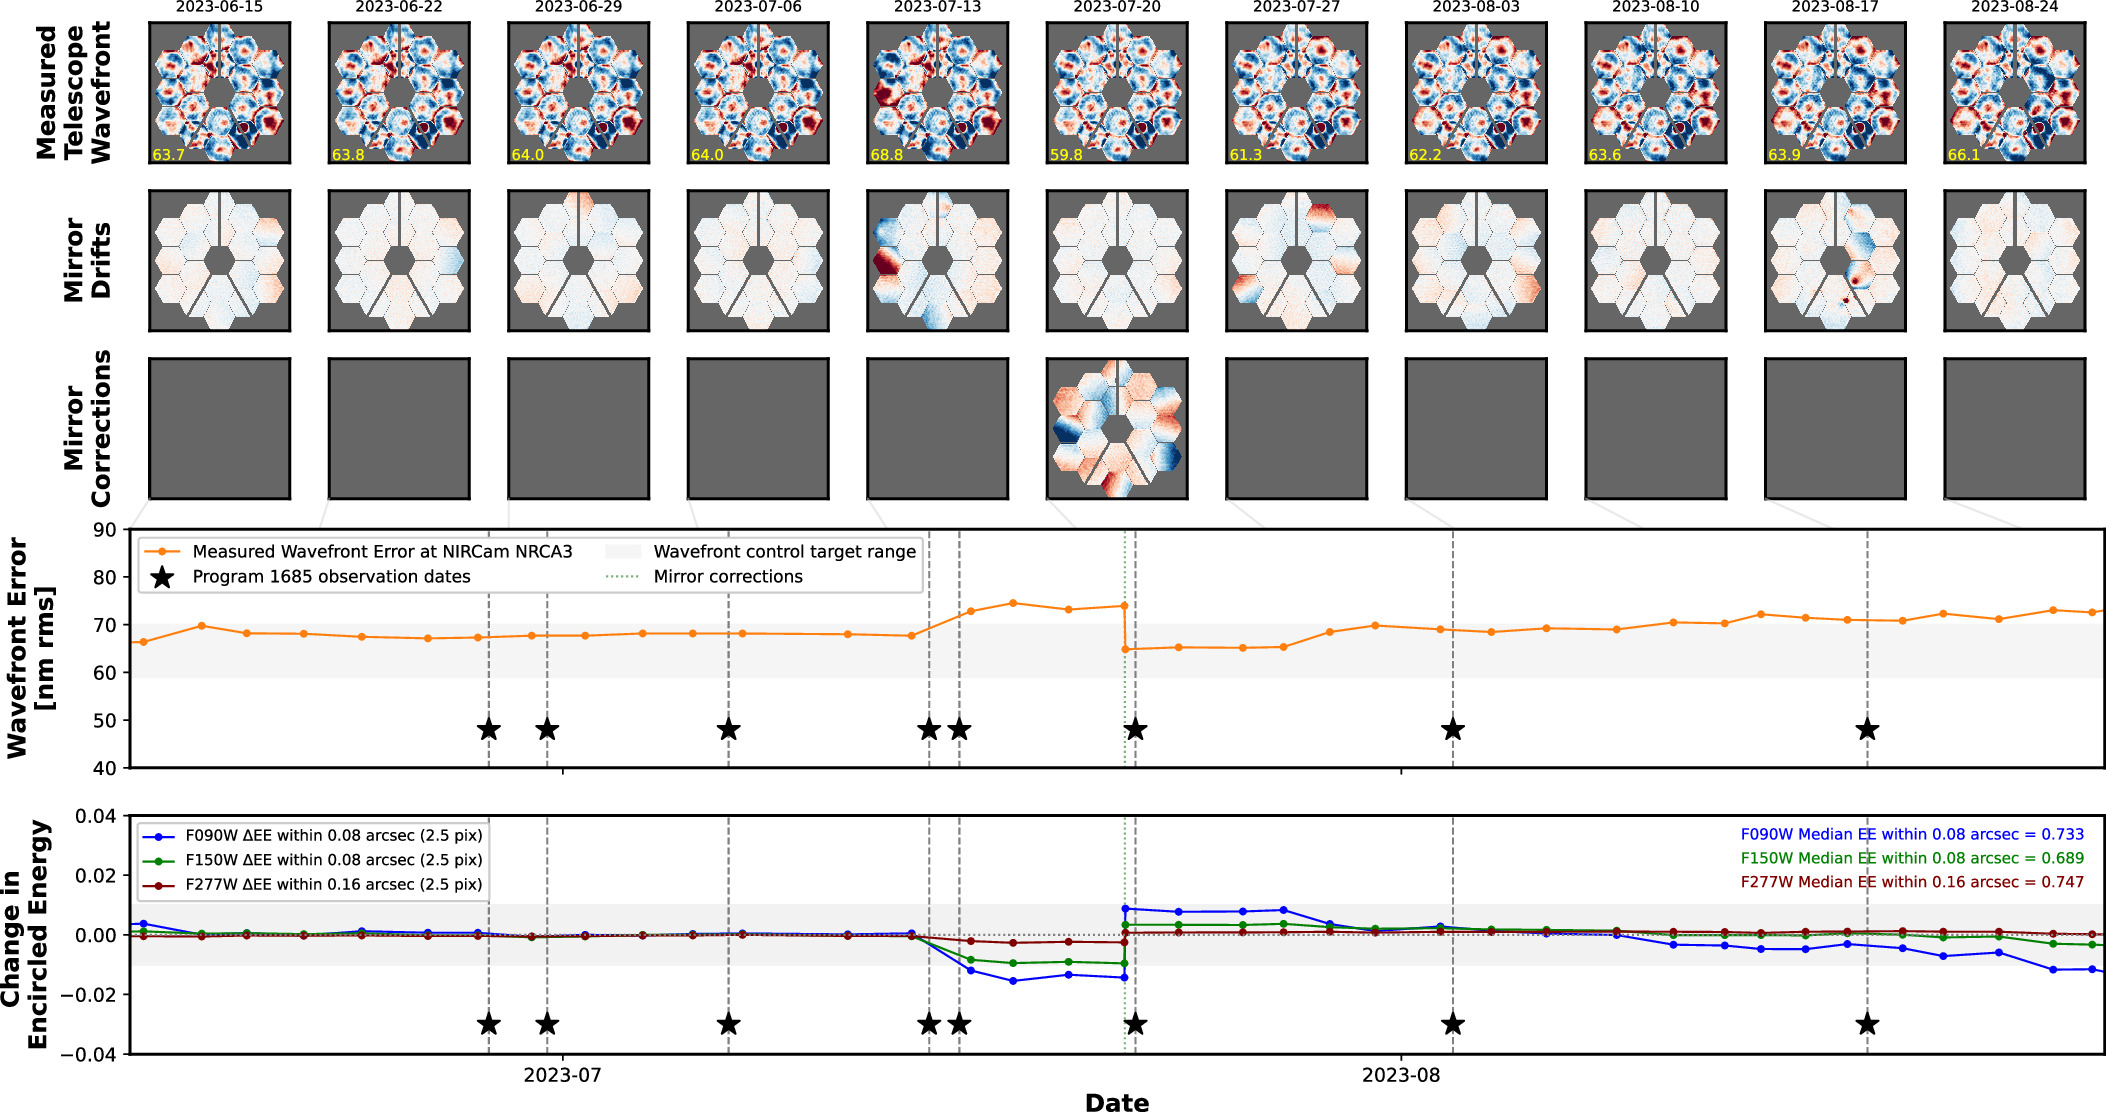
Figure 2. JWST wave front sensing data during the interval of these observations, 2023 June–August. The wave front sensing, drifts, rectifications, and wave front errors are shown in the top three rows of panels. The bottom panel shows the change to encircled energy in the core of the PSF in the three filters used for this program. The dates of our observations are indicated as vertical dashed lines and a star symbol.
Download figure:
Standard image High-resolution imageWe used the STScI NIRCam reduction pipeline, version 1.12.0, to calibrate the data frames. There has been only one significant update to the reference files since those used in R23, 1125.pmap and 1126.pmap, which included zero-point updates for each sensor chip assembly and flat field improvements. The present work uses this update (and we have remeasured NGC 4258 and NGC 5584 from R23). As a result of these updates, the mean photometry of sources became brighter by ∼0.03 mag in F090W and ∼0.01 mag in F150W, where the latter band was used for our baseline distance measurements. Much of this change cancels when comparing Cepheids between NGC 4258 and NGC 5584. Updates after 1126.pmap through 2023 December do not affect NIRCam photometry.
We performed photometry on the images using the DOLPHOT package (Dolphin 2000, 2016) and its NIRCam module (Weisz et al. 2023; D.R. Weisz et al. 2024, in preparation), with the same procedures described in R23 with the same cuts on the crowding, sharpness, object type, signal-to-noise ratio, and error flags as reported by DOLPHOT
8
(see also Warfield et al. 2023). The only relevant changes since R23 are the version of the instrumental reference files provided by STScI stated above. We measured photometry with DOLPHOT with the same, recommended parameters on all of our images. The PSF fitting procedure is automated and performs the photometry of all frame stars simultaneously and blind to which are Cepheids, thus it is completely unsupervised, removing any human intervention from the Cepheid measurement procedure. The Cepheids were identified by astrometrically matching the JWST photometry catalogs to the Cepheid lists identified by the SH0ES team from multiepoch, optical HST imaging (Yuan et al. 2022b; Riess et al. 2022). The matching tolerance was set to 0.7 NIRCam short wavelength pixels in distance (002) but matches were generally within 001 of the expected position. This is the same result as seen in R23.
Among the 36 images we obtained for this program (three filters in two epochs for six hosts), only one suffered an issue. This was for the first epoch in F090W for NGC 5468 where the number of samples "up the ramp" during accumulation (four) resulted in incomplete cosmic-ray removal in the individual cal files (dithers). This produced some scattered artifacts in that single image. Although these artifacts are rare enough to have little impact on the PSF-fitting region of the Cepheids, they impacted the measurement of the aperture correction for this image due their presence in source-subtracted sky annuli (which extend to greater radii and thus cover more area than the PSF-fitting region). To solve this problem, we determined the appropriate aperture correction for this image and in each chip by comparing the nonvariable stars between this epoch and epoch 2 with F090W (which had more samples and no issues). The result from comparing the nonvariable stars between these two epochs produced an aperture correction consistent in value with the set of aperture corrections seen for other images.
As in R23, we imposed additional quality requirements on specific photometric parameters to ensure our sample contains reliable Cepheid magnitudes that yield robust distance measurements. The most important of these is based on the value of χ2 (the quality of the scene modeling) reported by DOLPHOT, which we generally require to be better (lower) than 1.4 per degree of freedom; we allow a modest rise in this limit, up to 1.7, as a linear function of log period, since long-period Cepheids are very bright and their lower shot noise will reveal more imperfections in the PSF model. This cut excluded a median of ∼7% of sources among the set of hosts due to subpar scene modeling. The full Cepheid sample forms a tight locus when comparing log period to χ2, such that the poor fits are readily apparent as a tail in the χ2 distribution toward high values. The nature of poor χ2 objects is that they are either confused even at JWST resolution or, more likely, include a resolved source such as a cluster or background galaxy, which is not well modeled with a set of PSFs by DOLPHOT. We also employ the same color cut as R23, 0.3 < F090W−F150W < 1.15 (equivalent to 0.5 < V−I < 1.7, a broad range for Cepheids) which excludes ∼5% of sources. Nearly all of these are redder than the cut and are either highly reddened or strongly blended with a red star. Not surprisingly, this red boundary corresponds to the blue edge of the highly populated red giant branch (RGB)/asymptotic giant branch (AGB) (see Figure 3) so the odds of a direct blend or misidentification will rise rapidly near this limit with hundreds to thousands of red stars at similar brightness for every Cepheid. The exception to the above is NGC 5643, the only host with moderate Milky Way foreground extinction (E(V−I) = 0.21 mag versus <0.05 mag for all others), shifting all apparent colors redward including the RGB/AGB branch and leading us to shift the accepted color range accordingly. The values of χ2 for Cepheids in this host are also slightly higher than the other hosts leading us to relax the χ2 limit by 0.3, resulting in the exclusion of a similar fraction as the other hosts.
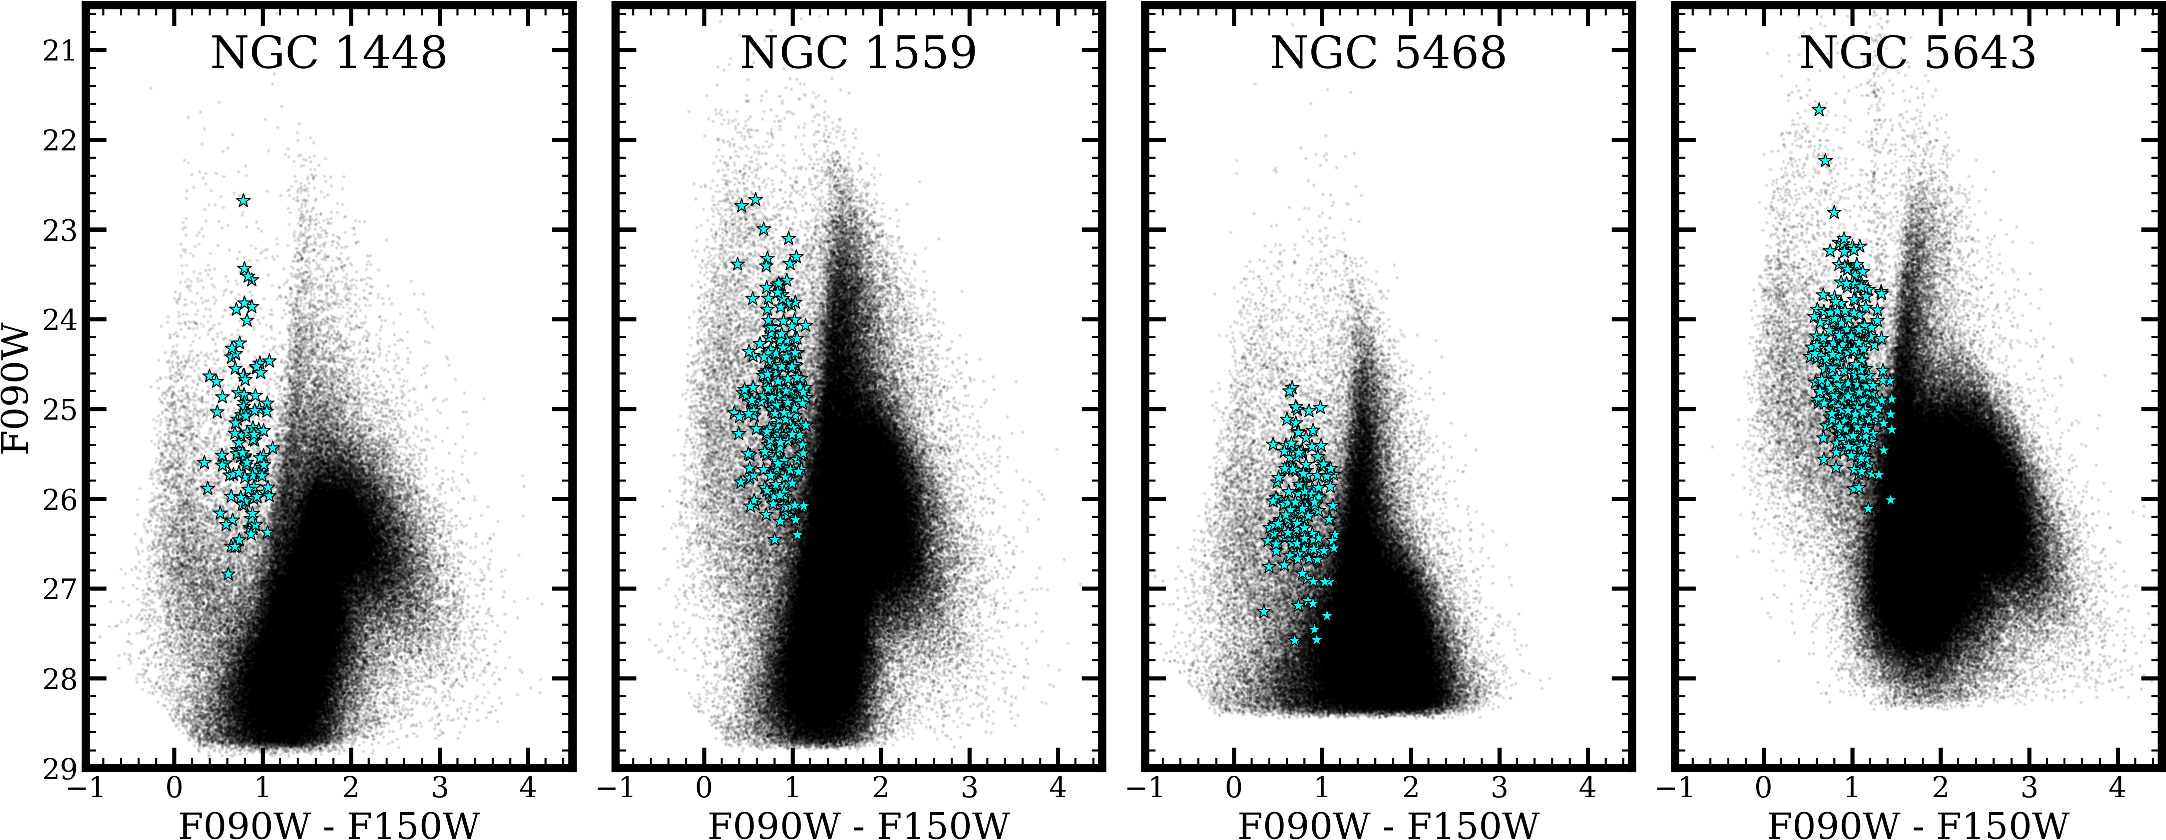
Figure 3. Color–magnitude diagrams (CMD) for the modules covering Cepheids. Each star is plotted using a small black point, while Cepheids are indicated by cyan symbols. A color cut in this space is included for NGC 1559, 0.3 < F090W−F150W < 1.15, corresponding to a broad range around the instability strip (0.5 < V−I < 1.7). For NGC 5643, which has large foreground extinction (E(V − I) = 0.21) the color range is shifted redward. The magnitudes and colors of non-Cepheids are based on the first visit. If a Cepheid is observed in only the first or in both visits, its location on the CMD is based on the first visit. Otherwise, it is based on the second visit.
Download figure:
Standard image High-resolution imageIn Figure 3 we show the position of the Cepheids within the color–magnitude diagrams for the field stars in each host. In Figure 4 we show cutouts for two representative Cepheids with P ∼ 40 days from each of six host in three HST and three JWST filters. Inspection of the JWST F150W stamps shows a qualitative change relative to HST F160W thanks to the higher angular resolution. The background is effectively resolved, with the brightness fluctuations in the HST images transformed to reveal individual stars and spatially constant backgrounds.

Figure 4. Example HST and JWST image stamps around Cepheids with P ∼ 40 days in all hosts. The top row shows the location of each Cepheid. HST filters are labeled in black while the JWST filters are in magenta.
Download figure:
Standard image High-resolution image2.1. Artificial Stars
As in R23, we inject 200 artificial stars that bracket the range of the Cepheid magnitudes, interpolating between these to derive the background bias (i.e., the mean crowding correction) based on the uncrowded magnitudes, estimated from Cepheid periods and an iterative fit to the P–L relation. These crowding corrections represent the difference, in units of source magnitudes, between the measurement of the source on a uniform background and on the speckled background, determined statistically from the level of nearby sources. The results from these measurements were similar to the two galaxies in R23 with a mean across all hosts of 0.04, 0.07, and 0.09 mag for F090W, F150W, and F277W, respectively. These corrections are approximately 7 times smaller than the same quantities for HST in F160W. The random errors derived from the artificial stars ranged from 0.06 mag (NGC 1448) to 0.14 mag (NGC 5468) in F090W and 0.09 mag (NGC 1448) to 0.16 mag (NGC 5468) in F150W. These distributions are slightly asymmetric in F090W and fairly symmetric in F150W and F277W.
3. Analysis
The Cepheids we report on were discovered between 5 and 20 yr ago by the SH0ES team using ∼12 epochs of optical imaging from HST, providing a measurement of their periods, amplitudes, and photometry in WFC3 F555W, F814W, and F160W (Hoffmann et al. 2016; Riess et al. 2022). However, the typical period uncertainty is ∼2% (Yuan et al. 2021), so knowledge of their phases elapses after just a few of years, and certainly by the time of our JWST observations. In order to recover their phases, we analyzed the change in the Cepheid magnitudes between the two epochs following the methods given in R23; we show an example of the relation between the change in magnitude and phase for the Cepheids in one of our hosts, NGC 5643, in Figure 5. The phase uncertainty for individual Cepheids is a function of the difference in phase (determined by the Cepheid period) for the two epochs. We note that the difference photometry between two epochs has less noise than the sum of the two epochs because some of the sources of error, such as the crowding term, are correlated between the two epochs. The determination of phase (discussed in R23) also provides a magnitude uncertainty that takes into account the quality of the phase constraint.
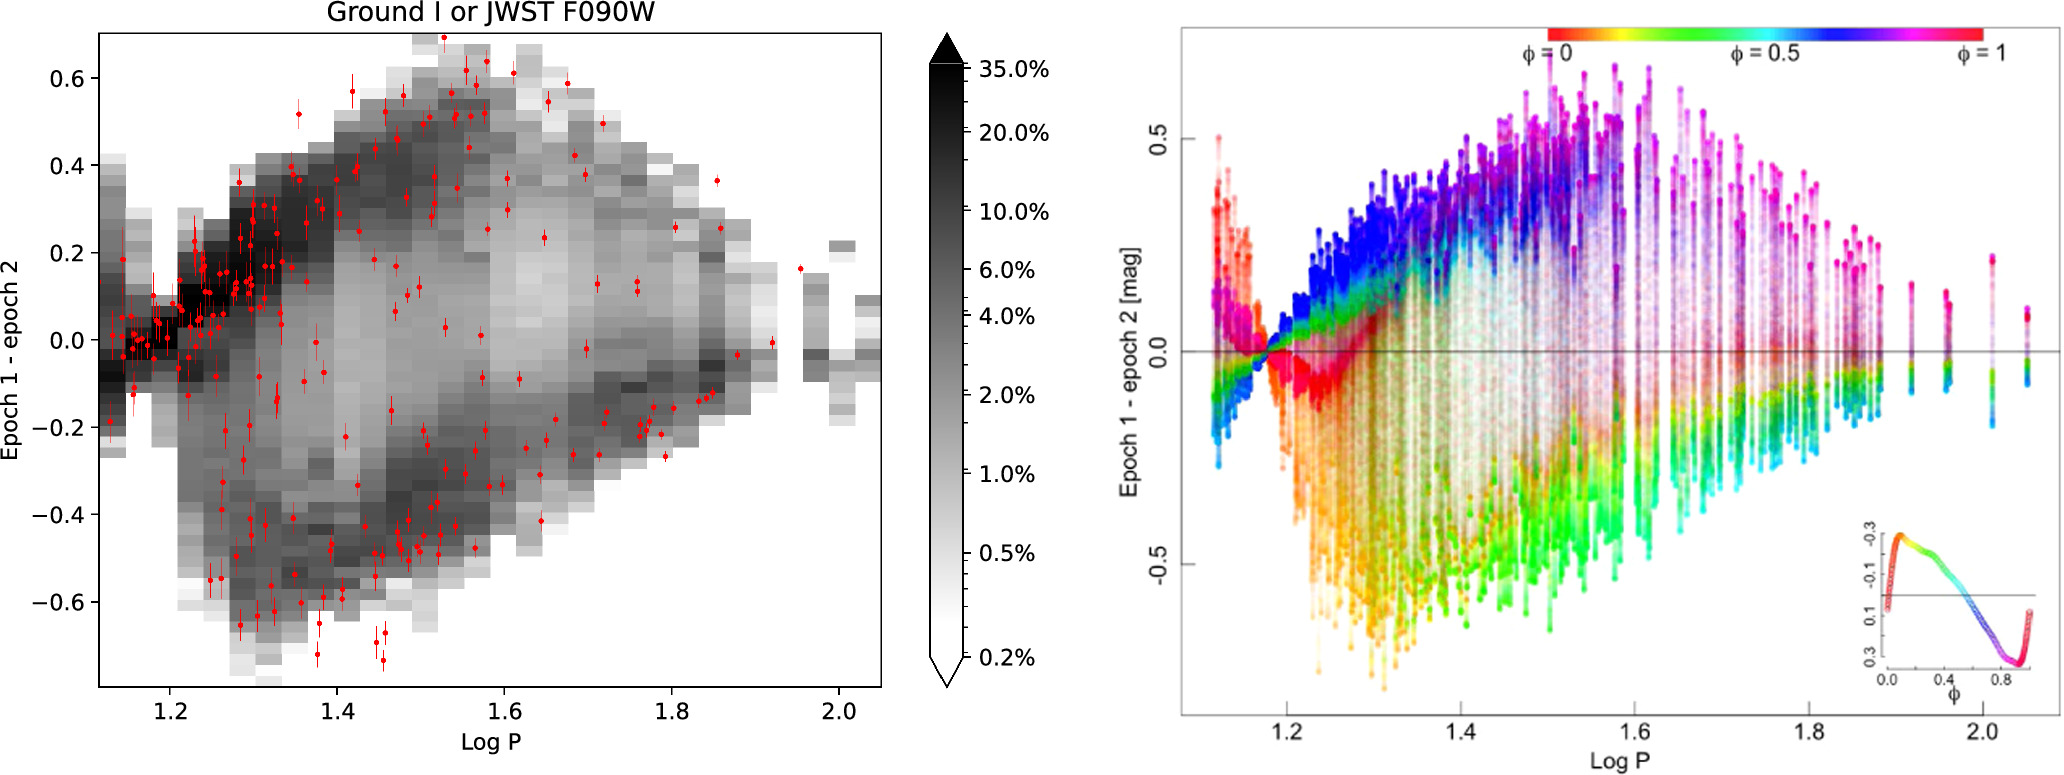
Figure 5. Magnitude differences of two epochs for Cepheids in NGC 5643 in F090W (red points, left) and simulated (gray left and indicating phase, right). Gray density shows expected frequency of sampling based on random phase and template light curves. Red points are measurements from JWST and the errors do not include the crowding error which effectively cancels in the difference. The asymmetry of Cepheid light curves in F090W produces structure in this diagram that can be used to constrain the phase. The log of the time interval between epochs produces a negligible difference at a value of  1.34.
1.34.
Download figure:
Standard image High-resolution imageThe phase-corrected photometry is provided in Table 2 and includes the combined error terms (from artificial stars, shot noise, empirical determination of the phase, and intrinsic width of the instability strip). We show monochromatic P–L relations for each measured filter in Figure 6.
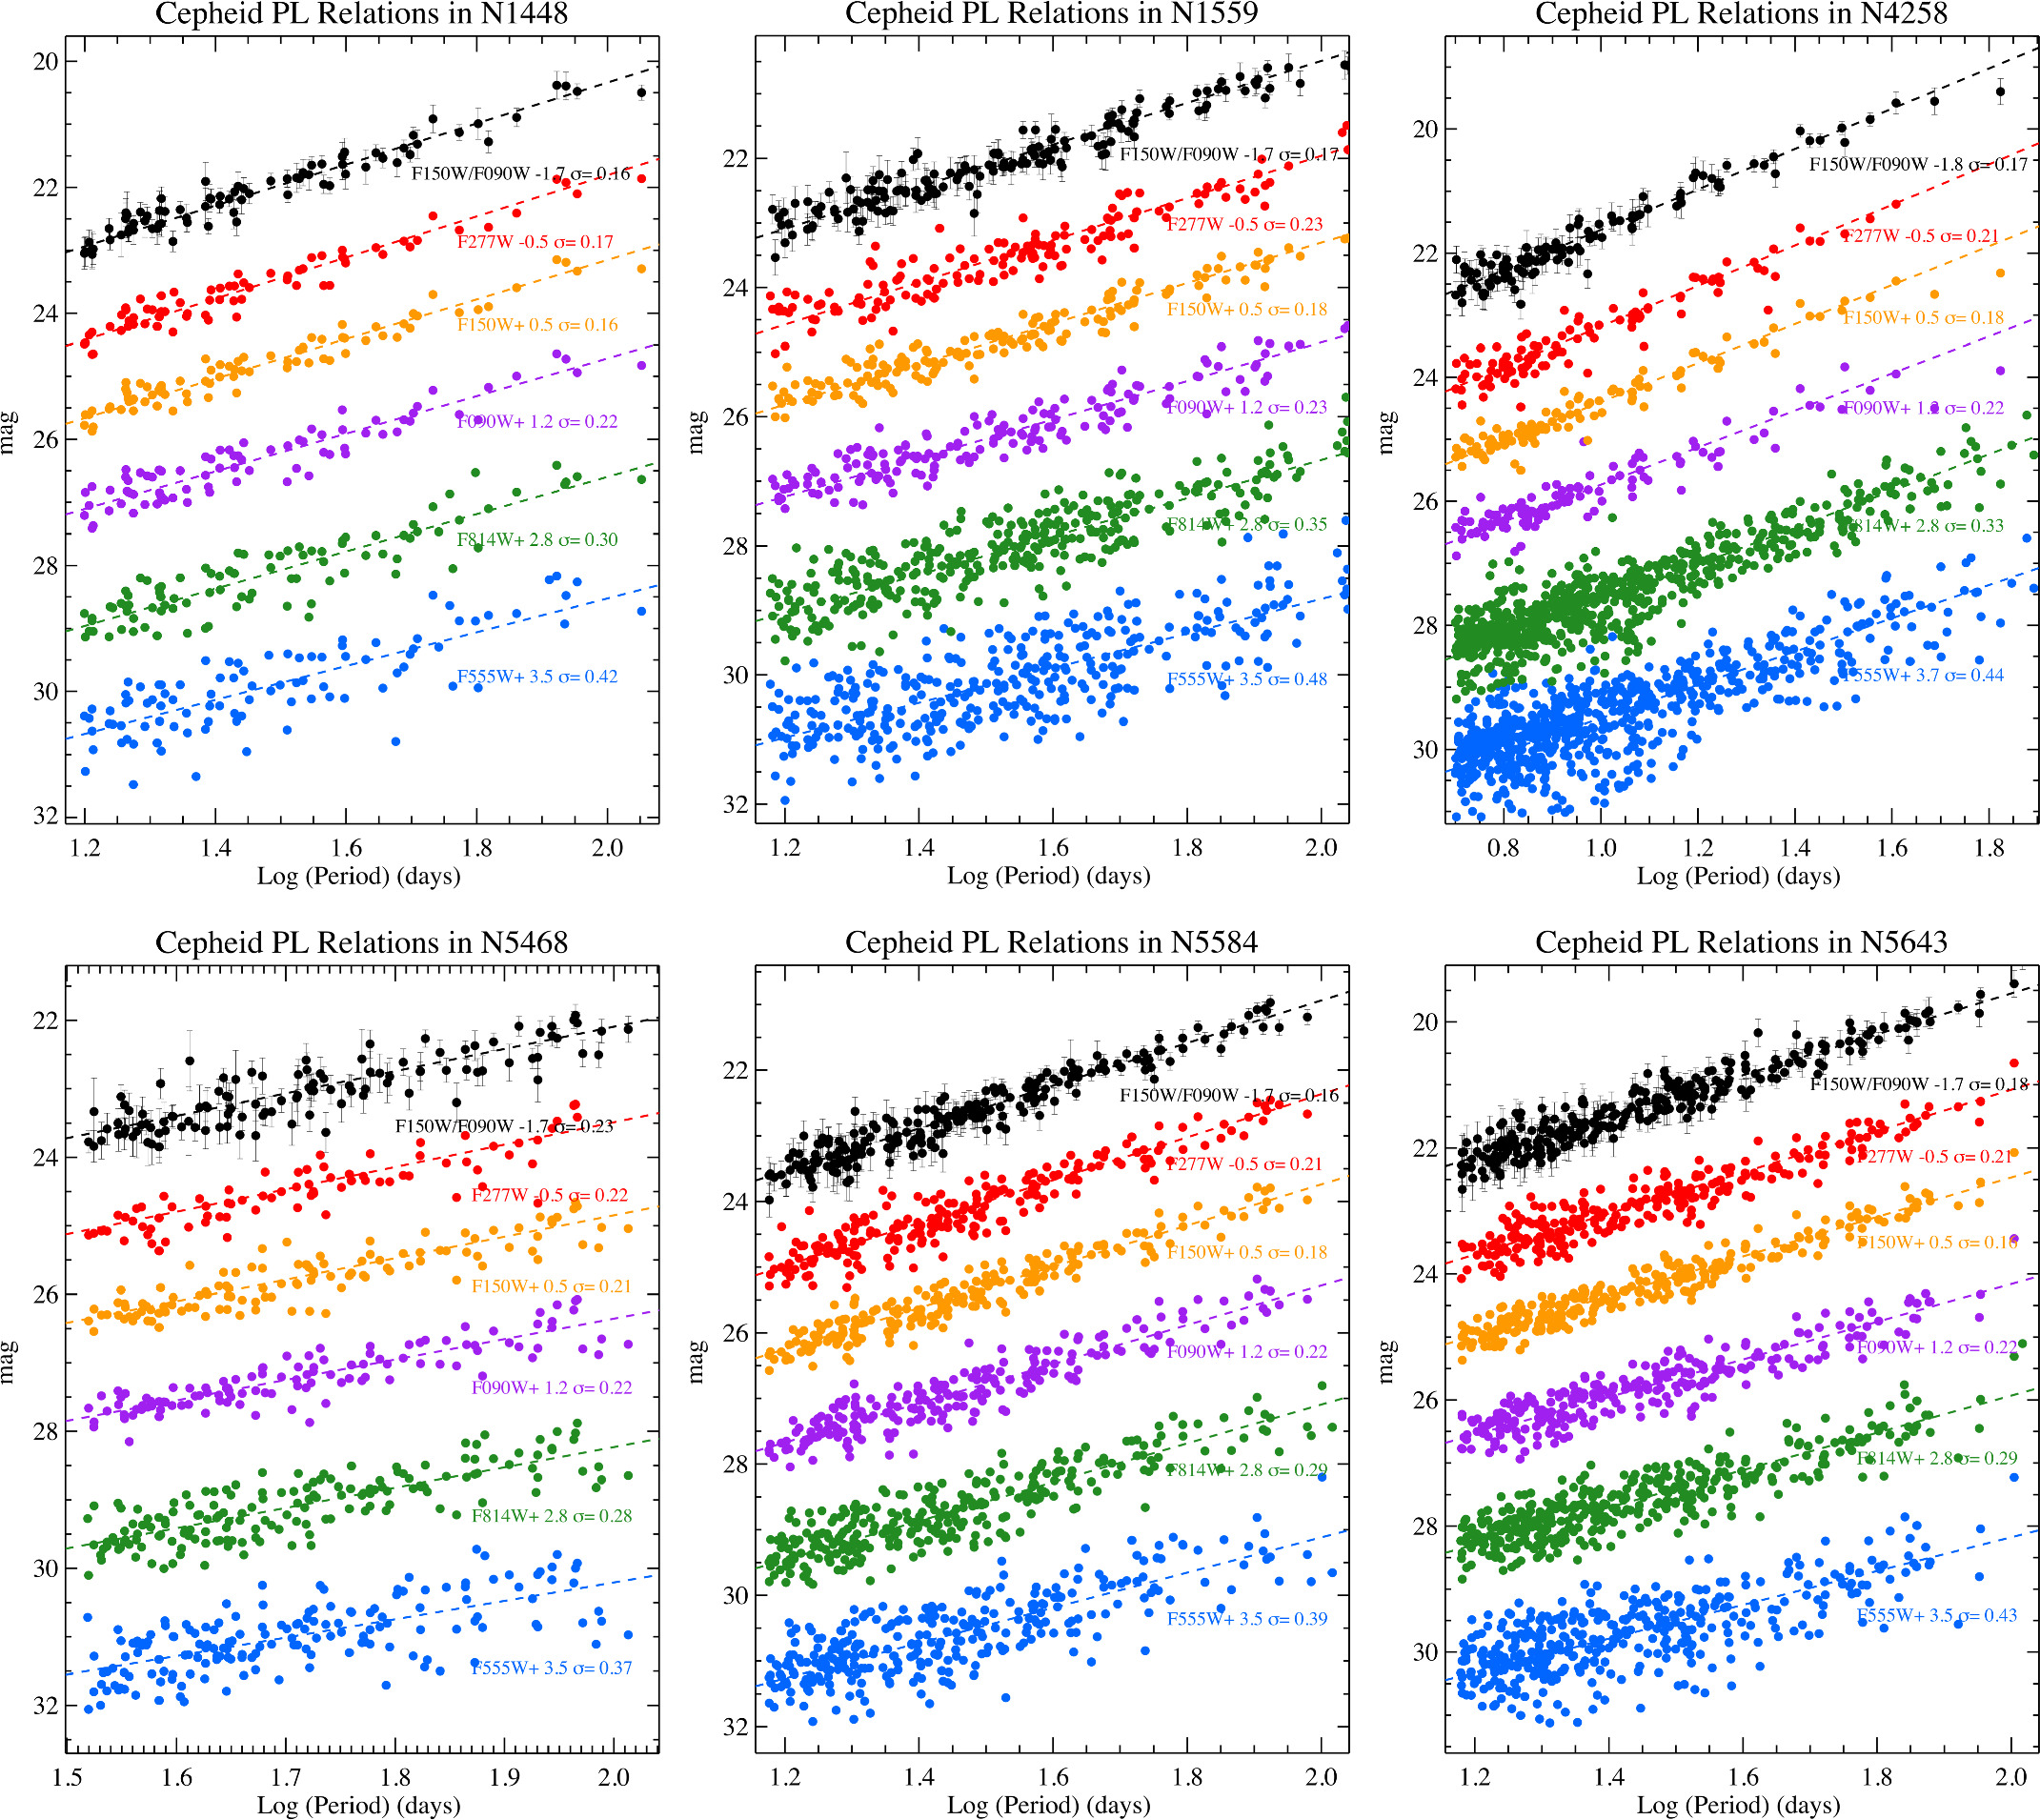
Figure 6. P–L relations for four new SN Ia hosts—NGC 1448 (top left), NGC 1559 (top center), NGC 5468 (bottom left), and NGC 5643 (bottom right)—and for the two galaxies presented in R23—NGC 4258 (bottom right) and NGC 5584 (bottom center). Relations are plotted from bluest (bottom) to least reddened (top). The bottom two relations in each panel are from HST while the others are from JWST. The top relation in each panel, plotted in black, is a dereddened or Wesenheit magnitude, F150W −0.72(F090W–F150W). Magnitude offsets are applied as indicated for ease of view and the dispersion for each P–L is given.
Download figure:
Standard image High-resolution image3.1. Reddening-corrected Period–Magnitude Relation
Although reddening in the NIR is small compared to the optical, it is not negligible. Therefore we make use of three dereddened (or Wesenheit) magnitude systems chosen to make the best use of the JWST data. These are derived from combinations of six filters, three HST WFC3 bands, F555W, F814W, and F160W (R22), and three JWST NIRCam bands, F090W, F150W, and F277W. The relations are
- 1.JWST+HST NIR, (baseline):
 F150W −0.41(F555W−F814W);
 - 2.JWST NIR: F150W −0.72(F090W−F150W);
- 3.JWST MIR: F277W −0.30(F090W−F150W).

By design these minimize extinction and temperature width effects in the instability strip, aiding in distance measurements by using a color term, R, which we derive from the Fitzpatrick (1999) reddening law (RV
= 3.3; see Brout & Riess (2023) for further explanation). The SH0ES team previously used an HST-only formulation of the baseline relation,  F160W −0.39( F555W−F814W); the JWST+HST NIR system is very similar but crucially substitutes F150W for F160W. This change allows for the most direct comparison with past HST measurements, reducing NIR confusion noise in past HST data while leaving the wavelengths measured constant. The color F555W−F814W is well measured due to the high resolution of HST WFC3-UVIS and strong contrast between Cepheids and red giants in the optical as seen in Figure 4. The low value of R demonstrates that F150W is subject to only modest extinction. We also analyze two other filter combinations that are independent of the HST measurements of color. The JWST mid-infrared (MIR) system further reduces the impact of extinction by referencing the Cepheids to 2.8 μm.
The mean slope of the mH W P–L relation has been well measured with HST to lie in the range of −3.26 to −3.30 mag dex−1 (Riess et al. 2016, 2019, 2022). The mean of these six hosts from the HST measurements is −3.26±0.05. In principle we expect a slightly shallower slope by ∼0.01 mag dex−1 when substituting HST F160W (λeff = 1.53 μm) for JWST F150W (λeff = 1.50 μm) due to the larger color term. The strongest constraints on the slope come from the LMC due to its large measured period range and low dispersion (Riess et al. 2019). For our baseline we use −3.25, near the mean of the JWST sample, which is −3.21±0.03, and the HST constraint and propagate an uncertainty of 0.05 mag dex−1 in the slope to the summary results. We also include variants of the fits, which set the slope to −3.20 and −3.30.
Table 2. Photometric Data for Cepheids
| Host | ID | R.A. | Decl. | log P | F090W | σ | F150W | σ | F277W | σ | V−Ia | σ |
|---|---|---|---|---|---|---|---|---|---|---|---|---|
| N5584 | 96196 | 215.58141 | −0.38763 | 1.2434 | 26.175 | 0.115 | 25.549 | 0.111 | 25.367 | 0.140 | 0.957 | 0.117 |
| N5584 | 114600 | 215.58182 | −0.39029 | 1.2317 | 26.505 | 0.130 | 25.765 | 0.129 | 25.641 | 0.159 | 0.897 | 0.158 |
| N5584 | 115209 | 215.58295 | −0.38981 | 1.2015 | 26.598 | 0.138 | 25.940 | 0.173 | 25.783 | 0.198 | 0.817 | 0.157 |
| N5584 | 134727 | 215.58605 | −0.39115 | 1.2538 | 26.364 | 0.159 | 25.480 | 0.186 | 25.245 | 0.207 | 1.126 | 0.189 |
Notes.
a F555W-F814W. We note the provided magnitudes from JWST are phase corrected.Only a portion of this table is shown here to demonstrate its form and content. A machine-readable version of the full table is available.
Download table as: DataTypeset image
3.2. Baseline Results
In Table 3 we provide the fits to the Cepheid P–L relations in each host for the baseline system with the NIR measurements from JWST versus HST (SH0ES). We fit a common formulation,

where the zero-point or intercept,  , where μ0 is the distance modulus and
  is the absolute magnitude of a Cepheid with
  . The term ZW
is the Cepheid metallicity dependence in this system (−0.21 mag dex−1; Breuval et al. 2022; Riess et al. 2022) and we provide the product of this times the difference from solar metallicity, [O/H], in Table 3 for each host. Because the Cepheids have near-solar metallicity, with measured [O/H] ∼ 0, these metallicity corrections are very small; their typical value is ∼0.01–0.02 mag. We include them for consistency when comparing with previous results from HST. We also include a variant where we set the metallicity term to zero and with double the nominal term.
. The term ZW
is the Cepheid metallicity dependence in this system (−0.21 mag dex−1; Breuval et al. 2022; Riess et al. 2022) and we provide the product of this times the difference from solar metallicity, [O/H], in Table 3 for each host. Because the Cepheids have near-solar metallicity, with measured [O/H] ∼ 0, these metallicity corrections are very small; their typical value is ∼0.01–0.02 mag. We include them for consistency when comparing with previous results from HST. We also include a variant where we set the metallicity term to zero and with double the nominal term.
Table 3. Baseline HST and JWST Cepheid P–L Fits
| JWST+HST NIR | HST NIR (SH0ES) | JWST-HST | ||||||||||||||
|---|---|---|---|---|---|---|---|---|---|---|---|---|---|---|---|---|
| Host | Metal | Slope | N | zp | σ | SD | μ | σc | N | ZP | σ | SD | μ | σc | Δ | σ |
| n4258 | −0.018 | −3.25 | 107 | 26.739 | 0.017 | 0.160 | ⋯ | ⋯ | 442 | 26.739 | 0.017 | 0.442 | ⋯ | ⋯ | ⋯ | ⋯ |
| n5584 | −0.022 | −3.25 | 214 | 29.178 | 0.011 | 0.170 | 31.838 | 0.020 | 185 | 29.168 | 0.032 | 0.449 | 31.828 | 0.037 | 0.010 | 0.042 |
| n5643 | 0.029 | −3.25 | 270 | 27.861 | 0.011 | 0.166 | 30.520 | 0.020 | 251 | 27.859 | 0.028 | 0.424 | 30.518 | 0.033 | 0.002 | 0.039 |
| n1559 | 0.003 | −3.25 | 158 | 28.712 | 0.015 | 0.191 | 31.371 | 0.023 | 110 | 28.813 | 0.041 | 0.471 | 31.473 | 0.045 | −0.102 | 0.050 |
| n5468 | −0.020 | −3.25 | 112 | 30.316 | 0.019 | 0.227 | 32.975 | 0.026 | 93 | 30.398 | 0.049 | 0.463 | 33.058 | 0.052 | −0.083 | 0.058 |
| n1448 | −0.022 | −3.25 | 76 | 28.630 | 0.017 | 0.168 | 31.289 | 0.024 | 72 | 28.577 | 0.029 | 0.348 | 31.236 | 0.034 | 0.053 | 0.042 |
Note. R22 Table 6 μN5584 = 31.772 ± 0.052 based on three anchors and P > 18 days; here we use only one anchor, NGC 4258, and P > 15 days to allow a direct comparison. To allow a direct comparison with JWST+HST NIR, we applied a transformation of F150W–F160W = 0.033+0.036(F555W–F814W-1) which adds 0.03–0.04 for most hosts, and corrected here for CRNL by the subtraction of 0.035 mag for all hosts, the two corrections canceling to <0.01 mag with no impact on distance.
a Error does not include geometric distance uncertainty for NGC 4258 of ± 0.032.Download table as: ASCIITypeset image
We determine the intercepts within the JWST+HST NIR magnitude-system P–L relations from the weighted mean after applying an iterative 3σ clip (set by Chauvenet's criterion), which removes ∼3% of sources (∼30 Cepheids out of ∼1000, a comparable fraction to past studies such as R22). We note that the empirical rejection is applied to the full Cepheid sample discovered in the optical, so this is lieu of that imposed by the HST NIR data in R22. Because our uncertainties are well determined and nonuniform we apply rejection as an individual Cepheid contribution to the P–L, χ2 > 32. We also provide results with no rejection. Table 4 provides summary results for the full sample including the mean P–L dispersion. The small dispersion for the JWST relations makes the small number of outliers quite evident, as on average they are ∼5σ off the P–L.
Table 4. Results
| Sample | Comment | P–L | σ- | Cepheids | SD |

| JWST | σ |
|---|---|---|---|---|---|---|---|---|
| Slope | Clip | −HST | ||||||
| JWST+HST NIR | Baseline | −3.25 | 3 | 938 | 0.178 | 1.0 | −0.011 | 0.032 |
| JWST+HST NIR | σ-clip | −3.25 | no | 966 | 0.218 | 1.7 | 0.017 | 0.031 |
| JWST+HST NIR | no min P or σ-clip | −3.25 | no | 1005 | 0.222 | 1.7 | 0.015 | 0.031 |
| JWST+HST NIR | P > 15 days | −3.25 | 3 | 870 | 0.181 | 1.1 a | −0.020 | 0.043 |
| JWST+HST NIR | shallower slope | −3.20 | 3 | 938 | 0.179 | 1.1 | −0.010 | 0.032 |
| JWST+HST NIR | steeper slope | −3.30 | 3 | 937 | 0.179 | 1.1 | −0.008 | 0.032 |
| JWST+HST NIR | no metallicity cor. | −3.25 | 3 | 937 | 0.178 | 1.0 | −0.005 | 0.032 |
| JWST+HST NIR | double metal cor. | −3.25 | 3 | 939 | 0.179 | 1.0 | −0.016 | 0.032 |
| JWST+HST NIR | and in SH0ES F160W | −3.25 | 3 | 611 | 0.172 | 1.1 a | 0.014 | 0.035 |
| JWST+HST NIR | no phase correction | −3.25 | 3 | 941 | 0.191 | 1.0 a | −0.007 | 0.033 |
| JWST+HST NIR | least JWST crowding half | −3.25 | 3 | 487 | 0.165 | 1.1 a | −0.023 | 0.035 |
| JWST+HST NIR | highest JWST crowding half | −3.25 | 3 | 451 | 0.201 | 0.9 a | −0.006 | 0.040 |
| JWST+HST NIR | first epoch only | −3.25 | 3 | 821 | 0.224 | 1.0 a | −0.007 | 0.036 |
| JWST NIR | F090W,F150W | −3.25 | 3 | 929 | 0.177 | 1.0 | −0.012 | 0.032 |
| JWST MIR | F090W,F150W,F277W | −3.25 | 3 | 864 | 0.197 | 1.0 | −0.030 | 0.033 |
Note.
a These variants affect the errors as well as magnitudes or sample so is not directly comparable.
Download table as: ASCIITypeset image
The fits are remarkably tighter than those measured with HST as seen in Figure 7, an expectable (but still impressive!) direct consequence of the improved telescope resolution (see R23; their Figure 1 for sources of noise in P–L relations). We see a consistent reduction in dispersion by a factor of 2.5 to a mean of ≤0.18 mag, with the three closest at 0.16–0.17 mag. Only NGC 5468 has a dispersion > 0.2 mag, a consequence of its 1.5 mag greater distance and relatively shorter exposure time. We determine distances to the SN hosts by using the geometric distance determination of NGC 4258 (Reid et al. 2019) μ0,N4258 = 29.397 mag and the intercept difference between the SN hosts and NGC 4258, i.e.,

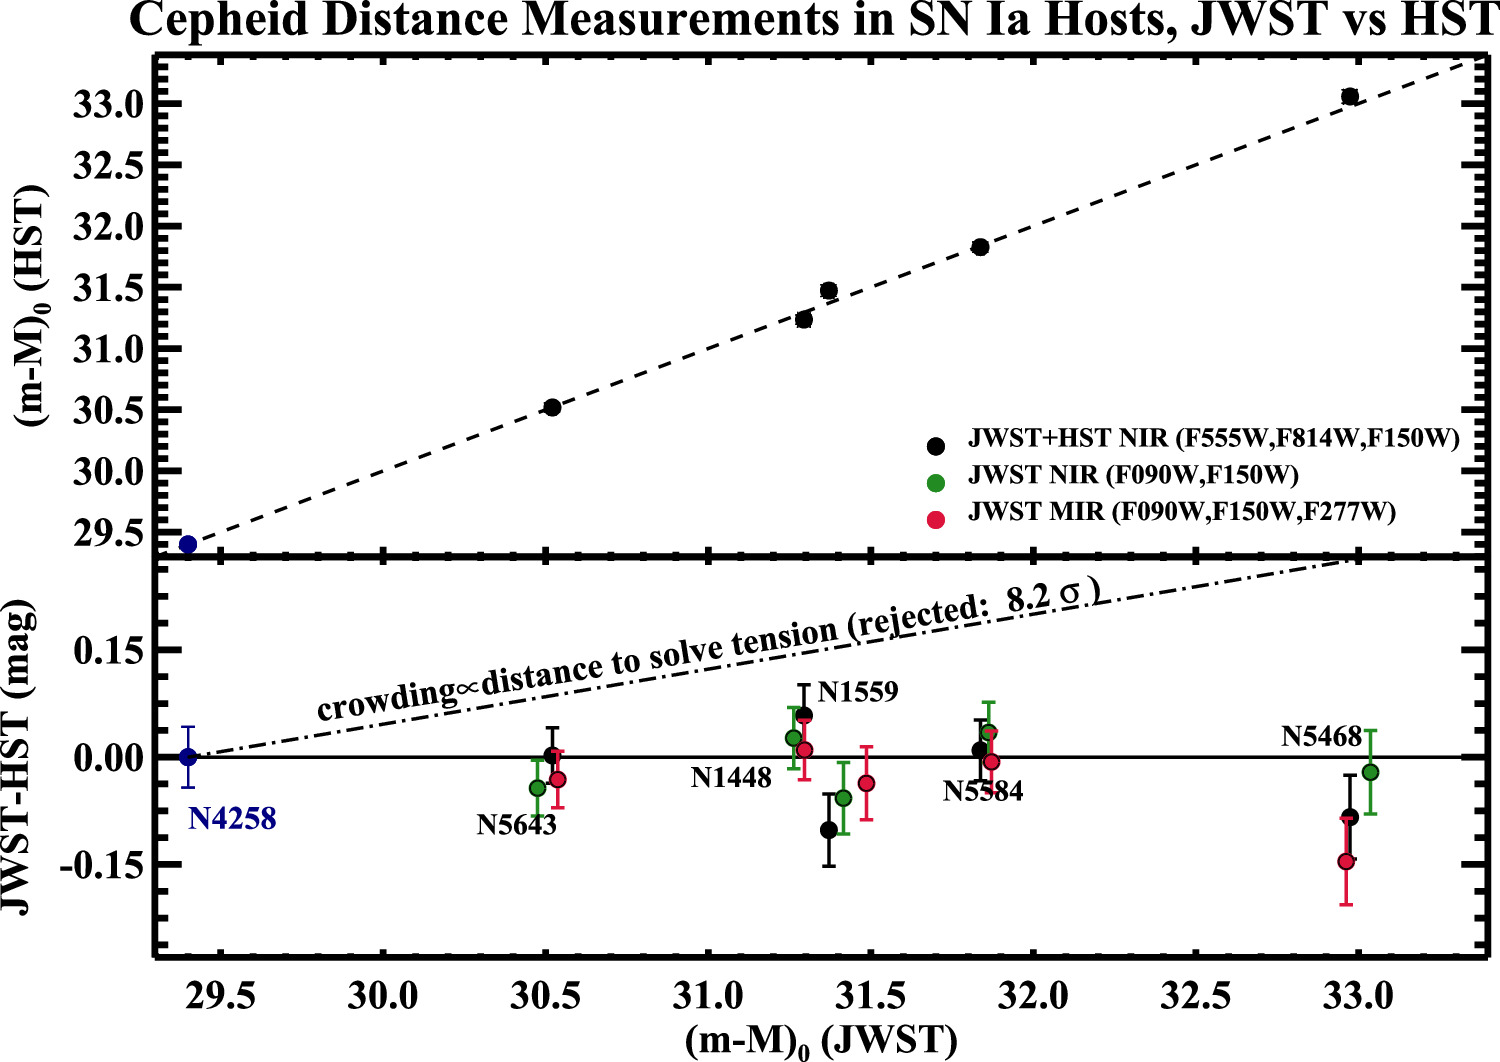
fit from the P–L relations. The measured distances from the baseline systems are given in Table 3 with differences between HST and JWST, also plotted in Figure 8. The baseline mean difference, JWST−HST, seen in Table 4, is −0.011 ± 0.032 mag. 9 This uncertainty receives nearly equal contributions from three terms of size ∼0.02 mag: the intercepts of NGC 4258 measured with HST and with JWST, and the mean of the SN host period-luminosity relations. The latter term comes mostly from the HST intercept uncertainties, which are 3 times the size of the JWST means. The similarity of the NGC 4258 P–L error terms results from the combinations of smaller dispersion for JWST (0.16 versus 0.44 mag) balanced by the smaller JWST sample (N = 107 versus N = 442; more fields observed with HST), which may be remedied in the future with more JWST pointings for NGC 4258.
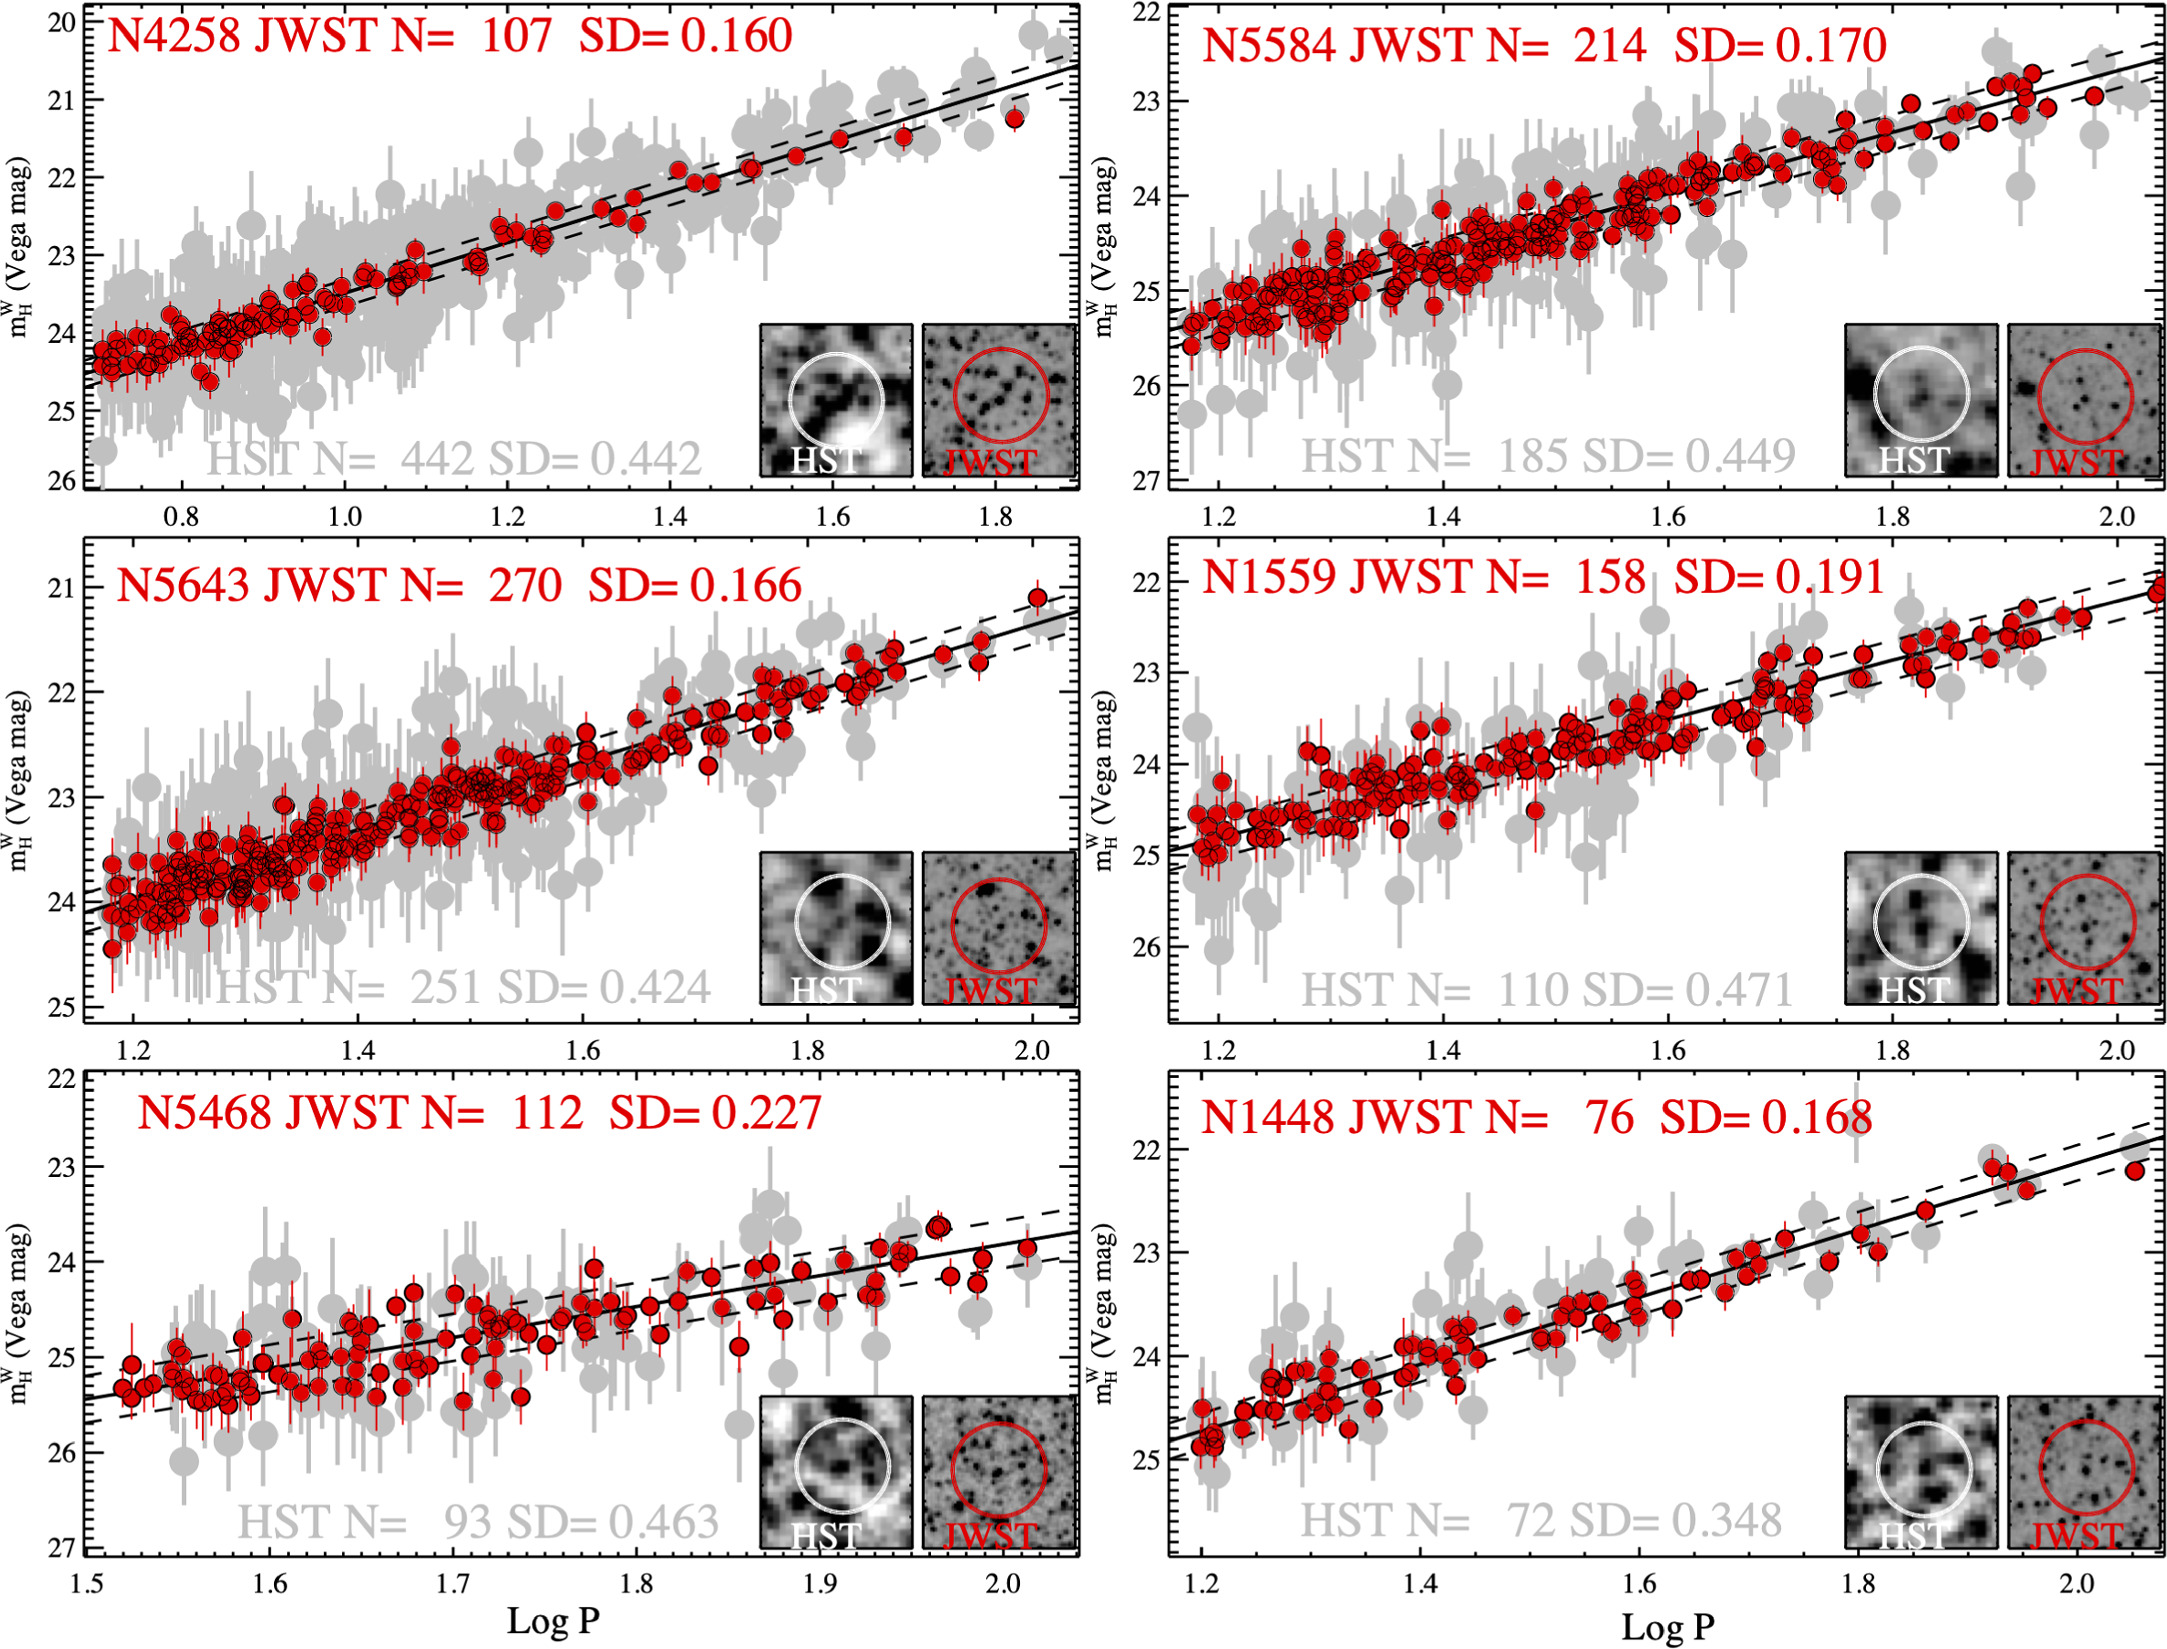
Figure 7. Comparison between the standard (SH0ES: R22) dereddened magnitude mH W period–magnitude relation used to measure distances to SN Ia hosts. The red points use JWST F150W (λeff = 1.50 μm) and the gray points are from HST F160W (λeff = 1.53 μm), including a small transformation F150W–F160W = 0.033 + 0.036[(V − I) − 1.0] to account for the differences in these passbands.
Download figure:
Standard image High-resolution image
Figure 8. Comparison of distances to the five SN Ia hosts measured with HST and JWST anchored by the same geometric distance reference, NGC 4258. The lower plot shows the differences in the measurements from the two telescopes. Black shows the comparison for the baseline system used to measure H0,  and is the only system plotted on the top panel. Green and red shows comparisons with two JWST-only magnitude systems. The bottom plot shows a hypothetical, linear model of unrecognized crowding tuned to match the Hubble tension, 5log(73/67.5) = 0.17 mag at the mean distance of the SH0ES sample, μ = 31.7, a trend of 0.07 mag per magnitude of distance modulus beyond NGC 4258. This model is ruled out at 8.2σ.
Download figure:
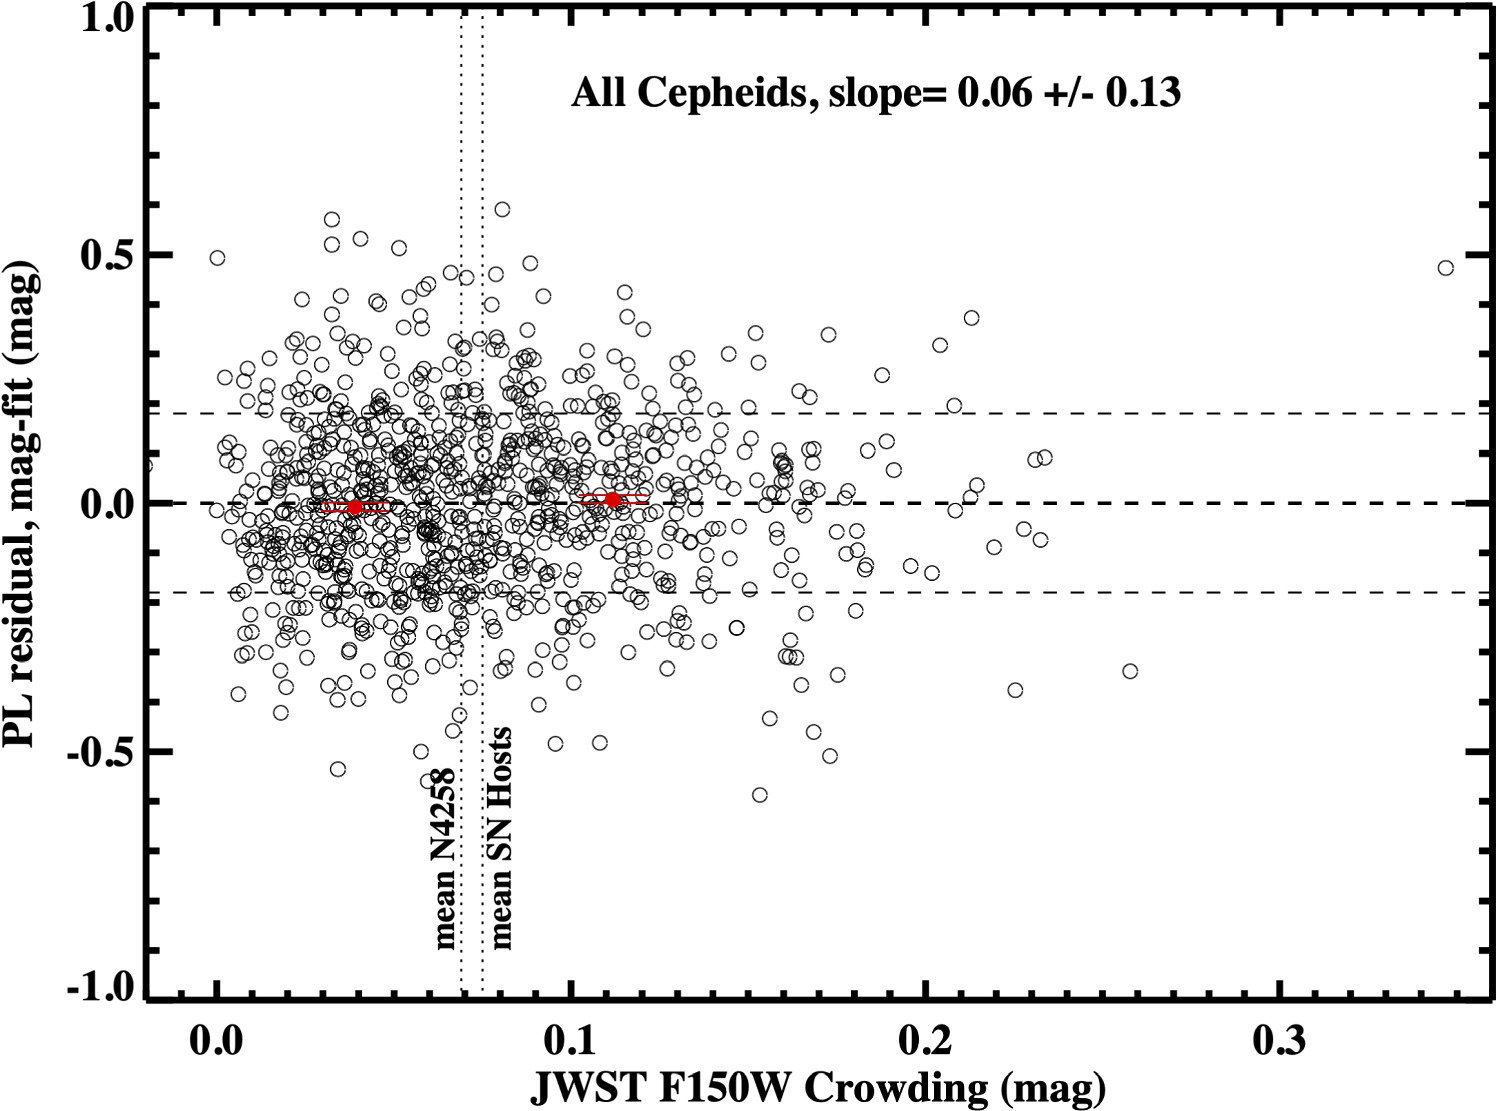
Standard image High-resolution imageRegressing all JWST crowding corrections versus the residuals from their best-fit P–L relations (see Figure 9), we find no interdependence between these quantities. The best-fit value of 0.06 ± 0.13 mag (residual) / mag (crowding) implies that at the mean crowding of the JWST sample (∼0.07 mag) the mean P–L bias is 0.004 ± 0.008 mag. This determination provides a useful estimate of the level of error that would apply when comparing this Cepheid photometry to that of Cepheids in the closest hosts, such as the Milky Way and the LMC, where crowding is absent.

Figure 9. Relation between the F150W P–L fit residuals and crowding, as measured in JWST F150W frames as the difference between artificial star input and extraction. We find no dependence between these quantities. Red points and errors shown the mean results if dividing the sample in half. The mean level of crowding in NGC 4258 and the SN hosts are indicated by vertical lines. The scatter is evenly split as coming from phase uncertainty, crowding (at JWST resolution) with smaller contributions from the width of the instability strip.
Download figure:
Standard image High-resolution imageWe can attempt to gain additional leverage in the JWST versus HST comparison by factoring in the distances of the hosts. For this purpose it is useful to devise a hypothetical model in which unrecognized crowding in Cepheid photometry measured with HST resolution grows linearly with distance (modulus) beyond the calibration from NGC 4258 to cause the Hubble tension, i.e., a size of  mag at the mean distance modulus of the SH0ES Cepheid sample (μ0 = 31.7 mag), equivalent to ∼0.07 mag of bias per magnitude of distance modulus. This model is shown in Figure 8. We can reject this model at 8.2σ with the highest leverage from the farthest host, NGC 5468 (μ0 = 33.0), which shows no evidence of such an effect. Indeed, the evidence we see against crowding as the source of the tension is now greater than the evidence of the tension itself. As is, we see no evidence of a growing difference between HST and JWST with distance as would be required for such a model.
3.3. Baseline Variants
In Table 4 we provide the previously discussed variants to the measurement process as well as additional variants which exclude the phase correction, use only Cepheids with HST F160W observations (the WFC3-IR field of view is smaller than the optical WFC3-UVIS field where the Cepheids were found and which reduces the sample size), and split the sample into the more and less crowded halves (where the DOLPHOT crowding parameter is above or below the sample median). This latter test is meant to mimic the subselection of Cepheids by those that appear visually least crowded with JWST resolution, as proposed in Freedman & Madore (2023) for host NGC 7250 (see also the Appendix). This produces a significant difference in sample mean dispersion, namely ∼0.17 mag for the less crowded half and ∼0.20 mag for the more crowded half, but only a 0.015 ± 0.053 mag difference in H0 between them. Although the difference is small, this selection has the potential to bias the remaining sample because it is enacted on the appearance of the source, which may include unresolved blending rather than the statistical properties of the scene. For example, a coincidental superposition of a source with the Cepheid would appear to be uncrowded and yet would suffer a bias whose size would be seen with artificial star measurements. Another likely consequence of imposing a selection is the skewing of distributions of measurements relative to the expected errors as suggested in the values of χ2. We caution that any subselection of the Cepheid sample needs to be simulated and included in artificial star selection to avoid bias in either measurements or errors (see further discussion in R23).
We also determined the results for a single epoch (the first); this provides useful information on the dispersion of the P–L relation when no phase information is available. The single-epoch solution yields standard deviation (SD) = 0.224 mag versus SD = 0.178 for two epochs and phase corrected (plus an additional 100 Cepheids with only a single epoch), a 25% reduction in dispersion or equivalent weight to a 70% increase in the sample size (58% from the scatter and 12% more objects). With perfect measurements, a single random phase at this wavelength will produce ∼0.15 mag scatter, two random phases reduces this to ∼0.11 mag, and two phase-corrected magnitudes to ∼0.075 mag. We note that most of these variants are not statistically independent of each other, as they use the same Cepheid samples and measurements. As all variants and tests yield results consistent with the baseline, we consider the baseline results robust.
We also provide the summary results from the other two filter combinations based purely on JWST measurements, JWST MIR and JWST NIR as shown in Figure 8. These yield very similar results to the baseline.
4. Discussion
The sample of observations of ∼1000 Cepheids with JWST in five hosts of eight SNe Ia and in NGC 4258 provides very strong evidence that NIR HST Cepheid photometry is accurate, albeit noisier than from JWST. While this may not be surprising since past observations used artificial stars to correct for crowding, the search for an explanation of the Hubble tension merits a broad array of investigations including independent checks on Cepheid photometry.
Although the sample of Cepheids remeasured with JWST and presented here represents nearly a third of the full SH0ES sample, we refrain from providing a value of H0 determined exclusively from the JWST data because the sample size of calibrated SN Ia and independent geometric anchors is substantially inferior to what is available in R22. The true value of the JWST data provided here is to provide a high-fidelity test of the HST Cepheid measurements.
Additional JWST observations of some Cepheids in the SH0ES host sample are available from other Cycle 1 programs. These observations are more difficult to compare directly with HST observations because of the respective program design; however, they appear broadly consistent with the conclusions found here and in R23. Yuan et al. (2022a) presented a comparison of Cepheids in NGC 1365 from program GO-2107 (PI Lee) with NIRCam F200W. They obtained a similar result as the current program, albeit with lower significance, partly because the observations were not ideal for this purpose due to the very different wavelength than HST F160W and limited depth. We analyzed the first set of observations by program GO-1995 (PI Freedman), the only nonproprietary set at the time of writing, of the SH0ES host NGC 7250 observed in F115W and F444W and discussed in Freedman & Madore (2023). NGC 7250 is one of the smallest hosts in the sample in terms of physical size and has the lowest mass and the HST-based analysis by Riess et al. (2022) includes only 21 Cepheids, about 8 times less than the average host in this work. Consequently, the comparison between HST and JWST for NGC 7250 is limited in precision by the±0.13 mag error from the HST intercept. The comparison is further limited by the lack of more than one epoch to determine phase corrections for JWST and the large difference between JWST and HST filters (λeff = 1.15 versus 1.53 μm) necessitating a larger photometric transformation of ∼0.4−0.5 mag, which at present can only be obtained from model spectral energy distributions (SEDs). Nevertheless, a comparison of the JWST and transformed HST observations of NGC 7250, presented in the Appendix, are consistent at the ∼1.1σ level, with JWST brighter than HST (the direction of decreasing the distance to the host and increasing H0).
4.1. Outlook
The Cepheid measurements from HST have passed a very strong test of their accuracy provided by the resolution of JWST. At this point, a solution to the Hubble tension is most likely to exist elsewhere, because the evidence against a bias in HST Cepheid photometry is greater than the evidence of the tension itself.
We anticipate related improvements afforded by the remarkable capabilities of JWST. Specifically, we expect additional calibrations of SNe Ia from enhancements to the primary distance indicators of TRGB, JAGB, and Miras, as well as Surface Brightness Fluctuations. We suggest the most effective manner of comparing these distance indicators is by using them to measure the distance to the same set of hosts rather than by comparing values of H0, which necessarily involves additional rungs and potentially unrelated differences. Tying all of these together by observing large samples in common can lead to the calibration of ∼100 SNe Ia and a <1% local measurement of H0, a landmark in our quest to understand the expansion of the Universe.
Acknowledgments
We are indebted to all of those who spent years and even decades bringing JWST to fruition. This research made use of the NASA Astrophysics Data System. We thank Martha Boyer, Yukei Murakami, and Siyang Li for helpful conversations related to this work. We thank our PC Alison Vick. We thank an anonymous referee for improving the draft. Please contact us if you have any questions or if something does not make sense.
Some of the data presented in this paper were obtained from the Mikulski Archive for Space Telescopes (MAST) at the Space Telescope Science Institute. The specific observations analyzed can be accessed via doi:10.17909/17eb-qz46.
We acknowledge support from JWST GO-1685. R.I.A. is funded by the SNSF via an Eccellenza Professorial Fellowship PCEFP2_194638 and acknowledges support from the European Research Council (ERC) under the European Union's Horizon 2020 research and innovation program (grant Agreement No. 947660). This research was supported by the Munich Institute for Astro-, Particle and BioPhysics (MIAPbP), which is funded by the Deutsche Forschungsgemeinschaft (DFG, German Research Foundation) under Germany's Excellence Strategy—EXC-2094—390783311.
Appendix: Cepheids in NGC 7250
We retrieved the JWST NIRCam observations of NGC 7250 from program 1995 (PI Freedman) from the MAST archive, calibration version 1130.pmap. We found the Cepheid observations in F444W (4.4 μm) to be of poor resolution due to the broad PSF and poor contrast between the Cepheids and red giants so we did not analyze them. Cepheids from the sample from Hoffmann et al. (2016) and Riess et al. (2022) were well detected in F115W and we measured their photometry with DOLPHOT following the same steps discussed above. Unfortunately a second useful color from JWST was not available to apply a similar color quality cut as employed here and only a single epoch was obtained so we could not measure phase corrections. Also, the JWST filter F115W (λeff = 1.15 μm) is quite different than the HST filter F160W (λeff = 1.53 μm) with no overlap, so unlike our comparisons with JWST F150W presented above, quantifying the difference requires a rather large, SED model-dependent (and hence uncertain) color transformation between the filters, equivalent to inferring the J − H colors of a Cepheid from these models. We used the Padova isochrone SED models to provide a synthetic relation between colors, F160W=F115W +0.41 ± 0.05 + 0.49(F555W−F814W −1) for Cepheid like SEDs, i.e., typical Cepheids with F555W−F814W∼1 must be offset by ∼0.4–0.5 ± 0.05 mag to compare between the telescopes. We identified 27 Cepheids in F115W from the optical sample of 40 (with minimum completeness LogP >1.25) from Hoffmann et al. (2016) using the same procedure as in Section 3. We used a 2.5σ clip (appropriate for this small sample size of N ≤ 40 by Chauvenet's criterion) for both the JWST and HST samples as shown in Figure 10. The clip rejected 2 of the 27 in the JWST set and 1 of the 21 Cepheids in NGC 7250 provided in Riess et al. 2022, ID = 65093 with P = 82.1 days. The 25 that remained for JWST have a dispersion of 0.29 mag (see Figure 10). Given the small Cepheid sample size, larger P–L dispersion, and large filter difference, we can only conclude the P–L relations are broadly consistent (JWST brighter than HST by 1.1σ) and that the JWST dispersion is a factor of ∼2 smaller than HST. A more conservative period completeness limit (see Hoffmann et al. 2016) of Log P >1.4 yields an ever closer match with the remaining JWST sample fainter by 0.3σ but leaves a very small comparison sample of 11 and 16 Cepheids for HST and JWST, respectively. The mean crowding for this irregular, star-bursting Sdm type host is substantially higher due of its compact nature, ∼2 times that of the large spiral hosts studied here and comprising most of the R22 sample. We also considered a "least crowded" sample selection, following Freedman & Madore (2023) who sought to reduce scatter by visual selection of the least crowded Cepheids according to the JWST images. As we did in Section 3 for the data from our program, a less crowded sample was selected as those with a DOLPHOT "crowd" parameter that was below the full sample median, 0.135. The reduced sample of 13 Cepheids have a mean crowding of 0.07 mag (comparable to the mean of the six hosts studied here without a crowding cut, estimated for the same 1.15 μm wavelength to be ∼0.05 mag) have a reduced scatter of 0.18 mag and the same intercept as the full sample within ∼0.02 mag. This sample is very small so that minor differences in its composition may produce large, stochastic variations. However, we are skeptical that there is any real gain to be made by subselecting less crowded Cepheids because their lower scatter is already reflected in their smaller uncertainties (measured with artificial stars) and their greater weight. In Table 4, this same selection also yielded a similar result, lowering the dispersion while yielding a difference in mean intercept of 0.01 mag, and given the also larger and independent samples, 40 times larger, the significance of this test is substantially stronger.

Figure 10. Comparison of Cepheid photometry in NGC 7250 in F115W. Gray shows photometry from HST F160W from Hoffmann et al. (2016) and R22, transformed to F115W using a synthetic relation, F160W = F115W+ 0.41 ± 0.05 + 0.49(F555W−F814W −1). Points in red are from our measurements of images from JWST Program 1995 (PI Freedman). The P–L relations are broadly consistent (JWST brighter than HST by 1.1σ). The JWST dispersion is a factor of 2 smaller than HST.
Download figure:
Standard image High-resolution image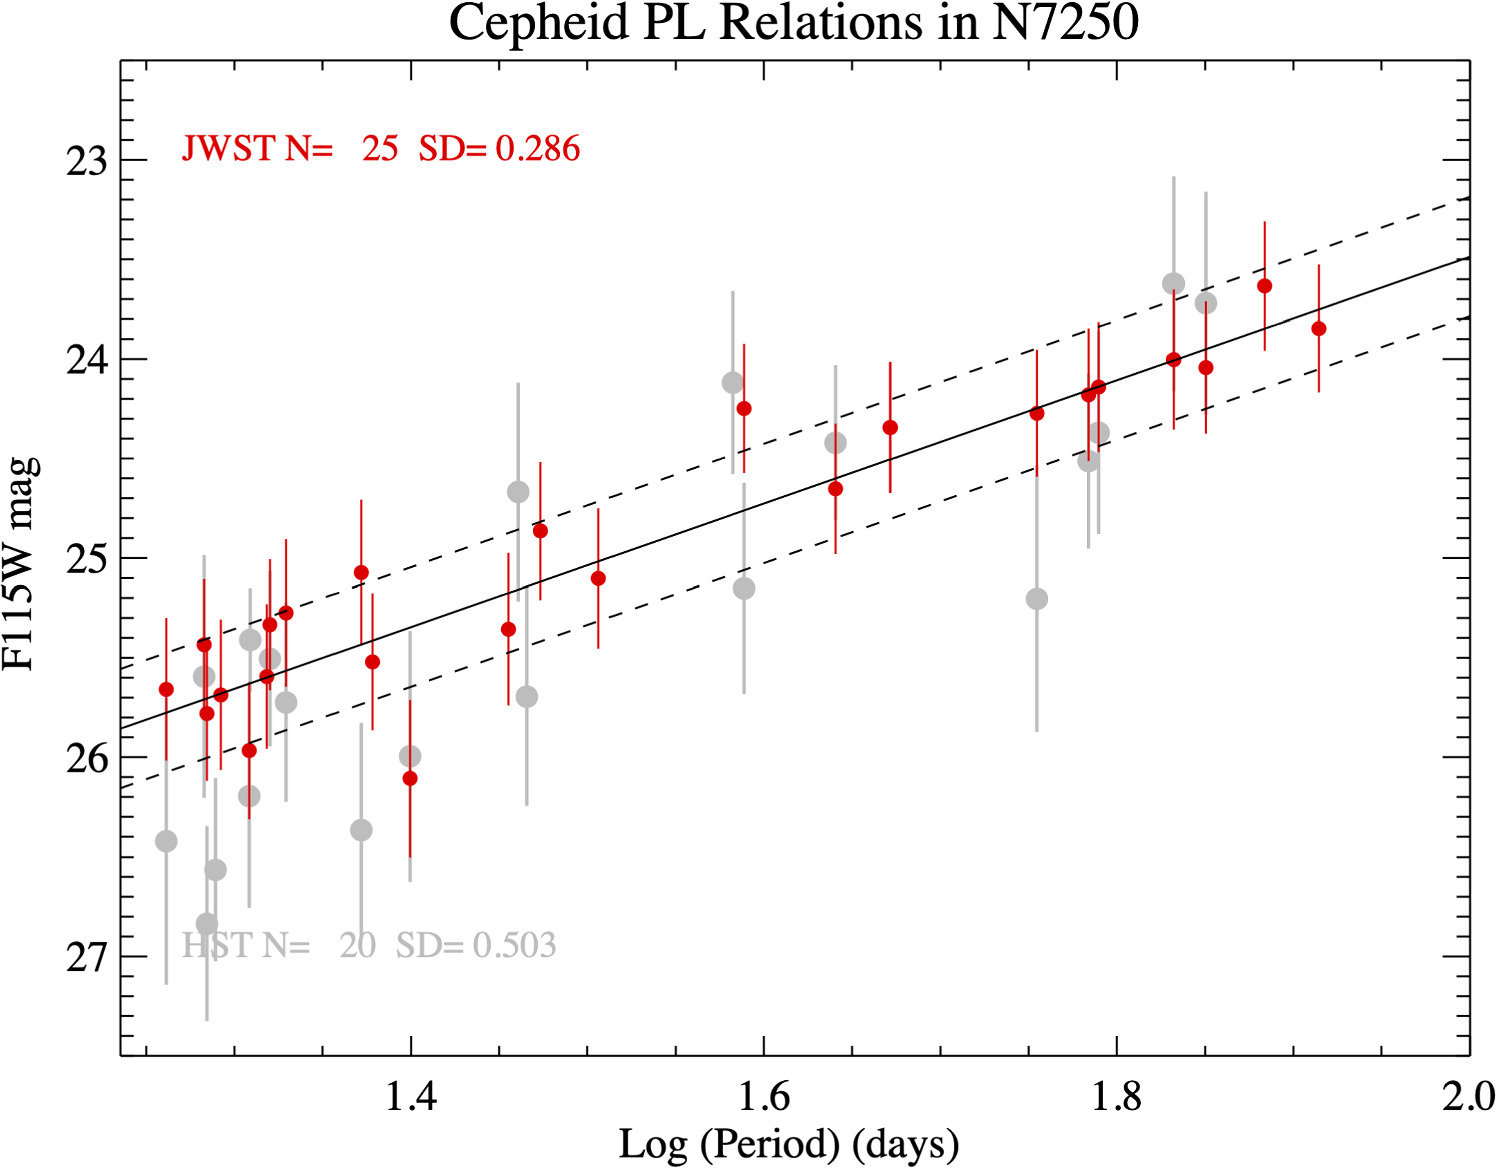
Footnotes
- 7
Tension may refer to the discrepancy between measures or to the feeling it produces as expressed by Verde et al. 2023: "The research community has been actively looking for deviations from ΛCDM for two decades; the one we might have found makes us wish we could put the genie back in the bottle."
- 8
A revised version of the DOLPHOT package became available after this work was completed, which includes a new "-etctime" option to revise the exposure times in the image headers. As a test we compared the Cepheid photometry of NGC 5584 with the old and new version and measured a median difference of 0.001 mag in F150W and 0.002 mag in F090W and an 0.3% mean change in the noise. Further, using revised PSFs in DOLPHOT from WebbPSF 1.2.1 from April 2 2024 resulted in a change of 0.003 mag, an increase in sample size by 2%, and a reduction in PL noise by 1.2%. We judged these differences too small to merit a change in versions for this work.
- 9
If this difference is interpreted as a mean error in HST measurements, the sense would be of slightly overcorrecting HST Cepheid photometry for crowding and underestimating H0. However, the difference is not significant.