


Abstract
Magnetospheric processes seen in gas giants such as aurorae and circularly polarized cyclotron maser radio emission have been detected from some brown dwarfs. However, previous radio observations targeted known brown dwarfs discovered via their infrared emission. Here we report the discovery of BDR J1750+3809, a circularly polarized radio source detected around 144 MHz with the Low-Frequency Array (LOFAR) telescope. Follow-up near-infrared photometry and spectroscopy show that BDR J1750+3809 is a cold methane dwarf of spectral type T6.5 ± 1 at a distance of  . The quasi-quiescent radio spectral luminosity of BDR J1750+3809 is ≈5 × 10¹⁵ erg s−1 Hz−1, which is over two orders of magnitude larger than that of the known population of comparable spectral type. This could be due to a preferential geometric alignment or an electrodynamic interaction with a close companion. In addition, as the emission is expected to occur close to the electron gyrofrequency, the magnetic field strength at the emitter site in BDR J1750+3809 is B ≳ 25 G, which is comparable to planetary-scale magnetic fields. Our discovery suggests that low-frequency radio surveys can be employed to discover substellar objects that are too cold to be detected in infrared surveys.
Export citation and abstract BibTeX RIS
1. Introduction
The generation and dissipation of magnetic flux in stars and planets are pivotal in driving violent stellar activity and determining the space plasma environment around exoplanets, respectively (Schwenn 2006; Schrijver & Zwaan 2008). On cool objects where Zeeman splitting observations are difficult (later than type M typically), observation of cyclotron emission that falls in the radio band is the only known technique to directly measure the strength and topology of the objects' magnetic fields.
Brown dwarfs (BDs), with masses between that of stars and planets, display optical aurorae (Hallinan et al. 2015) and the associated auroral radio emission (Nichols et al. 2012; Hallinan et al. 2015; Pineda et al. 2017; Kao et al. 2018) powered by the electron cyclotron maser instability (Wu & Lee 1979; Treumann 2006; Hallinan et al. 2008). In addition, because there appears to be no clear demarcation between the atmospheres and magnetospheres of the smallest coldest brown dwarfs and the largest planets (Deeg & Belmonte 2018), radio observations at the end of the BD sequence are expected to provide a tantalizing glimpse into magnetospheric properties of exoplanets (Kao et al. 2018, 2019).
Christensen et al. (2009) have argued that the magnetic fields of planets, brown dwarfs, and low-mass stars of sufficiently rapid rotation are dipolar and that the field strength scales with the heat flux from the bodies' interior. The simplicity and universality of this law is a giant leap in modeling exoplanet atmospheres and habitability. The law can be tested at the low-mass end by measuring the magnetic fields of a sample of cold brown dwarfs and exoplanets via radio observations of their cyclotron emission (Kao et al. 2016, 2018).11
Since their discovery as radio emitters (Berger et al. 2001), radio surveys of known BDs have primarily been carried out at gigahertz frequencies that can only detect cyclotron emission from objects with kG-level magnetic fields (see the compilation of Pineda et al. 2017; Williams 2018, Chapter 28). Observations at much lower frequencies that probe "planetary-scale" magnetic fields (few to tens of Gauss) are necessary to test the scaling law in the exoplanet regime. Low-frequency observations are now being carried out thanks to the advent of sensitive meter-wave telescopes such as the Low-Frequency Array (LOFAR; van Haarlem et al. 2013), and the wide-area surveys they facilitate such as the LOFAR Two Metre Sky Survey (LoTSS; Shimwell et al. 2017, 2019). Low-frequency searches have so far been unsuccessful (Bastian et al. 2000; Lazio et al. 2004; Hallinan et al. 2013; Burningham et al. 2016; Lynch et al. 2017b; Lenc et al. 2018).
Searching for circularly polarized radio sources has proved to be a powerful technique to identify coherent stellar radio emission (Lynch et al. 2017a; Callingham et al. 2020; Vedantham et al. 2020). There are three known types of radio emitters with a high circularly polarized (CP) fraction: (a) stars, (b) brown dwarfs and planets, and (c) pulsars. Lack of an optical counterpart to a CP source generally rules out a stellar association. We are currently following up such sources in the LoTSS survey (Shimwell et al. 2017, 2019) data with NIR photometry and radio pulsation search to distinguish between the remaining two options. Here we report our first discovery from this effort—BDR J1750+3809. We will leave the overall counts and population statistics of unassociated CP sources for future work, save mentioning that BDR J1750+3809 stood out due to its high CP fraction (see Section 2.1) and that follow-up near-infrared photometric observations show the object to be a cold brown dwarf (see Section 2.2).
BDR J1750+3809 is the first radio-selected substellar object, which demonstrates that such objects can be directly discovered in sensitive wide-area radio surveys. Because the intensity of magnetospheric radio emission that is nonthermal in nature need not have a one-to-one scaling with the object's infrared luminosity, which is thermal in nature, BDR J1750+3809's discovery also shows that ongoing low-frequency radio surveys could discover objects that are too cold and/or distant to be discovered and studied via their infrared emission.
2. Discovery and Follow-up
2.1. Radio Properties
BDR J1750+3809 was discovered as a radio source in an 8 hr LOFAR exposure between 120 and 167 MHz with a high average CP fraction of  . The field containing BDR J1750+3809 was covered by two partially-overlapping LoTSS survey pointings, which were observed approximately six months apart in 2018. The radio source was only detected in one exposure (Figure 1). Separately, we obtained another LOFAR exposure centered on BDR J1750+3809 in 2020 January. We re-detected the source in total intensity at low significance (≈4σ), but not in circular polarization. Forced CP photometry yields a polarized fraction of 12 ± 16%. The radio source has not been detected previously, including in the first-epoch of the ongoing Very Large Array Sky Survey at 2–4 GHz (image noise of ≈0.1 mJy; Lacy et al. 2020). Further details of radio data processing are given in Appendix A.
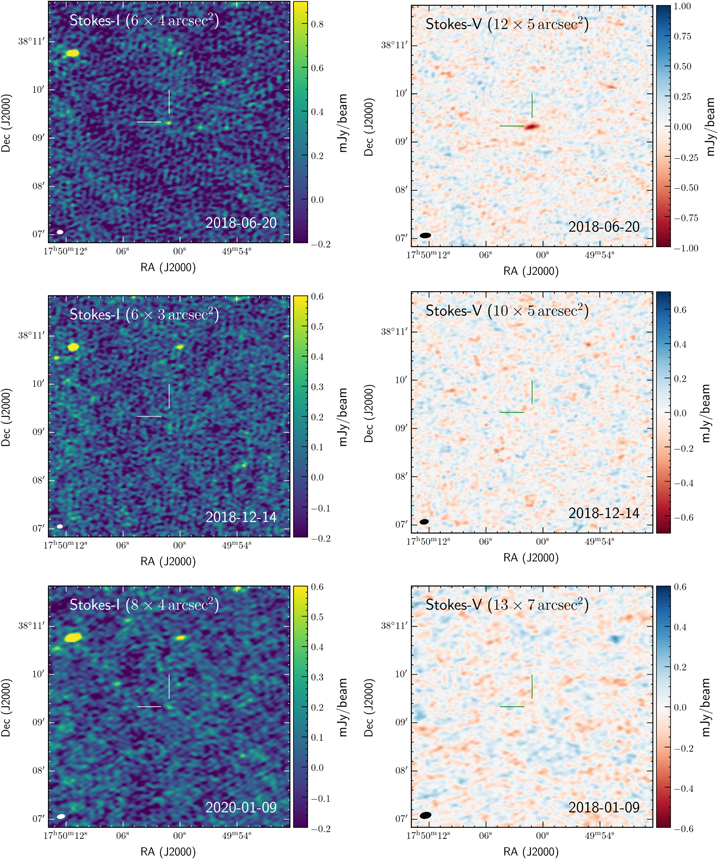
Figure 1. Radio detections and nondetections of BDR J1750+3809 with LOFAR. Left column shows Stokes-I (total intensity) images, and right column shows Stokes-V (circularly polarized intensity) images made with Brigg's weighting with a factor of −0.5 and 0, respectively. The observation dates and beam sizes are annotated. The position of BDR J1750+3809 is marked with crosshairs that are 30'' long. The images are 5' in size.
Download figure:
Standard image High-resolution image2.2. Identification as a Cold Brown Dwarf
We searched publicly available optical and NIR archives for an association with the radio source. The source has no counterpart in the Pan-STARRS (Chambers et al. 2016), 2MASS (Skrutskie et al. 2006), or AllWISE (Cutri et al. 2013) survey catalogs. We found a faint (6σ level) J-band detection (Figure 2) positionally coincident with BDR J1750+3809 in the UKIRT Hemisphere Survey (UHSDR1; Dye et al. 2018).

Figure 2. NIR images of the field around BDR J1750+3809. Because the images have disparate plate-scales, they have all been been convolved with a Gaussian kernel with an FWHM of 0 5. Instrument names, filters, and observation dates are in the annotated text. The images are 1' in size. The crosshairs are 5'' long and point to the position of BDR J1750+3809 in the NIRI-CH4s exposure. Color scale runs from −25 × MAD (red) to +25 × MAD (blue), where MAD is the median absolute deviation and zero is denoted by white. Extracted source magnitudes and positions are given in Table 1. The roughly semicircular field of view of the GNIRS keyhole is smaller than the image dimension. The red circular patches in the GNIRS-Y-band image are at the 1% level and are artifacts of flat-fielding.
Download figure:
Standard image High-resolution imageTo confirm the UKIRT detection and constrain the NIR colors, we obtained a Ks-band image of the source with the Wide-field Infrared Camera (WIRC; Wilson et al. 2003) on the Palomar 200 inch telescope. The data were reduced and stacked using a custom data reduction pipeline described in De et al. (2020). With an effective exposure of 10 minutes, we did not secure a detection at the location of the UKIRT J-band source (Figure 2). However, the ≈6 yr baseline between the two 200 inch and UKIRT exposures, and the unknown proper motion of BDR J1750+3809, meant that we could not be certain if subthreshold (low-significance) detections in the Ks-band image could be associated.
We obtained time for J- and Y-band photometry on the Gemini-North telescope (program ID GN-2019B-DD-105). Because the workhorse imager, NIRI (Hodapp et al. 2003), was unavailable at that time, we obtained imaging exposures through the acquisition keyhole of the GNIRS spectrometer (Elias et al. 2006). This option yields a sensitivity comparable to that of NIRI but with a small field of view. The observing conditions did not permit the transfer of calibration solutions from photometric standards. We therefore tied our photometry to the nearby star 2MASS J17500008+3809276 (Star A hereafter; see Appendix B for further details), which also fortuitously ensures a correction for any interstellar opacity effects.
We detected the counterpart to BDR J1750+3809 in both the J and Y bands in the GNIRS keyhole images (Figure 2). We used the known position of the source from the 2019 October 19 GNIRS exposures to search for a subthreshold detection in the Ks-band data from 2019 September 7. A forced photometric extraction yielded a faint 3σ detection.
We also found a ≈5σ detection in the W1 and W2 channels of the unWISE catalog (Schlafly et al. 2019) that is an unblurred coaddition of all available Wide-field Infrared Survey Explorer (WISE) exposures. The bulk of the WISE exposures of the field around BDR J1750+3809 were taken in 2010. The WISE detections are consistent with the proper-motion-corrected position of BDR J1750+3809 (see Section 2.4) within errors. The NIR colors (Y − J, J − H, and J − W2; e.g., see Figure 8 in Appendix B) identify the object as a cold brown dwarf of spectral class T.
2.3. Spectral Type
T dwarfs are characterized by the presence of methane in their atmosphere (Fegley & Lodders 1996; Kirkpatrick et al. 1999) due to their low surface temperatures that range from a few hundred to ∼1000 K (Nakajima et al. 2004). To confirm the presence of atmospheric methane, we obtained further exposures using the NIRI instrument on the Gemini-North telescope in the H band and the CH4s band to perform "methane-imaging," which is a reliable technique for discovery and spectral typing of cool BDs (Rosenthal et al. 1996; Tinney et al. 2005). We detected BDR J1750+3809 in both filters at high significance (Figure 2). Based on the observed H−CH4s colors of the object and the relationship of Liu et al. (2008, their Equation (2) and Figure 4), we estimate a spectral type of T7.5 ± 1.5, confirming that BDR J1750+3809 is at the end of the T-dwarf sequence.
Separately, we obtained a low-resolution (R ≈ 100) spectrum of BDR J1750+3809 on 2020 October 4 UT using the near-IR spectrograph SpeX (Rayner et al. 2003) on NASA's Infrared Telescope Facility (IRTF) located on Maunakea, Hawaii. Figure 3 shows the reduced spectrum of BDR J1750+3809, which has been flux-calibrated based on its J-band magnitude from UKIRT (Table 1). While the signal-to-noise ratio is low (≈6 per pixel in the J-band peak), the spectrum clearly shows the strong water and methane absorption bands that are the hallmarks of late-T dwarfs. We classified BDR J1750+3809 from the system of five spectral indices established by Burgasser et al. (2006), resulting in a spectral type of T6.2 ± 1.2. We also visually classified BDR J1750+3809 by comparing with IRTF/Spex spectra of the late-T standards from Burgasser et al. (2006) and Cushing et al. (2011), finding a type of T7. Considering both the index and visual types, we adopt a final type of T6.5 ± 1.0.
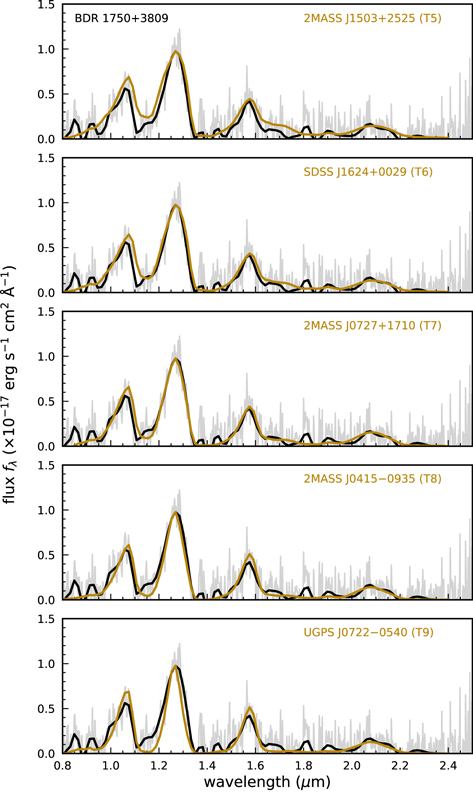
Figure 3. Near-IR spectrum of BDR J1750+3809 (black) compared to T-dwarf spectral standards (tan) from Burgasser et al. (2006) and Cushing et al. (2011). All of these spectra are smoothed to R ∼ 50 for comparison and the reduced spectrum of BDR J1750+3809 prior to the smoothing is shown in gray. We have flux-calibrated the spectrum of BDR J1750+3809 based on its J-band magnitude from UKIRT (Table 1) and normalized spectral standards by their peak fluxes in the J band.
Download figure:
Standard image High-resolution imageTable 1. Photometry and Astrometry of BDR J1750+3809 in J2000
| Obs. Date | Telescope/Instrument | Band | Flux Density | Position |
|---|---|---|---|---|
| 2013-09-25 | UKIRT | J-MK | 19 2(4) 2(4) |
17:50:01.18(2), +38:09:18.5(2) |
| 2018-06-20 | LOFAR/HBA | 144 MHz | 1.1(2)/−1.0(2)mJy | 17:50:01.15(5), 38:09:19.6(8) |
| 2018-12-14 | LOFAR/HBA | 144 MHz | 0.1(1)/−0.08(7)mJy | Nondetection |
| 2020-01-09 | LOFAR/HBA | 144 MHz | 0.4(1)/−0.05(7)mJy | Marginal detection (4σ) |
| 2019-09-07 | Hale/WIRC | Ks | 192(4) |
Marginal detection (3σ) |
| 2019-10-19 | Gemini-N/GNIRS | J-MK | 191(1) |
17:50:01.13(2), +38:09:19.5(2) |
| 2019-10-19 | Gemini-N/GNIRS | Y-MK | 204(1) |
17:50:01.12(2), +38:09:19.4(2) |
| 2019-11-09 | Gemini-N/NIRI | H-MK | 199(1) |
17:50:01.13(2), +38:09:19.5(2) |
| 2019-11-13 | Genini-N/NIRI | CH4s | 193(1) |
17:50:01.12(2), +38:09:19.6(2) |
| Various (co-add) | unWISE | W1 | 188(2) |
17:50:01(1), +38:09:19.7(7) |
| Various (co-add) | unWISE | W2 | 172(2) |
17:50:01(1), +38:09:20.3(7) |
Note. Radio flux densities are given for Stokes-I and Stokes-V emission. Magnitudes are in the Vega system. Numbers in parenthesis give the error on the last significant digit. Errors in magnitude only include formal errors from aperture photometry and do not include systematic photometric errors (see Appendix B for further details).
Download table as: ASCIITypeset image
All measurements of flux density and position estimates are summarized in Table 1 for quick reference, while Appendices A and B provide further details of the observational setup and data processing.
2.4. Distance and Proper Motion
We placed BDR J1750+3809 on the J versus J − W2 color–magnitude relationship of cold methane dwarfs from Leggett et al. (2017) (see Figure 9 in Appendix B) to find a distance of  pc. We estimated a more accurate photometric distance to BDR J1750+3809 using the spectral type–absolute magnitude relation from Dupuy & Liu (2012). For late-T dwarfs, the W2 band has the smallest intrinsic scatter to the relation (≈0.19 mag), so we use this band, even though its observed photometry has larger uncertainties than our near-IR photometry. We used a Monte Carlo calculation to account for the uncertainties in the spectral type (assumed to be uniformly distributed), the W2 photometry (normally distributed), and the relation's intrinsic scatter (normally distributed). The resulting distance modulus is 4.08 ± 0.28 mag, corresponding to a distance of
  pc. (The same calculation using the J band gives a consistent result,
  pc.)
pc.)
Based on the photometric distance of ≈65 pc, the anticipated annual parallactic shift of ≈15 mas is well below the astrometric accuracy of our data. Moreover, the UKIRT exposure and the NIRI exposures were taken around the same time of year providing a six year baseline while further minimizing the parallactic shift. The proper motion of the source between these two exposures with respect to the field stars is −120 ± 30 mas yr−1, and 200 ± 30 mas yr−1 along the R.A. and decl. axes, respectively. Further details of our NIR astrometry are given in Appendix B.5. Combined with the measured proper motion and its uncertainties, the corresponding tangential velocity is 73 ± 14 km s−1. This makes BDR J1750+3809 a likely member of the thin disk population, based on the kinematic criteria of Dupuy & Liu (2012).
3. Discussion
3.1. Emission Mechanism
Brown dwarf radio emission falls into two phenomenological categories: (a) impulsive highly polarized emission from the cyclotron maser instability (ECMI; Hallinan et al. 2007, 2008; Route & Wolszczan 2016a, 2016b; Kao et al. 2018), and (b) quasi-quiescent emission with a low polarization fraction that is attributed to incoherent gyrosynchrotron emission (Berger et al. 2001; Osten et al. 2006; Williams et al. 2015). Adopting the photometric distance of d = 65 pc, the brightness temperature of the emitter in BDR J1750+3809 is  , where x* is the radius of the emitter in units of the characteristic brown dwarf radius of 7 × 109 cm. The high brightness temperature and circular fraction summarily rules out all incoherent emission mechanism. We therefore interpret the observed radio emission as ECMI.
3.2. Radio Energetics and Temporal Variation
Circularly polarized radio emission in BDs is driven by magnetospheric acceleration processes (Hallinan et al. 2008, 2015), whose luminosity need not be rigidly related to the NIR luminosity that is determined by surface temperature and atmospheric composition. As such, the first radio-selected BD in a flux-limited survey is likely to be more radio-luminous than the NIR-selected population.
Adopting the photometric distance of dpc = 65, the time-averaged (8 hr exposure) radio spectral luminosity in our 2018 detection is ≈5 × 10¹⁵ erg s−1 Hz−1. For comparison, highly polarized radio emission from previous T dwarfs have only been detected to have time-averaged spectral luminosities below ∼1013 erg s−1 Hz−1 (Williams et al. 2013; Kao et al. 2018, 2019). However, the brightest short-duration pulses from T dwarfs typically last tens of seconds and attain a spectral luminosity of ∼1015 erg s−1 Hz−1 (Route & Wolszczan 2016a, 2016b). Such values are comparable to the 8 hr averaged value for BDR J1750+3809.
To search for short radio bursts and any signature of rotation modulation, we extracted the radio light curve of BDR J1750+3809 from our 2018 detection at varying temporal cadences (Figure 4). The light curves do not show a clear sign of periodicity, and we see no evidence of intense short-duration bursts that could account for a significant fraction of the quasi-quiescent radio luminosity. We also computed a windowed Fast Fourier Transform (FFT) of the curves, as well as a Lomb–Scargle periodogram (Figure 5 in Appendix A). Again, we did not detect an unambiguous signature of periodicity.
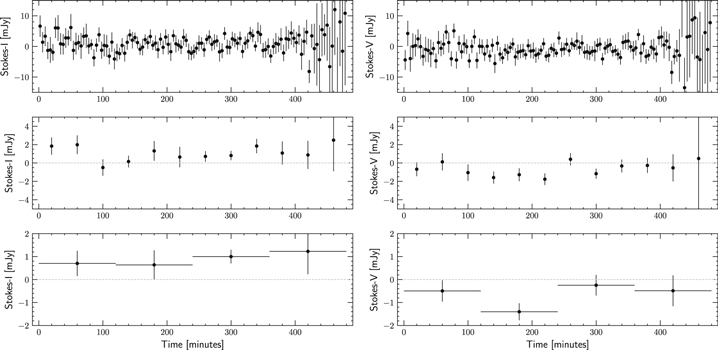
Figure 4. Stokes-I and Stokes-V light curves of BDR J1750+3809 (left and right columns) from the 2018 detection (see Figure 1) at varying temporal resolutions of 4m, 40m, and 120m (top to bottom). The light curves show that the emission has a stable brightness, with no obvious bright bursts.
Download figure:
Standard image High-resolution image3.3. Special Geometry or Unusually Luminous?
That large distance-scale to BDR J1750+3809 is unusual given that it is the first radio-selected BD in a flux-limited survey. We explore two scenarios that may give BDR J1750+3809 its unusually large time-averaged spectral luminosity. The scenarios also correspond to the two acceleration mechanisms that are known to operate in the Jovian magnetosphere and postulated to operate in BD magnetospheres—breakdown of corotation between the plasma and the magnetic field (Nichols et al. 2012; Turnpenney et al. 2017), and a sub-Alfvénic interaction with an orbiting companion (Saur et al. 2013; Turnpenney et al. 2018).
Corotation breakdown: One possibility is that there is nothing particular about BDR J1750+3809 when compared to other radio-loud T dwarfs and that its high time-averaged spectral luminosity is merely a result of a special viewing geometry.12 Based on the reference case of solar system planetary radio emissions, auroral radio emission is expected to primarily occur at high magnetic latitudes (Zarka 1998). It is also expected to be beamed along the surface of a cone aligned with its axis parallel to the ambient magnetic field and a large opening angle (Melrose & Dulk 1982; Zarka 1998; Treumann 2006). In the hypothetical case of perfect axial symmetry, there will not be any rotation modulation of the observed emission. Real magnetospheres possess some azimuthal anomaly and/or a misalignment between the rotation and magnetic axes (Russell & Dougherty 2010). In the general case, the anomaly leads to a strong rotational modulation of the observed emission. The resulting emission typically appears pulsed and the pulse pattern repeats at the rotation period (see, e.g., Hallinan et al. 2007; Route & Wolszczan 2016b; Kao et al. 2016, 2018). However, in specific geometries (equator-on view, for instance), the emission may be visible over most rotational phases.13 Our discovery technique is biased toward finding systems with such a geometry because we blindly search for brown dwarfs in 8 hr exposure images. This scenario may explain our nondetection of periodicity due to the absence of a pulsed rotational modulation. In addition, the radio nondetection in one of the 2018 exposures could be the result of intrinsic variability expected in masers. For comparison, the flux density of Jovian ECMI emission varies by a factor of several between epochs (Zarka et al. 2004).
Sub-Alfvénic interaction: Alternatively, the electrodynamic engine in BDR J1750+3809 maybe particularly luminous as it is driven by interaction with a nearby and/or large companion. In this case, the radiation is only beamed toward the Earth during specific combinations of the orbital phases of the companion and the rotational phase of the primary, similar to the visibility of the Io-related Jovian emission. This beaming geometry could account for the nondetection in the 2018 December 14 LOFAR exposure.
The occurrence rate of planets around cold brown dwarfs is currently not well constrained (He et al. 2017). Nevertheless, a rough constraint on the companion's size may be obtained by scaling up the Jupiter–Io benchmark to meet the observed radio luminosity. Taking the emission bandwidth of BDR J1750+3809 to be 200 MHz for an estimate, the lower limit on the isotropic luminosity in the radio band is 1024 erg s−1. The Jupiter–Io system generates an average radio power of ∼1017 erg s−1 (Zarka et al. 2004; Zarka 1998). Assuming that the radio emission from BDR J1750+3809 is beamed into a solid angle of 0.16 sr as is the case for Io-driven Jovian emission (Zarka et al. 2004), the observed emission is 105 times more luminous than the Jupiter–Io system. Assuming the same interaction Mach number as Io's interaction and the same geometric factors, the Poynting flux from the interaction scales as R2obsvB2 (Zarka 2007; Saur et al. 2013; Turnpenney et al. 2018), where R is the effective radius of the companion, v is the relative velocity between the corotating magnetic field and the orbiting companion, and B is the magnetic field at the radius of the companion. If we adopt a rotation period for BDR J1750+3809 of 2 hr that is comparable to other radio-loud T dwarfs (Kao et al. 2018), and a surface field strength of 0.1 kG and the same orbital distance as that of Io, the necessary power can be achieved if the companion presents an obstruction of radius ≈0.25 RJ. Because a dipolar field evolves with distance as d−3, the term vB2 in the expression for radio power evolves steeply as d−5. Hence, this scenario admits a wide range of companion sizes.
3.4. Outlook
The total power in the auroral current on BDR J1750+3809 can be further constrained by optical recombination-line observations. Taking the radio power to be 1% of the kinetic power in the auroral electrons Zarka (2007) and Lamy et al. (2011) yield a total kinetic power of 1026 erg s−1 that should be detectable in Balmer line emission for instance. In addition, a parallax measurement is necessary to secure a distance estimate. This is especially true since any close companion will contaminate the NIR flux of the object and produce erroneous photometric distance estimates.
The two scenarios presented above can be tested with radio data. If the companion-driven emission is the true scenario, then continued radio monitoring should reveal signatures of periodicity at the orbital period of the companion. Such observation will, however, prove challenging due to the large inherent variation in maser luminosity. If, on the other hand, the special geometric alignment scenario is correct, then a search for BDs in short exposure radio images made with existing LOFAR data must reveal a large underlying population of bursts from BDs that do not have a special geometric alignment with respect to the Earth.
We end by noting that the BDR J1750+3809 is not only the first radio-selected BD, but the low frequency of observation means that the magnetic field at the emitter is comparable to that anticipated in gas-giant exoplanets (Reiners & Christensen 2010; Yadav & Thorngren 2017; Cauley et al. 2019). Our discovery therefore bodes well for radio detections of exoplanet magnetospheres.
J.R.C. thanks the Nederlandse Organisatie voor Wetenschappelijk Onderzoek (NWO) for support via the Talent Programme Veni grant. The authors thank Prof. Gregg Hallinan for commenting on the manuscript. This Letter is based on data obtained with the International LOFAR Telescope (obs. IDs 691360 and 658492 as part of the LoTSS survey and obs. ID 763257 awarded to proposal LC13 021). LOFAR is the Low-Frequency Array designed and constructed by ASTRON. It has observing, data processing, and data storage facilities in several countries, that are owned by various parties (each with their own funding sources), and that are collectively operated by the ILT foundation under a joint scientific policy. The ILT resources have benefitted from the following recent major funding sources: CNRS-INSU, Observatoire de Paris and Université d'Orléans, France; BMBF, MIWF-NRW, MPG, Germany; Science Foundation Ireland (SFI), Department of Business, Enterprise and Innovation (DBEI), Ireland; NWO, The Netherlands; The Science and Technology Facilities Council, UK. This research made use of the Dutch national e-infrastructure with support of the SURF Cooperative (e-infra 180169) and the LOFAR e-infra group. The Jülich LOFAR Long Term Archive and the German LOFAR network are both coordinated and operated by the Jülich Supercomputing Centre (JSC), and computing resources on the supercomputer JUWELS at JSC were provided by the Gauss Centre for Supercomputing e.V. (grant CHTB00) through the John von Neumann Institute for Computing (NIC). This research made use of the University of Hertfordshire high-performance computing facility and the LOFAR-UK computing facility located at the University of Hertfordshire and supported by STFC [ST/P000096/1], and of the Italian LOFAR IT computing infrastructure supported and operated by INAF, and by the Physics Department of Turin university (under an agreement with Consorzio Interuniversitario per la Fisica Spaziale) at the C3S Supercomputing Centre, Italy. The Letter is based on observations obtained at the international Gemini Observatory (DDT proposal DT-2019B-014), a program of NSF's NOIRLab, which is managed by the Association of Universities for Research in Astronomy (AURA) under a cooperative agreement with the National Science Foundation on behalf of the Gemini Observatory partnership: the National Science Foundation (United States), National Research Council (Canada), Agencia Nacional de Investigación y Desarrollo (Chile), Ministerio de Ciencia, Tecnología e Innovación (Argentina), Ministério da Ciência, Tecnologia, Inovações e Comunicações (Brazil), and Korea Astronomy and Space Science Institute (Republic of Korea).
Software: python3, numpy, scipy, astropy, matplotlib.
Facilities: LOFAR, Gemini-North, WISE, UKIRT, Hale telescope.
Appendix A: Radio Data
A.1. Data Reduction
We used the standard LoTSS pipeline for primary data reduction (Shimwell et al. 2017, 2019). An additional self-calibration step was applied in the direction of the target with a pipeline that is described in Vedantham et al. (2020). All images were made with wsclean with Brigg's weighting. The images in Figure 1 have a weighting factor of −0.5 for Stokes-I to suppress confusion from diffuse emission and sidelobe noise. The Stokes-V images do not suffer from these sources of confusion and have been made with a weighting factor of 0 to maximize signal-to-noise ratio. The astrometric fits and flux density in Table 1 were determined from images made with a weighting factor of −0.5 to improve astrometric accuracy.

Figure 5. Power spectrum of temporal variations (top panel) and Lomb–Scargle periodogram (bottom panel). Light curves at a 4 minute cadence were used as input. A Hanning window was used to improve the point-spread function of the Fast Fourier Transform (FFT).
Download figure:
Standard image High-resolution imageWe used the Background And Noise Estimator (BANE) and source finder Aegean (v 2.1.1; Hancock et al. 2012, 2018) to measure the flux density and location of BDR J1750+3809. Originally, we discovered BDR J1750+3809 through a blind search for sources that were >4σ in Stokes-V emission, where σ is the local rms noise (Callingham et al. 2019; Vedantham et al. 2020). Once the position of the source was known, we applied the prioritized fitting option of Aegean for the other epochs, which fits for both the point-spread function shape and flux density of BDR J1750+3809. In the Stokes-V images we searched for both positive and negative emission.
The bright source to the NE of the target has a peak Stokes-I flux density of ∼8.5 mJy and is undetected in the Stokes-V images with rms noise of 0.1 mJy, suggesting that the Stokes-I to -V leakage is at the ∼1% level or below in our images.
A.2. Light Curves
Although the 8 hr exposure images have good uv coverage, the short exposures suffer from sidelobe noise from in-field sources. We therefore modeled the visibilities of the in-field sources using the update-model-column option of wsclean and subtracted the model from the visibilities. To extract the light curves at the location of BDR J1750+3809, the residual visibilities were then snapshot imaged at varying temporal cadences of with a Brigg's factor of 0. For the periodicity analysis leading to Figure 5, we used the snapshot images made at a 4 minute cadence. We used a Hanning window prior to Fourier transformation.
A.3. Radio Astrometry
The LoTSS astrometry is tied to the Pan-STARRS grid with an absolute astrometric error of 02 (Shimwell et al. 2017, 2019). In Table 1 we quote the error obtained by adding the formal error from our source finding in quadrature with the absolute astrometric error. Because BDR J1750+3809 is a faint source, its astrometric uncertainty in the radio is dominated by the formal error in finding the source centroid within the point-spread function. For instance, the images used for astrometric determination from the 2018 June 20 exposure (Brigg's factor of −0.5) has a point-spread function with major and minor axes of 4'' × 7''. Adopting a geometric mean width of 53, the formal centroid-finding error for a 7σ source is 076.
Appendix B: NIR Data Reduction
B.1. GNIRS Keyhole Imaging
There was light cloud cover and fog during the observations. Dark and bias currents were subtracted from each exposure using a custom python code applied to calibration images taken at the end of the night. The dome-flat frames were unusable due to improper illumination (cause unknown); hence, we used the median combination of the dithered science exposures to make a sky-flat. The pixel centroid of Star A in each frame was determined using sextractor. The FITS header keywords CRVAL1, CRPIX1, CRVAL2, and CRPIX2 were modified to shift the frame so as to have Star A's position tied to its Gaia DR2 position (Gaia Collaboration et al. 2018). The plate scale and orientation could not be solved for with just one reference star, so we adopted the nominal values specified by the observatory. The resulting frames were resampled on a common grid and median-combined using the swarp software.
B.2. NIRI Imaging
As with the GNIRS exposures, the observing conditions did not allow for photometric calibration transfer from standard stars. The dark and bias currents were subtracted from each exposure using a custom python code. The dome-flats were found to be inadequate. So we used the dithered science exposures to construct a sky-flat that was applied in addition to the dome-flats. For each exposure, we then used sextractor to extract sources and scamp to solve for plate distortions up to third order while using the USNO-B1 catalog as a reference. Finally, we used swarp to resample the exposures on a common grid and median combine them.
B.3. NIR Photometry
Star A (2MASS J17500008+3809276) with a 2MASS J-band magnitude of 1522 has measured flux densities in several optical, NIR, and MIR bands (Figure 6). From a smooth polynomial fit to the star's flux densities (in Jy) measured by the Pan-STARRS and 2MASS surveys, we estimated the Vega magnitude of Star A in the MKO-systems Y, J, H, and CH4s filters to be, respectively, 1578, 1516, 1458, and 1461. In doing so we assumed the zero-points of 2026 Jy, 1545 Jy, 1030 Jy, and 1071 Jy, respectively. The fractional deviation of Star A's photometric measurements in the near-infrared and the fit is within 1%, which is smaller than the final photometric uncertainty (see below). Based on its spectrum, the star is likely a mid-M dwarf (M3 or M4) that is not expected to have large spectral excursions in the NIR part of its spectrum. We checked individual exposures to make sure that the star did not display egregious flaring that would significantly affect its flux density in coadded images. To determine the flux density (in ADC counts), we first computed the growth curve of 2MASS stars in the field by measuring their flux in varying apertures. The growth curves were averaged to yield the average growth curve. The small field of view of the GNIRS keyhole exposures meant that the only available 2MASS star in the field was Star A. We then measured the flux of the target in different apertures—1.0, 1.25, 1.5, and so on until 2.5 times the FWHM of point-spread function. To determine the targets total flux, we fit the average growth curve to the target's growth curve measured with these apertures. We took the mean value of the fitted fluxes as the measured target flux and their dispersion as the formal flux density fitting error. The target and Star A's flux densities (in counts) were finally scaled to match Star A's measured flux with its model spectral energy distribution (Figure 6).

Figure 6. Measured (black dots) and estimated (magenta crosses) flux density of Star A (2MASS J17500008+3809276). The estimates are based on a smooth polynomial fit (solid blue line) to the measurements.
Download figure:
Standard image High-resolution imageThe formal flux fitting errors were 002–005 depending on the filter. We repeated the same photometric procedure on in-field 2MASS stars in our H band and found our estimates to be differ from 2MASS estimates by about 01. We therefore conservatively adopted this value as the final error in our photometry.
Given the marginal detection in the Ks-band image the aperture flux with radii much larger than the seeing FWHM was severely affected by background estimation errors. We therefore measured the flux only in a single aperture whose radius was comparable to the seeing FWHM, instead of fitting the growth curves at various apertures. The photometry was referred to Star A as in the case of the Gemini observations. We note that a filter correction of ≈−02 for a late-T dwarf (Stephens & Leggett 2004) places the K-band magnitude of BDR J1750+3809 in the MKO system at 194(4).
B.4. NIR Spectroscopy
We used the facility near-IR spectrograph SpeX (Rayner et al. 2003) in prism mode, obtaining 0.8–2.5 μm spectra in a single order, with the 08-wide slit oriented at the parallactic angle. To acquire BDR J1750+3809, we used an offset from Star A (J = 15.2 mag) that lies 14'' WNW (offsets of 1225 east and 719 south). BDR J1750+3809 was nodded along the slit in an ABBA pattern, with individual exposure times of 180 s, and observed over an airmass range of 1.3–2.0, resulting in a total on-source exposure time of 4320 s. The telescope was guided using the off-axis optical guide camera. We observed the A0 V star HD 165029 contemporaneously for flux and telluric calibration, interleaving observations of the science target and calibrator to minimize the airmass difference between the two. The spectra were reduced using version 4.1 of the SpeXtool software package (Vacca et al. 2003; Cushing et al. 2004).
B.5. unWISE Detection
The original AllWISE catalog does not have a source plausibly associated with BDR J1750+3809 even when accounting for proper motion. This catalog had deliberately blurred point-spread function in the final coadded images. Recently Schlafly et al. (2019) have published "unblurred" coadded images and extracted catalog. The W2-filter image is shown in Figure 7 and we have reported the catalog flux in Table 1. The catalog reports a detection of BDR J1750+3809, at the ≈5σ level. It is flagged for the possible contamination from the wings of the bright source Star A to the northwest. Although there is almost of a decade that has elapsed within the exposures, the WISE point-spread function of 67 is large enough for the proper motion to not affect the flux determination significantly. The near-infrared colors of BDR J1750+3809 are shown in comparison to literature values of known M, L, and T dwarfs in Figure 8. The location of BDR J1750+3809 on a color-magnitude diagram along with other cold brown dwarfs is shown in Figure 9.
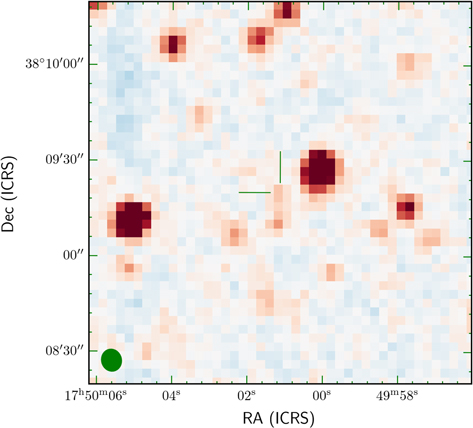
Figure 7. Image of the region around BDR J1750+3809 from the unWISE coaddition of WISE frames in filter W2 (centered on 4.5 μm). The plate scale is 275, and the beam is shown as a green ellipse. The yellow crosshairs are 10'' in length and mark the position of BDR J1750+3809 from the NIRI-CH4s exposure (see Table 1 and Figure 2). Color scale runs from −15 to 15 median absolute deviation.
Download figure:
Standard image High-resolution image
Figure 8. NIR colors of BDR J1750+3809 (shown in black) overplotted on the colors of M, L, and T dwarfs in the catalog of Dupuy & Liu (2012). The colors demonstrate that BDR J1750+3809 is a T dwarf.
Download figure:
Standard image High-resolution image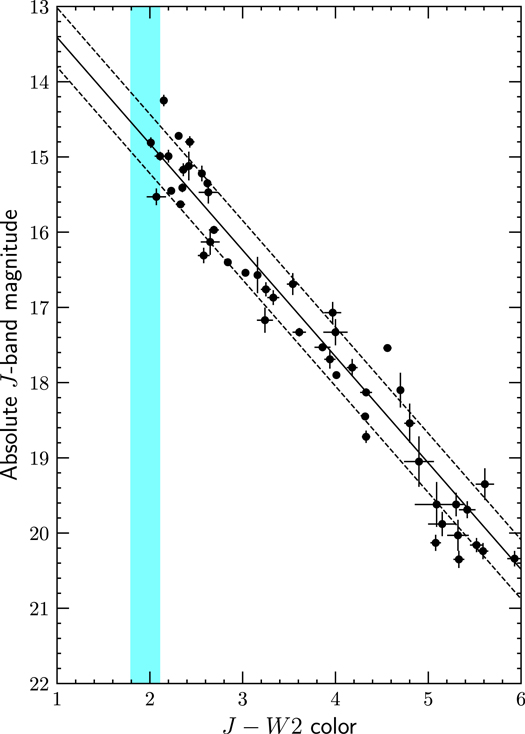
Figure 9. NIR color–magnitude diagram for cold brown dwarfs (class T and Y). Black points are taken from the homogenized data set on late-T dwarfs and Y dwarfs presented by Leggett et al. (2017). The solid black line is a linear fit to the points. The dashed black lines are parallel to the solid line, and are offset by one standard deviation between the fit and the data points. The cyan shaded region shows the constraint on BDR J1750+3809's NIR colors from Table 1.
Download figure:
Standard image High-resolution imageB.6. NIR Astrometry and Proper Motion
The GNIRS keyhole images only had the target and Star A detected within the field of view. We used Star A to apply a global offset and used the nominal plate scale and keyhole position angle to determine the position of BDR J1750+3809. The uncertainties on the plate scale and position angle are not well determined but are likely about 1% and 0 01, respectively (S. Xu, 2019, private communication). Based on this, we conservatively adopt an uncertainty of 02 in BDR J1750+3809's position derived from GNIRS keyhole images.
The NIRI images allowed us to solve for offsets and distortions as many stars were detected. The exposures were set to the USNO-B1 astrometric frame. A final offset correction on the extracted position of BDR J1750+3809 was applied such that the median offset of field stars in the Gaia DR2 catalog was zero. We checked the sextractor extracted positions of other in-field stars that were comparable in brightness to Star A and found the astrometric accuracy to be about 02, which is likely dominated by uncertainties in our solution for plate scale and distortion terms. We note that the NIRI and GNIRS positions agree within errors.
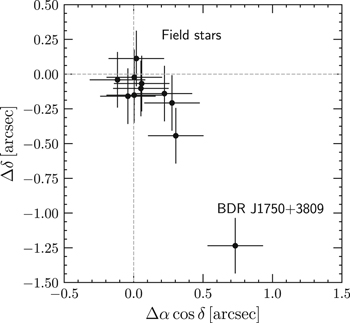
We determined the proper motion of BDR J1750+3809, using the UKIRT and NIRI CH4s exposures because the NIRI H-band exposure had worse seeing. Figure 10 shows the offset of field stars and BDR J1750+3809 between the two images.
Figure 10. Astrometric offset of field stars and BDR J1750+3809 between the UKIRT and NIRI exposures, separated by about 6 yr.
Download figure:
Standard image High-resolution image
The apparent proper motion between the UKIRT exposure and the NIRI exposures is −120 mas yr−1, and 200 mas yr−1 along the R.A. and decl. axes, respectively. Based on our astrometric accuracy, we estimate the error in these estimates to be about 30 mas yr−1. We do not have a sufficient number of measurements to simultaneously solve for parallax, proper motion, and any orbital shift due to binarity.
Footnotes
- 11
The emission happens at the cyclotron frequency, νc ≈ 2.8 (B/Gauss) MHz or its second harmonic (Melrose & Dulk 1982), where B is the magnetic field strength.
- 12
In that case, we recommend the qualified "R" be dropped from the name.
- 13