


Abstract
Star formation is a multi-scale process that requires tracing cloud formation and stellar feedback within the local (≲kpc) and global galaxy environment. We present first results from two large observing programs on the Atacama Large Millimeter/submillimeter Array (ALMA)and the Very Large Telescope/Multi Unit Spectroscopic Explorer(VLT/MUSE), mapping cloud scales (1'' = 47 pc) in both molecular gas and star-forming tracers across 90 kpc2 of the central disk of NGC 628 to probe the physics of star formation. Systematic spatial offsets between molecular clouds and H ii regions illustrate the time evolution of star-forming regions. Using uniform sampling of both maps on 50–500 pc scales, we infer molecular gas depletion times of 1–3 Gyr, but also find that the increase of scatter in the star formation relation on small scales is consistent with gas and H ii regions being only weakly correlated at the cloud (50 pc) scale. This implies a short overlap phase for molecular clouds and H ii regions, which we test by directly matching our catalog of 1502 H ii regions and 738 GMCs. We uncover only 74 objects in the overlap phase, and we find depletion times >1 Gyr, significantly longer than previously reported for individual star-forming clouds in the Milky Way. Finally, we find no clear trends that relate variations in the depletion time observed on 500 pc scales to physical drivers (metallicity, molecular and stellar-mass surface density, molecular gas boundedness) on 50 pc scales.
1. Introduction
The star formation relation (Kennicutt 1989, 1998) identified a fundamental connection between the surface density of gas and star formation (SF). Measurements of integrated galaxies (Young et al. 1996; Saintonge et al. 2011) and resolved kpc scales (Kennicutt et al. 2007; Bigiel et al. 2008; Leroy et al. 2013; Meidt et al. 2015) have revealed that variations in the efficiency of SF correlate with local physical conditions and galactic dynamics. These conditions regulate the time evolution along the star-forming sequence (molecular cloud formation, collapse, ionization of H ii regions, and cloud disruption), with individual stages depending strongly on local physics and physical conditions relevant on the typical ∼50 pc scales of giant molecular clouds (GMCs) and H ii regions. Thus, to understand the regulation of SF it is essential to study both large scales (to understand the influence of galaxy dynamics and to time average the SF sequence) and small scales (to constrain the physics).
The Physics at High Angular resolution in Nearby GalaxieS (PHANGS) Collaboration is gathering the observations necessary to bridge these scales. With an Atacama Large Millimeter/submillimeter Array (ALMA) large program we are mapping the CO emission at cloud scales across the disks of 74 nearby galaxies (A. K. Leroy 2018, in preparation; Sun et al. 2018). At matched resolution, our Very Large Telescope/Multi Unit Spectroscopic Explorer (VLT/MUSE) large program is mapping the ionized gas and stellar populations across a subsample of 19 galaxies.
We present first results from these ALMA and MUSE surveys, comparing SF and molecular gas in NGC 628 at 50 pc resolution. This galaxy is a nearby (9.6 Mpc, Kreckel et al. 2017) face-on (i = 9°, Blanc et al. 2013b) type SAc grand-design spiral galaxy with a moderate star formation rate (SFR; 2.4 M⊙ yr−1; Sánchez et al. 2011). We examine variations in the gas and SF surface density (Σmol and ΣSFR) across the galaxy, parameterized by the molecular gas depletion time (τdep = Σmol/ΣSFR). Using uniform sampling, we trace changes in the depletion time as a function of scale, from 50–500 pc. We catalog and match individual GMCs and H ii regions to characterize the overlap phase in the SF sequence. Finally, we explore which local physical conditions drive large-scale variations in the depletion time.
2. Data
As the data reduction has been detailed in previous work (Kreckel et al. 2016, 2017; Leroy et al. 2016; Sun et al. 2018), we provide a brief summary here and describe the data products used.
2.1. Molecular Gas Tracers
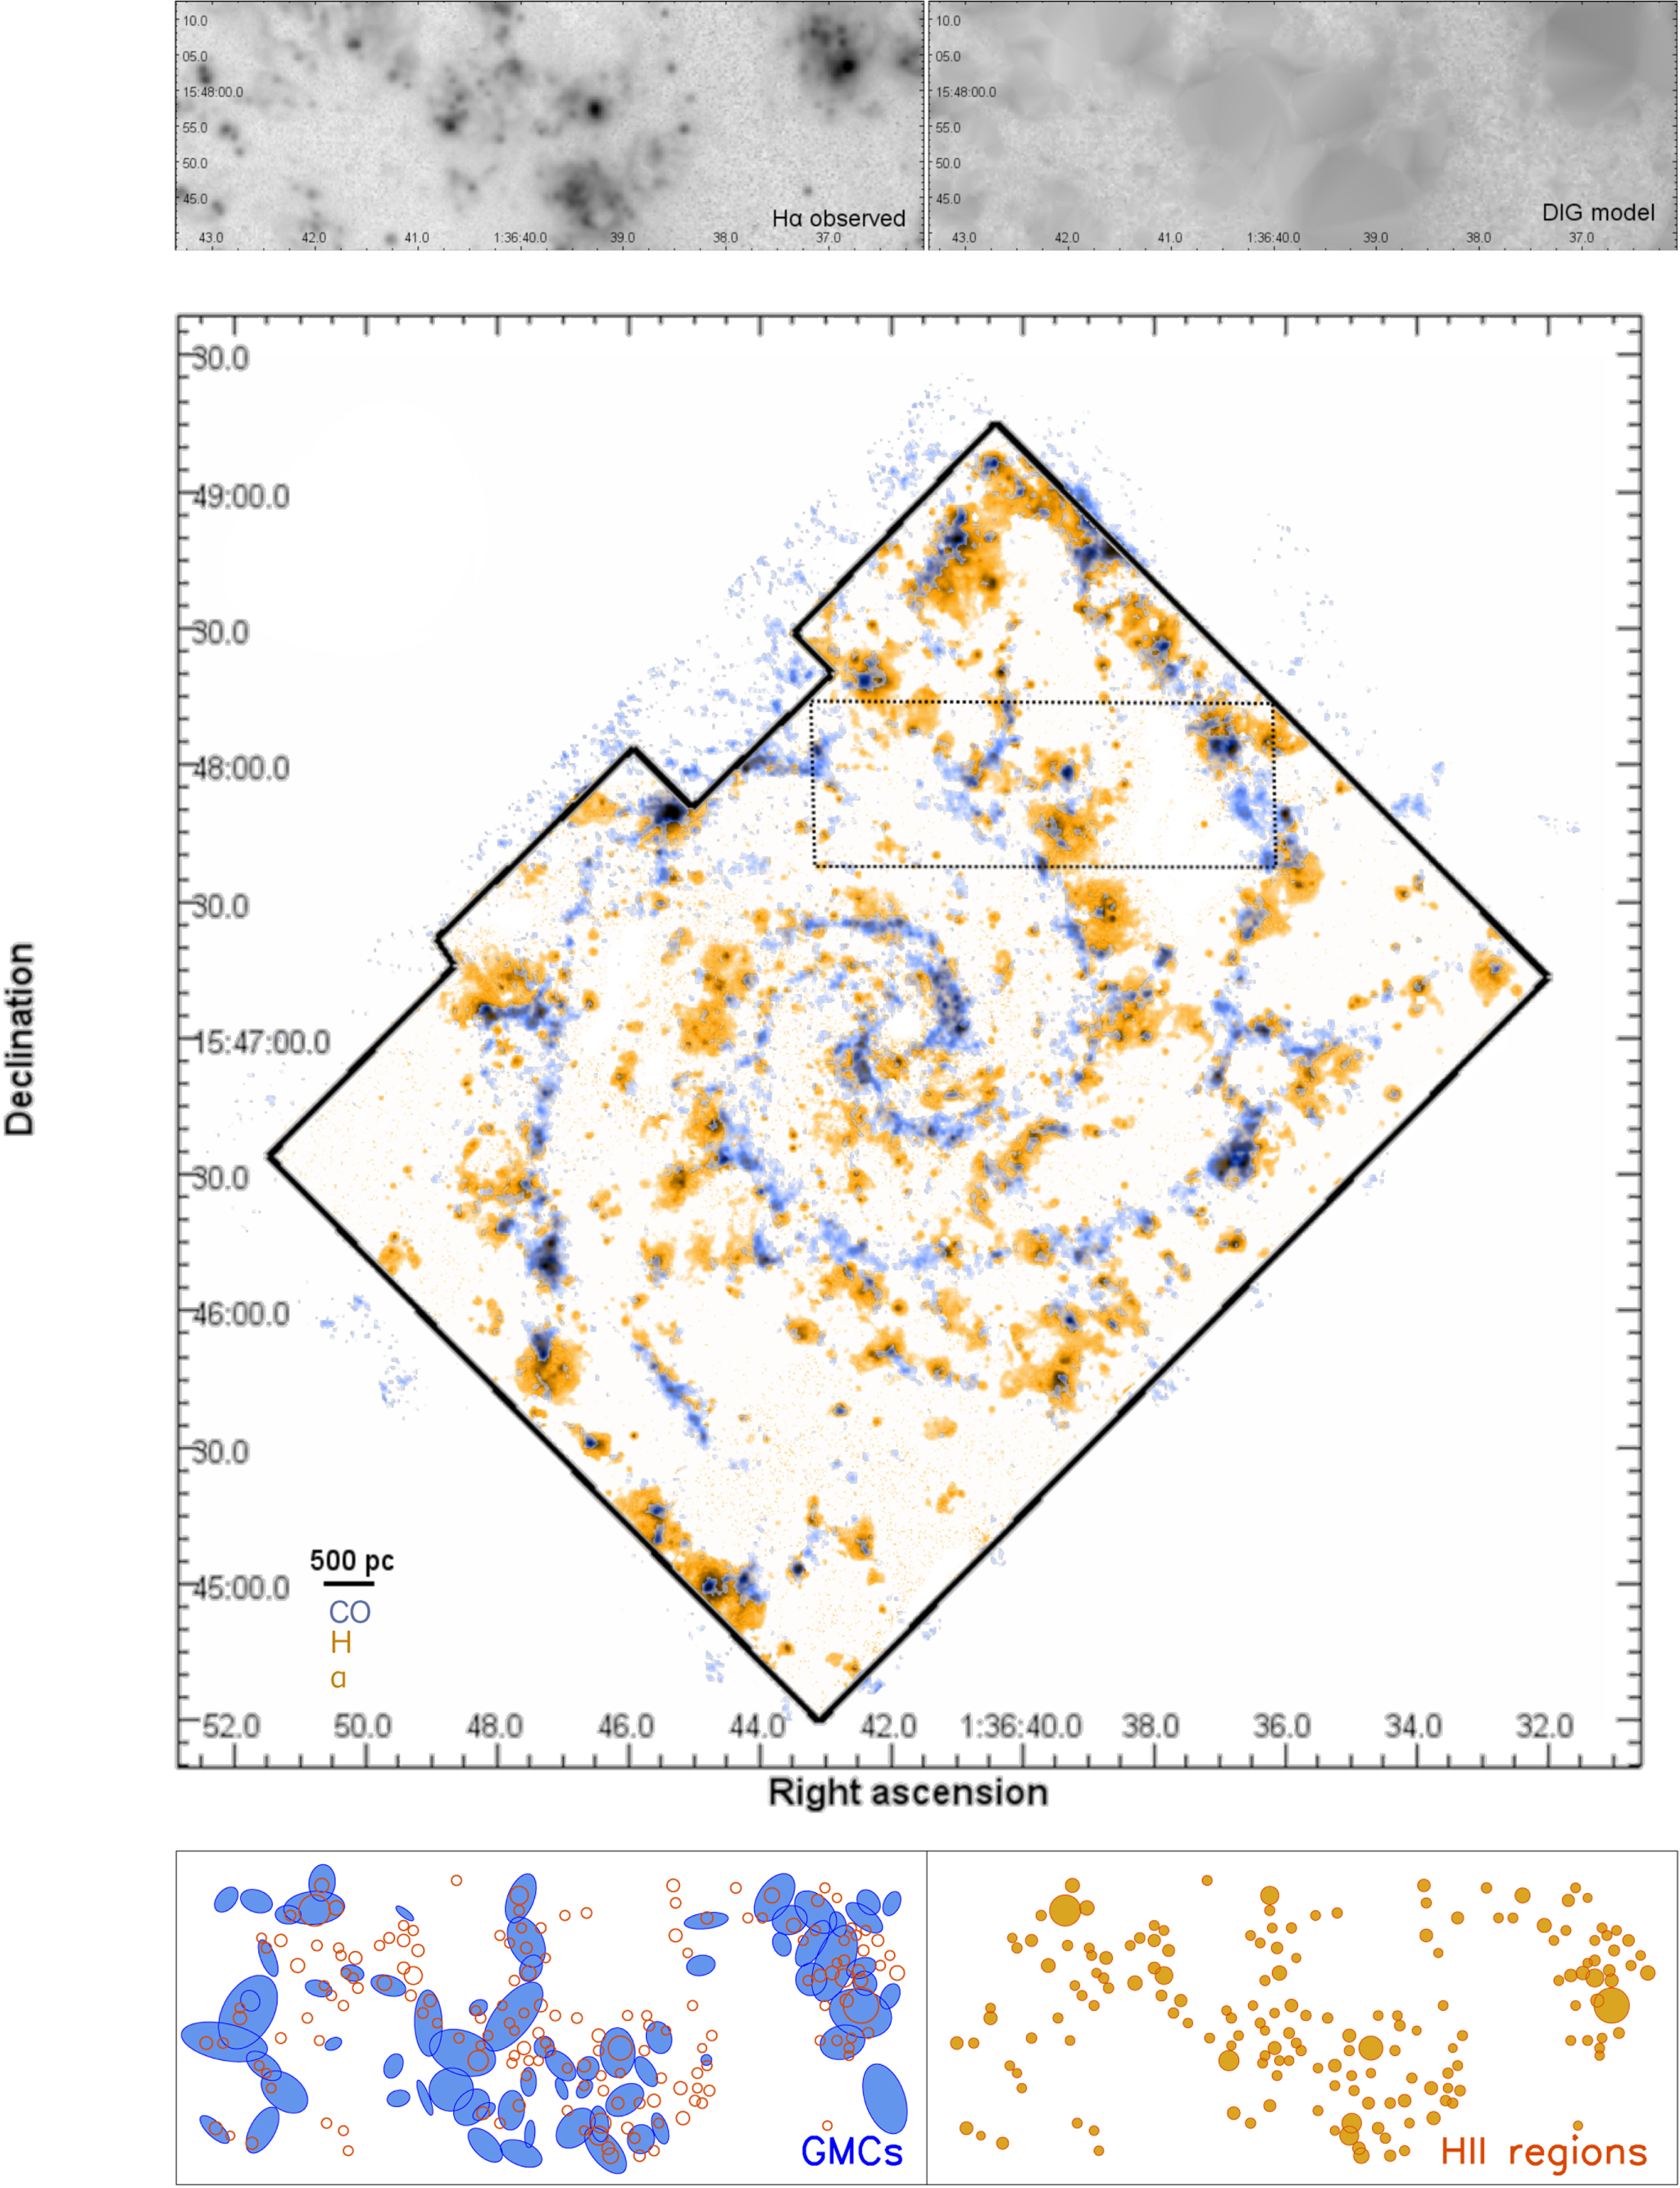
Our ALMA observations map CO (2–1) line emission across the central 3' × 4' (8.5 × 11.3 kpc2) star-forming disk (Figure 1). They include 12 m, 7 m, and total power observations to recover emission on all scales, achieve 1'' (47 pc) resolution, and reach an rms noise of 0.15 K over 2.5 km s−1 and (1σ) sensitivity to the integrated line intensity of 1.1 K km s−1 (7.5 M⊙ pc−2) over 20 km s−1.

Figure 1. Our ALMA CO (2–1) (blue) and MUSE Hα (orange) intensity maps cover the central 8.5 × 11.3 kpc2 star-forming disk of NGC 628 at 47 pc resolution (middle panel). GMCs and H ii regions are clearly resolved into discrete structures. A zoom-in region highlights the diffuse Hα emission surrounding compact H ii regions (top-left panel), which we model (top-right panel) and subtract, and demonstrates with simplified ellipses (bottom panels) the cataloged GMCs (blue) and H ii regions (orange).
Download figure:
Standard image High-resolution imageWe assume a fixed Milky Way CO-to-H2 conversion factor of pc−2 (K km s−1)−1 (Leroy et al. 2011; Blanc et al. 2013a; Sandstrom et al. 2013), which includes a factor of 1.36 to account for heavy elements. We assume a CO (2–1)/(1-0) brightness temperature ratio of R21 = 0.61 as measured by Cormier et al. (2018).

We identify 738 GMCs using CPROPS (Rosolowsky & Leroy 2006), an algorithm that identifies emission peaks and determines their macroscopic properties; we refer to E. Rosolowsky et al. (2018, in preparation) for further details. We find median cloud masses of 5.8 × 10⁵ M⊙ and median radii of 75 pc.
2.2. Star Formation Tracers
We obtained MUSE observations at 1'' seeing (Figure 1) that achieve 0 2 astrometric accuracy (calibrated off Sloan Digital Sky Survey (SDSS) r-band imaging; Kreckel et al. 2017), and use LZIFU (Ho et al. 2016) to simultaneously fit the stellar continuum and emission lines. We reach a 3σ surface brightness sensitivity for Hα of 1.5 × 10⁻¹⁷ erg s−1 cm−2 arcsec−2.
We correct for dust obscuration using the Balmer decrement assuming case B recombination, an electron temperature of 104 K, a Fitzpatrick (1999) extinction curve, and a Milky Way value of RV = 3.1 for all regions. This method shows good (∼5%) systematic agreement at high ΣSFR with a hybrid Hα+24 μm dust correction, suggesting that no star-forming regions are completely obscured. Hα is detected across 95% of the map; however, Hβ is only detected in ∼50% of pixels (corresponding to morphologically diffuse Hα emission). We assume a fixed AV = 1.3 mag where Hβ is not detected, consistent with typical H ii region values (0.5–1.5 mag) and ∼1 kpc integrated diffuse regions. We note that our results are not sensitive to this choice, as most of this more diffuse emission is subtracted from our SFR maps (Section 2.3).
We construct a catalog of 1502 H ii regions using HIIPhot (Thilker et al. 2000). We detect minimum Hα luminosities of 3 × 1036 erg s−1, with median luminosities of 1037 erg s−1 (comparable to the ionizing flux produced by a single O8V star; Schaerer & de Koter 1997) and radii of 35 pc (only marginally resolved). For each we calculate the gas-phase oxygen abundance using the theoretical strong line N2S2 diagnostic of Dopita et al. (2016).
We convert our Hα luminosities into SFR estimates following Murphy et al. (2011) as

We caution that on the scale of individual regions likely dominated by a single stellar population, the concept of a continuous SFR begins to break down (potentially leading to systematic underestimation of SFR by a factor of 2–3; Faesi et al. 2014).
2.3. Treatment of Diffuse Gas
The treatment of "diffuse" CO emission is an open, unsolved issue. While the existence of faint, spatially extended 12CO emission in some galaxies has been clearly established (Pety et al. 2013; Roman-Duval et al. 2016), the detailed structure and physical properties (e.g., density) of this gas—and its dependence on properties of the host galaxy—is less clear. In external galaxies, one cannot easily distinguish between a truly diffuse CO-emitting molecular phase and a uniform distribution of small clouds that are separated by less than the beam size. As the goal of this analysis is to compare the SF with the available molecular gas reservoir, we do not attempt to remove a diffuse CO gas component from our data.
As shown in Kreckel et al. (2016), a significant fraction (∼20%–50%) of the Hα emission in NGC 628 arises from a diffuse ionized gas (DIG) component, but its association with SF is not clear (Zurita et al. 2000; Zhang et al. 2017). We choose here to model and subtract the DIG emission from our SF calculations, with the caveat that we could be systematically underestimating the SFR on large scales.
We leverage the [S ii]/Hα> 0.5 line ratio to identify 10% of the total Hα flux (41% of the pixels) as pure DIG emission in our extinction-corrected Hα line map (Kreckel et al. 2016). We interpolate across the entire map, and subtract this DIG model from our extinction-corrected Hα map (Figure 1). This removes 16% of the flux at the location of cataloged H ii regions, and results in a total diffuse fraction of 36%.
3. Results
3.1. Scatter in the SF Relation—Variations with Scale
The tight correlation between SFR surface density and molecular gas surface density observed on >kpc scales in galaxies (Bigiel et al. 2008, 2011; Leroy et al. 2013; Utomo et al. 2017) breaks down on smaller scales due to stochastic sampling of the evolution of individual molecular clouds and SF regions (Onodera et al. 2010; Schruba et al. 2010; Kruijssen & Longmore 2014; Jameson et al. 2016). This is apparent in NGC 628 (Figure 1) by the clear displacement of the Hα and CO emission due to time evolution combined with the motion of the spiral pattern around the disk (Schinnerer et al. 2017). Figure 2 explores how the inferred depletion times and their scatter change over 50–500 pc scales. Individual data points show the surface density in (Nyquist sampled) apertures detected in both tracers uniformly sampling the emission maps at signal-to-noise ratio (S/N) > 3. The inset histograms show that a significant number of regions (50%–75%) are detected in only one tracer.

Figure 2. Variations in SFR surface density (ΣSFR) as a function of the molecular gas surface density (Σmol) on spatial scales ranging from 50 to 500 pc. The median inferred depletion time (τdep), scatter, and Spearman's rank correlation coefficient (ρ) and its significance (P) are shown. Constant depletion times (solid lines) and the median value (dashed line) are overplotted. Dotted lines show the 3σ sensitivity limits in each tracer. The distribution of regions detected in both tracers (solid) or only one (dotted) are shown as inset histograms. SF and molecular gas have substantial scatter on all scales.
Download figure:
Standard image High-resolution imageWe measure median gas depletion times of 1–3 Gyr, consistent with what was previously found for NGC 628 on ∼400 pc (Rebolledo et al. 2015) and 750 pc (Bigiel et al. 2008; Leroy et al. 2008, 2013) scales. At scales below 300 pc the molecular gas and SFR surface densities are largely uncorrelated (Spearman's rank correlation coefficient ρ ≈ 0.3), and even on larger scales the correlation remains weak (ρ ≈ 0.5). This weak correlation, combined with the large number of regions detected in only one tracer, implies that there is only a short overlap phase between molecular gas and young stars.
We observe an increased scatter in the depletion time (σ ≈ 0.4 dex) on small (<300 pc) scales, consistent with what has been observed in M51 (Blanc et al. 2009), M33 (Schruba et al. 2010), and the Large Magellanic Cloud (LMC) and the Small Magellanic Cloud (SMC; Jameson et al. 2016). By combining our results on small scales with complementary measurements for NGC 628 from the HERA CO-Line Extragalactic Survey (HERACLES) survey (Leroy et al. 2013), we can trace the change in scatter from 50 pc to 2.4 kpc scales (Figure 3), observing a flattening in the scatter below ∼300 pc.

Figure 3. Scatter in the depletion time as a function of scale, combining our 50–500 pc results (circles) with Leroy et al. (2013) at 600–2.4 kpc scales. Following Kruijssen & Longmore (2014), detailed modeling of the expected relation assuming uncorrelated neighboring regions (solid line) shows relatively good agreement and reproduces the flattening at small scales. Here we have adopted the following model parameters: Hα lifetime of 5 Myr (Haydon et al. 2018), GMC lifetime of 25 Myr, overlap timescale of 3 Myr, characteristic separation of 125 pc, equal flux ratio between isolated emission and the emission in overlap regions, a scatter due to luminosity evolution of the stars and gas of 0.3 dex, a scatter due to the molecular cloud mass spectrum of 0.33 dex (E. Rosolowsky et al. 2018, in preparation), and a scatter due to observational uncertainties of 0.1 dex. Many of these parameters are degenerate; however, we take here the best estimates currently available, and specifically measured within NGC 628 when possible (Chevance et al. 2018).
Download figure:
Standard image High-resolution imageIf neighboring star-forming regions are independent and uncorrelated, with evolutionary cycling as the only source of scatter, then we naively expect this relation to follow a simple power law (σ ∝ R−1; Leroy et al. 2013). However, accounting for additional scatter from the cloud or H ii region mass spectrum, flux evolution within a single evolutionary phase, and sensitivity limits, we expect uncorrelated SF to result in a flattening at the smallest spatial scales (Kruijssen & Longmore 2014; Kruijssen et al. 2018). Similarly, the smallest apertures contain on average only a single GMC and H ii region, which causes the scatter to decrease. The observed trend agrees qualitatively with the predictions of the Kruijssen & Longmore (2014) model (Figure 3), where for reference we show a curve of the model assuming standard parameter values, specifically measured within NGC 628 when possible (Chevance et al. 2018).
3.2. Direct Cloud-scale Constraints and Comparison to the Milky Way and Local Group Galaxies
Given our large sample of 738 GMCs and 1502 H ii regions, we expect some fraction of these will currently exist in a short overlap phase (Kawamura et al. 2009). To compare with cloud-based studies in the Milky Way and Local Group galaxies, we crossmatch all GMC and H ii region centers (crossmatch tolerance of 05 ≈ 20 pc) and find 74 matches (Figure 4, left). By eye, >90% of these look like associated objects and not chance alignments in crowded regions. The small fraction of overlapping regions implies that there is a quick time evolution between molecular gas clouds and young stars.

Figure 4. SFR as a function of GMC mass using two different methods of matching GMC and H ii region catalogs: overlapping centers (left panel) or summing all H ii regions within a given GMC footprint (right panel). A larger symbol size indicates if that GMC has more than one associated H ii region. We compare to literature results (see the text) and the Milky Way relation (extrapolation is shown as a dotted line; Vutisalchavakul et al. 2016). We recover a wider range of depletion times and little correlation between the two tracers, unlike in previous studies, but is consistent with the expectations for scatter driven by evolutionary cycling.
Download figure:
Standard image High-resolution imageWe infer integrated cloud-scale depletion times (MGMC/SFR) of 1–10 Gyr, with a median value (3 Gyr) that is slightly longer than the depletion times that we measure over larger scales (Figure 2). As each GMC may collapse to form multiple stars and star clusters, all additional H ii regions within the GMC footprint are also included in calculating the associated SFR. We note that GMCs that are not fully decomposed could bias us to longer depletion times.
As the typical GMC size is larger than the typical H ii region (75 versus 35 pc in radius, Figure 1), we perform a second catalog match by loosening the requirement that the selected GMCs must have H ii region counterparts within 05, and instead sum up all H ii regions where the center falls within a given GMC's footprint. By selecting for peaks in the molecular gas distribution and measuring the associated SFR, an approach that biases us to longer depletion times (∼10 Gyr), we find 162 GMCs with associated SF (Figure 4, right), of which 40% have two or more associated H ii regions.
Milky Way studies (Lada et al. 2010; Murray 2011; Evans et al. 2014; Vutisalchavakul et al. 2016) show systematically shorter (100 Myr to 1 Gyr) depletion times (Figure 4), with over two orders of magnitude scatter (partly driven by methodological differences between studies). We find good agreement when extrapolating the trend identified by Vutisalchavakul et al. (2016), though our clouds are an order of magnitude more massive. Few such cloud-scale studies are available for external galaxies. Ochsendorf et al. (2017) observed long (∼1 Gyr) depletion times as a function of GMC mass in the LMC. Targeting H ii regions in NGC 300, Faesi et al. (2014) measured significantly short (230 Myr) depletion times on 250 pc scales. We note that studies preselecting only star-forming regions biases their results to shorter depletion times (Kruijssen et al. 2018), just as our preselection of GMCs (Figure 4, right panel) biases us to longer depletion times.
3.3. Connecting with Physical Conditions on 50 pc Scales

We observe ∼0.3 dex scatter in τdep on large scales. In M51, Meidt et al. (2013) and Leroy et al. (2017) found such variations to correlate with the apparent gravitational boundedness of the gas, while theories focused on the gravitational free-fall time predict correlations between τdep and the local mean cloud density. We test for such variations by calculating τdep at 500 pc scales and then correlating this with the local mass-weighted mean properties of the molecular gas. This methodology (Leroy et al. 2016) tests how the mean cloud-scale properties affect the depletion time.
In Figure 5 we consider trends with the molecular gas, SFR, and stellar surface densities. The latter is modeled from Spitzer imaging and cleaned of non-stellar emission (Querejeta et al. 2015). We also explore the impact of local physical conditions, including the molecular gas boundedness (, where σv is the line equivalent width), gas-phase metallicity measured within H ii regions, and H ii region clustering (parameterized by n3, the average projected distance to the three nearest neighbors).


Figure 5. Variations in the depletion time (τdep) at 500 pc scale as a function of the surface density (top, left to right) of different physical parameters (see the text). These properties reflect the luminosity-weighted average value observed on 50 pc scales within 500 pc regions, with Spearman's rank correlation coefficient (ρ) and significance (P) shown. Results for M51 are shown in gray (Leroy et al. 2017). We observe the strongest correlation with the SFR surface density; however, this may be driven by correlated axes and the larger dynamic range probed in this tracer compared to the molecular gas surface density. The central star-forming ring (red) also shows systematically longer depletion times.
Download figure:
Standard image High-resolution image
We observe the strongest correlation with SFR surface density; however, this parameter covers a wider dynamic range than the molecular gas surface density (which shows no correlation). Random sampling of the CO surface densities does not change the strength of this correlation, suggesting that it is purely driven through the inverse relationship with τdep. The central star-forming ring (at high stellar-mass surface densities) shows systematically longer depletion times (4–8 Gyr), though the reported decrease in CO-to-H2 conversion factor in the center implies an overestimation by up to a factor of two (Blanc et al. 2013a; Sandstrom et al. 2013) but cannot fully account for the offset that we see. Gas that is more bound (larger B) was found in M51 to exhibit a shorter depletion time (Leroy et al. 2017); however, we observe no such correlation in NGC 628. This suggests that the key driver for long depletion times in M51 is not simply the virial parameter of the molecular gas, but rather large-scale dynamical effects as suggested by Meidt et al. (2013). Other trends in NGC 628 are only tentative (ρ ≤ 0.3), but suggest shorter depletion times occur in the outer disk (lower stellar-mass surface densities) where H ii regions are more clustered (lower n3). A larger sample of galaxies is needed to expand the parameter space explored here.
4. Implications
Although star formation and molecular gas are organized into similar structures in NGC 628 (Figure 1), physical offsets of more than 100 pc are apparent and uniform sampling reveals large variations in depletion time on all scales (50–500 pc, Figure 2). As the scatter among the local depletion times is well modeled by star formation in neighboring regions being uncorrelated (Figure 3), the rotation of the spiral pattern organizing and concentrating the molecular gas, combined with the time evolution of star forming regions, results in GMCs and H ii regions being only weakly correlated at cloud scales.
Our wide map provides the statistics to identify 74 spatially coincident objects existing in a short overlap phase out of 738 GMCs and 1502 H ii regions. These exhibit longer depletion times (1–10 Gyr) than individual Milky Way clouds (Figure 4). Even if the SFR of individual regions is systematically underestimated by a factor of 2–3 (based on DIG subtraction and lack of SF history modeling), and our GMCs are not fully decomposed, this cannot account for the discrepancy with previous results. As ∼40% of GMCs with associated SF overlap with multiple H ii regions, it is clear that there is a non-trivial connection between GMC mass function and H ii region luminosity function.
The physical parameters that we investigate (gas boundedness, metallicity, H ii region clustering, and molecular gas, SFR and stellar surface density) do not strongly drive the large-scale variations in τdep that we observe across the disk (Figure 5). Our results show only suggestive trends, with shorter depletion times occurring in the outer disk (>5 kpc) where H ii regions are more clustered and the surface density of SF is higher. Alternately, this could suggest that variations in τdep on 500 pc scales are predominantly driven by dynamical effects on even larger scales. We do observe systematically longer depletion times in the central star-forming ring, where variations in the CO-to-H2 conversion factor account for only some of the offset (Blanc et al. 2013a; Sandstrom et al. 2013), suggesting that the dynamical environment plays an important role.
Isolating the local physical conditions that drive changes in the SF efficiency requires a more systematic sampling of the parameter space, beyond what is possible in this first case study.
We thank the referee for helpful comments that improved this work. K.K. gratefully acknowledges support from grant KR 4598/1-2 from the German Research Foundation (DFG) Priority Program 1573. J.M.D.K. and M.C. gratefully acknowledge funding from the DFG in the form of an Emmy Noether Research Group (grant No. KR4801/1-1). J.M.D.K. gratefully acknowledges funding from the European Research Council (ERC) under the European Union's Horizon 2020 Research and Innovation Programme via the ERC Starting Grant MUSTANG (grant agreement No. 714907). B.G. gratefully acknowledges the support of the Australian Research Council as the recipient of a Future Fellowship (FT140101202). F.B. acknowledges funding from the European Union's Horizon 2020 Research and Innovation Programme (grant agreement No. 726384—EMPIRE). G.B. is supported by CONICYT/FONDECYT, Programa de Iniciación, Folio 11150220. A.H. acknowledges support from the Centre National d'Etudes Spatiales (CNES). E.R. acknowledges the support of the Natural Sciences and Engineering Research Council of Canada (NSERC), funding reference No. RGPIN-2017-03987. R.M. and E.S. acknowledge funding from the ERC under the European Union's Horizon 2020 Research and Innovation Programme (grant agreement No. 694343). J.P. acknowledges support by the Programme National "Physique et Chimie du Milieu Interstellaire"(PCMI) of CNRS/INSU with INC/INP co-funded by CEA and CNES.
Based on observations collected at the European Organisation for Astronomical Research in the Southern Hemisphere under ESO programme 094.C-0623, ID 095.C-0473 and 098.C-0484.
This paper makes use of the following ALMA data: ADS/JAO.ALMA#2012.0.00650.S. ALMA is a partnership of ESO (representing its member states), NSF (USA) and NINS (Japan), together with NRC (Canada), MOST and ASIAA (Taiwan), and KASI (Republic of Korea), in cooperation with the Republic of Chile. The Joint ALMA Observatory is operated by ESO, AUI/NRAO and NAOJ. The National Radio Astronomy Observatory is a facility of the National Science Foundation operated under cooperative agreement by Associated Universities, Inc.