


Abstract
We report on the detection of waves of magnetic-field variations that were associated with flare-excited sunquake waves. An X-9.3 flare that occurred on 2017 September 6 excited strong sunquakes, and the sunquake waves were observed sweeping across the flare's host active region. This rare event gives us an unprecedented opportunity to study responses of magnetic field to passing sunquake waves. A wave of magnetic-field variations was observed in each of the two sunspots that the sunquake waves swept through, and the time–distance relations for the waves observed in magnetic field and Doppler velocity are similar. The phase relations measured between, as well as the oscillatory power distributions calculated from, the Doppler velocity variations and magnetic-field variations associated with the sunquake waves are compared with those obtained from the background waves in the same areas of the sunspot umbra and penumbra separately. The phase relations seem to favor the theory that the waves of magnetic variations are owing to opacity changes associated with the passing sunquake waves. The comparisons of phases and power distributions indicate that the background magnetic variations observed in sunspots are a combination of various wave modes, and fast magnetoacoustic waves only account for a fraction of those magnetic variations.
Export citation and abstract BibTeX RIS
1. Introduction
Sunquakes are detectable helioseismic waves excited by solar flares (Kosovichev & Zharkova 1998). Although sunquake waves exhibit as expanding ripples in the photosphere, they are mostly p-mode waves refracting back to the surface after traveling into the Sun's interior. Sunquake events are often studied by constructing time and distance relations of the waves (e.g., Kosovichev & Zharkova 1998; Zharkov et al. 2011), or reconstructing oscillatory signals at the sunquake source using a helioseismic holography technique (e.g., Donea et al. 2000; Moradi et al. 2007). Such events are often excited by powerful X-class flares, but are also found associated with M-class or even weaker flares (Martínez-Oliveros et al. 2008; Sharykin et al. 2015; Green et al. 2017). And overall, sunquakes are rare events that accompany only a fraction of solar flares (Buitrago-Casas et al. 2015; R. Chen & J. Zhao 2018, in preparation).
While sunquake waves are mostly visible outside of sunspots, the inside of sunspots are replete with different types of magnetohydrodynamic (MHD) waves (Bogdan & Judge 2006). The observed line-of-sight (LOS) velocity and intensity fluctuations show a frequency primarily between 2.5 and 6.0 mHz, indicating that the dominant modes inside sunspots are magnetoacoustic waves, the counterparts of the ubiquitous p-mode waves. However, observations have often given uncertain conclusions on whether magnetic field oscillates inside sunspots (e.g., Khomenko & Collados 2015). Despite the ambiguity in magnetic field oscillation, various authors have studied the phase relation between the time sequences of velocity and magnetic field and suggested the existence of Alfvén waves in the sunspots' photospheric level (Ulrich 1996; Lites et al. 1998; Norton et al. 1999). Later analysis has suggested that the fluctuations in magnetic field are likely due to the sausage- and kink-mode waves, and the phase relations can be explained by a superposition of ascending and descending waves reflected from the chromosphere (Fujimura & Tsuneta 2009).
Most sunquake events are observed in the LOS Doppler velocity, and some events are sufficiently strong to be detectable in intensity. However, to the best of our knowledge a wave of magnetic-field variations, caused by solar flares and traveling together with sunquake waves, has never been reported, although permanent and transient magnetic field changes at and near flare ribbons have been studied in detail (e.g., Kosovichev & Zharkova 2001; Wang & Liu 2015). In this Letter, we report the detection of a wave of magnetic-field variations inside sunspots that accompany sunquake waves excited by an X-9.3 flare. The simultaneous observations of the waves in magnetic field and Doppler velocity give us an unprecedented opportunity to study phase relations between these two observables for a wave with a known origin and nature, and this will help increase the understanding of the abundant wave phenomena inside of sunspots. This Letter is organized as follows: we introduce observations in Section 2, study the time–distance relations for different observables and explore the phase relations between them in Section 3, and discuss our results in Section 4.
2. Observation
NOAA Active Region 12673 (Figure 1) is a flare-prolific region that had one of the fastest magnetic flux emergence rates ever observed (Sun & Norton 2017). A GOES X-9.3 flare (SOL2017-09-06T11:53) occurred in this active region at 11:53 UT, 2017 September 6 with a disk location of S09W34, and excited a powerful sunquake.3 Following the method recently developed by R. Chen & J. Zhao (2018, in preparation), we construct a helioseismic power map at the initiation time of the sunquake (Figure 2(a)). At the shown time, this sunquake event is composed of three distinct epicenters (or sunquake wave sources) and, based on our calculation, it is by far the strongest sunquake event in Solar Cycle 24 (compare to the list in R. Chen & J. Zhao 2018, in preparation).
Figure 1. (a) HMI continuum intensity, (b) line-core intensity, (c) Doppler velocity, and (d) magnetic field observations of the active region at 12:18:00 UT, 25 minutes after the flare onset. Letters "A" and "B" in panel (a) indicate the two sunspots that the sunquake waves swept across and caused detectable magnetic waves. Sunspot "A" is the western portion of the main sunspot group, and "B" is separated from the main group. Running-difference maps of Doppler velocity (e) and magnetic field (f) are taken at the same time as images in panels (c) and (d). The green arrows indicate the locations of the waves observed in Doppler velocity and magnetic field at this time.
(An animation of this figure is available.)
Download figure:
Video Standard image High-resolution image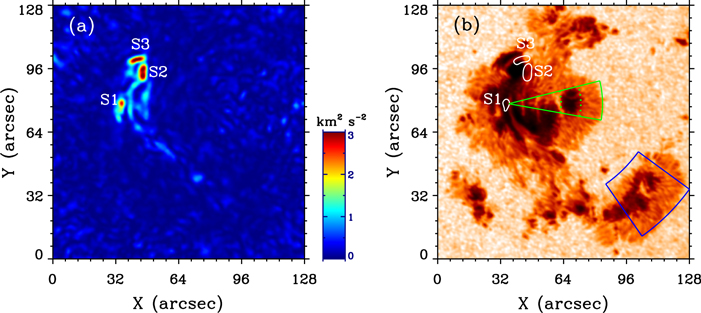
Figure 2. (a) Map of helioseismic power at 11:56:15 UT, reconstructed from the sunquake waves observed in Doppler velocity through a helioseismic holography method. "S1," "S2," and "S3" represent the three distinct sunquake epicenters. (b) Continuum intensity map overlapped by white contours showing the locations of epicenters. The solid green lines delimit the area inside which observations are taken to calculate the time–distance diagrams shown in Figure 3, and the blue lines delimit the area for results shown in Figure 4. Results for "umbra" shown in Figure 5 are calculated from inside the green-line delimited area between the dashed arcs, and results for "penumbra" are from the area between the right dashed arc and the green solid arc.
Download figure:
Standard image High-resolution imageThe sunquake waves from different epicenters travel in all directions; however, in this study we focus only on two segments of the expanding waves that swept across two sunspots (marked as "A" and "B" in Figure 1(a)), located far from the flaring regions and epicenters. In the studied areas, waves are not only observed in Doppler velocity and intensity that are typical for strong sunquake events, but are also observed in magnetic field. Figures 1(a)–(d) show sample images of the continuum intensity, line-core intensity, Doppler velocity, and LOS magnetic field observed by the Helioseismic and Magnetic Imager (HMI; Scherrer et al. 2012; Schou et al. 2012) on board the Solar Dynamics Observatory (SDO; Pesnell et al. 2012). For better visibility of the waves observed in these observables, running-difference data are used in the analysis throughout Section 3, and Figures 1(e), (f) show examples of the waves observed in Doppler velocity and LOS magnetic field (see the online animation for the apparent traveling of the waves).
For most sunquake events, waves only start to be detectable about 20 minutes after the onset of flares when waves emerge outside of active regions, i.e., non-magnetic areas. However, for this X-9.3 flare that occurred in a very large active region, the sunquake waves became detectable only about 10 minutes after the flare started. The waves' west and southwest segments swept across sunspots "A" and "B" and caused a wave of magnetic-field variations. The simultaneous observation of the waves in magnetic field, Doppler velocity, and intensity allows us to study how magnetic field responds to sunquake waves.
3. Analysis and Results
To study the waves in the areas of interest, we construct time–distance diagrams for the two waves from two separate epicenters using the data in the areas delimited by the green and blue lines in Figure 2(b). For the wave sweeping across sunspot "A," the selected area is a circular sector with its center at the epicenter S1. Time sequences taken at locations with a same distance to S1 are averaged to enhance the signal-to-noise ratio (S/N), and the resultant time–distance diagrams for all four observables are shown in Figure 3. All of the observables show clear signals of the passing waves between distances of 10 and 48 arcsec from S1. Within 10 arcsec, all observables show some anomalies near the flare ribbons in the photosphere. The earliest sign of sunquake waves is visible about 10 minutes after the flare onset, substantially sooner than a typical sunquake event. The oscillatory amplitude is also large: at many locations, the Doppler-velocity variation is larger than 300 m s−1, and the magnetic-field variation is larger than 40 G. Remarkably, the wave pattern exhibited in the magnetic-field time–distance diagram and the magnitude of the magnetic variations were not observed in previous sunquake events.
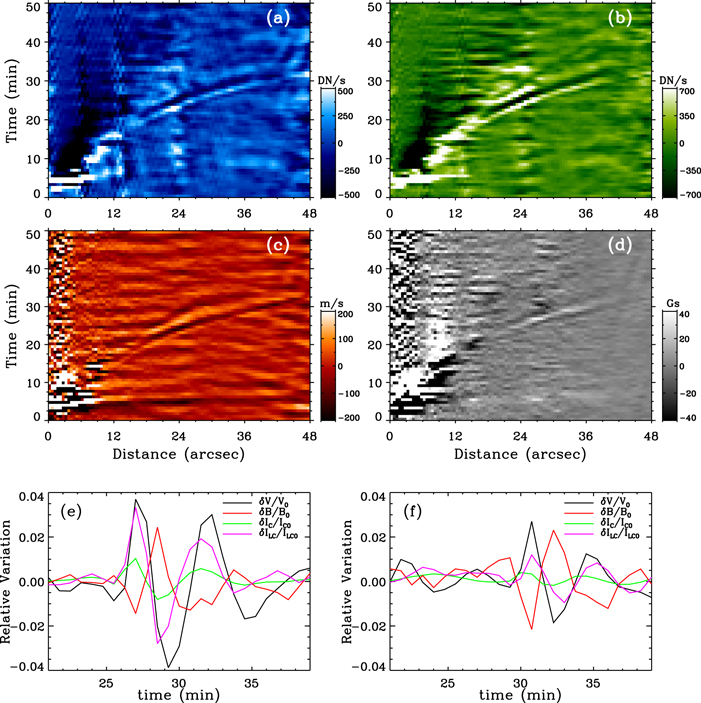
Figure 3. Time–distance diagrams for the flare-excited waves using the HMI data of (a) continuum intensity, (b) line-core intensity, (c) Doppler velocity, and (d) LOS magnetic field. Signals within distances of 26.5–35.0 arcsec and of 35.0–47.5 arcsec in each panel are averaged to give relative amplitude variations for the umbra (e) and penumbra (f), respectively. The v0, B0, Ic0, and ILC0 are values averaged at the same locations from a period of 50 minutes before the flare. The time in all panels is relative to 11:52:30UT.
Download figure:
Standard image High-resolution imageThe same analysis is performed for the wave that originated from S2 or S3 and swept across sunspot "B," and the time–distance diagrams are exhibited in Figure 4. This sunquake wave and the wave of magnetic-field variations, although much weaker and noisier than those shown in Figure 3, can still be distinctly seen between about 38 and 48 minutes after the flare onset. The oscillatory amplitudes drop to about 80 m s−1 for Doppler velocity and about 8 G for magnetic field.

Figure 4. Same as in panels (a)–(d) of Figure 3, but obtained for the wave sweeping across sunspot "B." The time in all of the panels is also relative to 11:52:30 UT.
Download figure:
Standard image High-resolution imageTo better understand the waves of magnetic-field variations, it is useful to compare their observational properties with the sunquake waves observed in other observables, particularly Doppler velocity. The observations from sunspot "A," which have a better S/N than those from sunspot "B," are used in the following analysis. Because the wave shows distinctly different properties in the umbra and penumbra, the wave signals are analyzed separately in these two entities, the locations of which are illustrated in Figure 2(b). More importantly, it is well known that both sunspot umbrae and penumbrae host various magnetohydrodynamic (MHD) waves, therefore it is desirable to compare the properties of the sunquake wave, whose cause and nature are relatively better known, with those of the background waves inside of the sunspot, whose cause and nature are less clear. For a comparison analysis, we select exactly the same areas of the umbra and penumbra for a period of 8 hr immediately after the sunquake wave passed.
For the sunquake wave, the oscillatory signals for each observable (Figures 5(e)–(f)) are obtained by averaging the time–distance diagrams in Figures 3(a)–(d), with a distance of 26.5–35.0 arcsec for the umbra and a distance of 35.0–47.5 arcsec for the penumbra (see Figure 2(b)). The signals are averaged after the signals at different distances are shifted in time to be aligned in phase, and the amount of time shifts at different distances is determined from a theoretical time–distance relation for p-mode waves (see Equation (1) through 10 of D'Silva & Duvall 1995). The amount of shifts is no greater than 1.6 minutes in the largest distance. Although the theoretical relation is derived from a quiet-Sun model, it is valid here for waves traveling through active regions, for a travel distance of 26.5–47.5 arcsec, because only relative time shifts are used. It can be seen that in both the umbra and penumbra, the relative oscillatory amplitude is strongest in Doppler velocity and weakest, yet distinct, in continuum intensity.
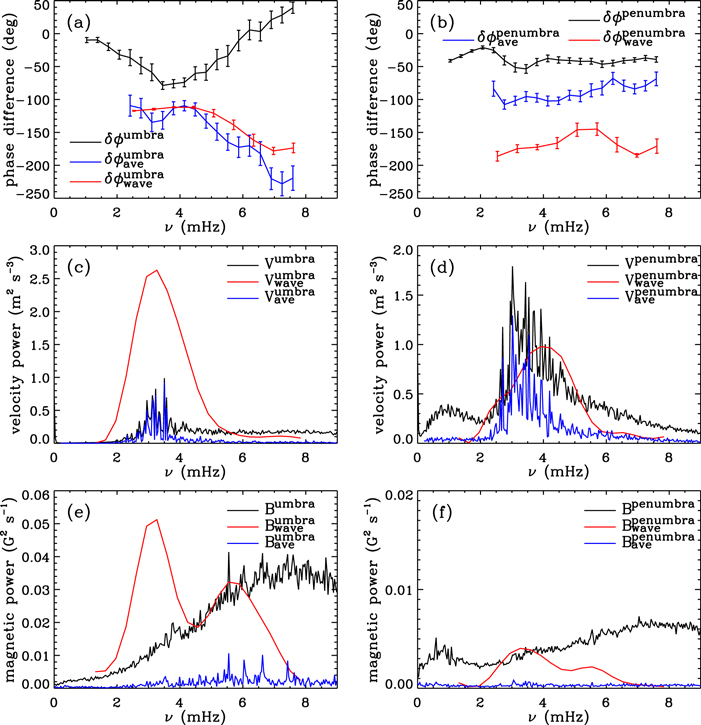
Figure 5. Comparison of the sunquake waves, background waves, and averaged background waves in the umbra and penumbra. The left (right) column shows results from the umbra (penumbra). The top panels show phase differences between the Doppler-velocity and magnetic-field signals, with the negative sign illustrating that the Doppler signal leads the magnetic signal. The middle panels show the oscillatory power measured from Doppler velocity, and the bottom panels show the oscillatory power measured from magnetic-field variations. Note that the vertical axis scales for the umbra and penumbra are different for both the velocity and magnetic power.
Download figure:
Standard image High-resolution image
For the oscillatory phases, both the Doppler and the two intensity signals lead the magnetic signals by about a half cycle in both the umbra and penumbra. Here, it is worth pointing out that the studied area has a positive magnetic polarity and the upward velocity is defined as positive, because the phases can be different if the polarity is negative or the velocity direction is otherwise defined. The phase differences between the Doppler and magnetic signals (hereafter,  ) in the umbra and penumbra,
  and
and  , are then calculated through cross-correlating the magnetic and Doppler signals shown in Figures 3(e), (f). The cross-correlation calculation is done in the Fourier domain so that the frequency dependence can be retained. Because the oscillatory signals are only 19 minutes long, artifacts may arise in the Fourier transform due to the data truncation, and this results in lower and higher frequencies becoming unreliable and being abandoned. As shown in Figures 5(a), (b), in the umbra, the velocity variations lead the magnetic variations by about 120° between 2.5 and 5.0 mHz, and the phase difference gradually grows over −180° for higher frequencies. In the penumbra, the
  remains relatively flat and close to −170° across all frequencies.
As a comparison,  is calculated for the umbra and penumbra background waves using the 8 hr long comparison data. We get two sets of
  's following two different processes:
  and
and  are obtained by first calculating
  's using signals at each pixel, and then averaging the
  's throughout the selected umbra and penumbra areas as designated in Figure 2. For the second process, both the umbra and penumbra are divided into square patches, each patch having 8 × 8 pixels; the umbra has five such patches and the penumbra has 15. The
  's are calculated from averaged signals in each patch, and
  and
and  are obtained by averaging these
  's in the umbra and penumbra, respectively. The latter process averages away oscillations that do not spread in space or are due to noises, keeping primarily magnetoacoustic waves that have a characteristic scale similar to sunquake waves. As shown in Figures 5(a), (b), in the umbra, the
  and
and  are similar but differ from
  substantially; in the penumbra, all three
  's are different from each other. All of the
  's measured in the umbra show a stronger frequency dependence than those measured in the penumbra. Meanwhile, each individual
  , from the sunquake wave, the background waves, or the averaged background waves, measured in the umbra differ from the corresponding
  measured in the penumbra.
The oscillatory power calculated from the Doppler and magnetic data for the sunquake wave, background waves, and averaged background waves in the umbra and penumbra are also compared (Figures 5(c)–(f)). For Doppler velocity, it can be seen that in the umbra that both the sunquake wave and background waves peak between 3 and 4 mHz, with the former about three times stronger than the latter. The power of the magnetic variations shows a major peak near 3.2 mHz, consistent with the Doppler signals, and a weak peak around 5.6 mHz that does not have a Doppler counterpart. However, the magnetic power of both the unaveraged and averaged background waves does not show a substantial enhancement near 3.2 mHz but shows some enhancement near 5.6 mHz. In the penumbra, for Doppler signals, the sunquake wave and background waves show similar amount of power, but peaks near 4.0 and 3.0 mHz, respectively. For the magnetic field, the sunquake wave again shows two distinct power peaks near 3.2 and 5.6 mHz, and the averaged background waves show only negligible enhancement between 3 and 4 mHz.
4. Discussion
A powerful X-9.3 flare occurring in a very large sunspot group allows for the detection of sunquake waves inside the active region, and gives us a rare chance to study the magnetic field responses to sunquake waves. The magnetic field of two sunspots in this active region showed oscillatory variations accompanying the passing sunquake waves. Our analysis shows that both the frequency-dependent power distribution and the frequency-dependent phase differences between the magnetic and Doppler variations measured from the sunquake wave are distinctly different from those measured from the background variations in the same area.
Because the wave of magnetic-field variations associated with a sunquake wave was not observed before, we need to be cautious when assessing whether it is a true phenomenon or an observational artifact. It is well known that for the instrument Solar and Heliospheric Observatory/Michelson Doppler Imager (SOHO/MDI; Scherrer et al. 1995), p-mode oscillatory velocity could leak into magnetic field, but this is not a significant issue for the HMI. It can be easily seen in Figure 5 that, despite the clear oscillatory power enhancement in the Doppler signals between 2.5 and 5.0 mHz for background waves inside of the sunspot, the power of magnetic field does not show a corresponding enhancement. However, the calibration of the HMI magnetic field data has its own problems. When Doppler velocity (spacecraft orbital velocity plus LOS velocity on the Sun) is large, the spectrum line's response to the velocity is no longer linear, and this causes a miscalibration in magnetic field (e.g., Hoeksema et al. 2014). Employing an empirical equation by Hoeksema et al. (2014), we estimate that a Doppler-velocity oscillation of 300 m s−1 (see Section 3), on top of the −1200 m s−1 orbital and the Sun's velocity in this area, causes a magnetic-field variation of at most 7.5 G, while the observed variation of magnetic field is about 40 G. That is, while the miscalibration does not fully account for the observed magnetic variations, the amplitude of variations is possibly altered. However, it is unlikely that all of the miscalibration is in phase with the observed wave of magnetic variations. Furthermore, scattered light in sunspot umbrae, which constitutes about 30% of HMI-observed light in the umbrae (Couvidat et al. 2016), is another factor influencing a precise determination of velocity and magnetic field measurements in the umbrae. While the scattered light cannot be a cause of the observed wave phenomenon, it likely introduces errors in our calculation of phase relations in the umbra.
The fact that the wave of magnetic variations follow a time–distance relation similar to the Doppler-observed sunquake wave (mostly p-mode), and that the magnetic wave shows a power enhancement at the p-mode dominating frequencies, demonstrates that the magnetic waves are directly caused by the sunquake waves. It is worth emphasizing that, despite that the sunquake waves are observed as surface expanding ripples, they are actually mostly radial oscillations that arrive at the surface from beneath with consecutive time delays and form a surface wave pattern. The magnetic field is unavoidably perturbed by the traveling magnetoacoustic waves, but are the intrinsic magnetic oscillations strong enough to be observed in the photosphere, or the observed waves of magnetic variations are due to the time-dependent opacity changes that are caused by the sunquake waves on the surface? Through numerical simulations, Khomenko et al. (2003) showed the profiles of frequency-dependent  under two possible causes, intrinsic magnetic oscillations and opacity changes, for slow and fast magnetoacoustic waves separately. Their results can help us to determine the possible causes of the observed waves of magnetic variations. Because the magnetic wave was observed nearly simultaneously with the sunquake wave in our observation, it must be a fast rather than a slow magnetoacoustic wave that takes tens of minutes to arrive at the surface. Comparing the
  and
and  in Figure 5 with the phases of fast-mode waves shown in Figures 6 and 8 of Khomenko et al. (2003), one finds that our measured phase differences are similar to those in the case of opacity-caused variations, although the frequency dependence of phases is not in agreement. This comparison seems to favor the theory that the observed magnetic wave is due to the opacity changes, but more detailed modeling is certainly needed to understand the frequency dependence. Meanwhile, we cannot rule out the possibility that the horizontal components of the magnetoacoustic waves, which become non-negligible with inclined magnetic field, may sway the magnetic-field lines and cause the observed magnetic variations.
Because sunquake waves are fast magnetoacoustic waves that stand out from the ambient background waves, the phase relations and power distributions for the sunquake waves can thus be used to explore the wave properties in sunspots. In the umbra, the fact that the  and
and  are similar implies that the averaged background waves are likely primarily fast magnetoacoustic waves, but the fact that the power ratio of
  and
and  differ from the power ratio of
  and
and  seems to indicate that the physical causes of the two waves are different. That both the
  and
and  differ from the
  indicates that the ambient background waves are composed of other wave modes than the fast magnetoacoustic waves, and these modes, which do not have a spatial spread, together with photon noises, scattered light, and convection, make up a large fraction of the magnetic power. In the penumbra, the
  differs from the
  and both of them differ from the
  as well, implying that in the penumbra, where magnetic-field lines are mostly inclined, the fast magnetoacoustic waves are not dominant in the averaged background (magnetoacoustic) waves. Such analyses of phase relations and power distributions indicate that the background waves in sunspots are possibly composed of multiple wave modes caused by various physical processes, and it is difficult to disentangle these modes and study one mode individually only from phase relations except when, like in this studied event, a flare excites a specific mode to a substantial extent.
This work utilizes data from HMI, courtesy of NASA/SDO and the HMI team. We Thank Charles Baldner for reading our manuscript and offering constructive suggestions, and an anonymous referee for useful comments.
Footnotes
- 3
Kosovichev, http://hmi.stanford.edu/hminuggets/?p=2010.