


Abstract
We present a study of signatures of energy dissipation at kinetic scales in plasma turbulence based on observations by the Magnetospheric Multiscale mission (MMS) in the Earth's magnetosheath. Using several intervals, and taking advantage of the high-resolution instrumentation on board MMS, we compute and discuss several statistical measures of coherent structures and heating associated with electrons, at previously unattainable scales in space and time. We use the multi-spacecraft Partial Variance of Increments (PVI) technique to study the intermittent structure of the magnetic field. Furthermore, we examine a measure of dissipation and its behavior with respect to the PVI as well as the current density. Additionally, we analyze the evolution of the anisotropic electron temperature and non-Maxwellian features of the particle distribution function. From these diagnostics emerges strong statistical evidence that electrons are preferentially heated in subproton-scale regions of strong electric current density, and this heating is preferentially in the parallel direction relative to the local magnetic field. Accordingly, the conversion of magnetic energy into electron kinetic energy occurs more strongly in regions of stronger current density, a finding consistent with several kinetic plasma simulation studies and hinted at by prior studies using lower resolution Cluster observations.
Export citation and abstract BibTeX RIS
1. Introduction
In recent years, there has been a great deal of interest in understanding how the multiscale cascade in plasma turbulence conducts energy from large to small scales where it is dissipated (Bowers & Li 2007; Howes et al. 2008; Parashar et al. 2009; Schekochihin et al. 2009; Karimabadi et al. 2013; Matthaeus et al. 2015). The kinetic processes involved are usually approximated as collisionless and therefore presumably differ from the more familiar gas dynamic collisional viscous-resistive processes. Understanding how dissipation occurs in low collisonality space plasmas is of interest as fundamental physics (Yang et al. 2017). It is also of practical importance, since it terminates the cascade process that very likely powers the heating in the solar corona that is needed to accelerate the solar wind (Cranmer et al. 2007; Verdini et al. 2010). In addition, dissipation and heating are important in numerous related astrophysical problems. Only relatively recently have we been able to perform kinetic simulations of sufficient size to adequately study these phenomena (Bowers & Li 2007; Daughton et al. 2011; Karimabadi et al. 2013) and the energy conversion between particles and waves (Ruan et al. 2016; Klein 2017). Recent observations also point to the importance of wave-particle interactions at ion scales (He et al. 2015a, 2015b). However, observational studies have remained limited in scope due to the challenges posed by the small scales involved and the lack of sufficiently high-resolution plasma measurements.
Here we employ data from the Magnetospheric Multiscale Mission (MMS; Burch et al. 2016) to compute statistical indicators related to small-scale dissipation at kinetic scales in the terrestrial magnetosheath. In particular, we will analyze (i) the Partial Variance of Increments (PVI), which measures the roughness of the magnetic field and detects discontinuities (Greco et al. 2009); (ii) the averages of the conditionally sampled local surrogate dissipation measure, sorted by increasing PVI index and increasing measured current density (Wan et al. 2015, 2016); (iii) the measured increases of anisotropic electron temperature, both parallel and perpendicular to the mean magnetic field, for increasing PVI index (Greco et al. 2012; Servidio et al. 2014); and (iv) the occurrence of non-Maxwellian properties of the particle distribution functions.
2. MMS Observations in the Magnetosheath
MMS data provides the dual advantages of high time cadence and simultaneous multi-spacecraft measurements at very small inter-spacecraft separations. This combination enables the study of the nature of intermittency and coherent structures at kinetic plasma scales with an unprecedented level of accuracy and resolution. The FGM magnetic field instruments and FPI ion and electron detectors (Burch et al. 2016; Pollock et al. 2016) provide the data required to probe the kinetic scales and characterize signatures of dissipation and heating. During the primary phase of the MMS mission, the prioritized data download strategy emphasized periods near magnetopause crossings, identifying signatures of magnetic reconnection and encounters with electron diffusion regions. Nevertheless, the orbital parameters permitted reasonably frequent sampling of the highly turbulent magnetosheath. Numerous high-quality magnetosheath intervals were obtained during this phase, leading to a number of publications (see, e.g., the Geophysical Research Letters Special Issue, volume 43, 2016, doi: 10.1002/grl.53450. For the present study, we analyzed five intervals of magnetosheath turbulence, totaling ∼30 minutes of MMS burst-resolution data during the MMS primary mission. These intervals are shown in Table 1. The burst-resolution data provides us with electron distribution functions and moments with a time cadence of 30 ms, while the spacecraft separation for the intervals used in this study ranged from ∼5 to 40 km. These features, considering the values of the ion gyroradius (∼50–150 km) and the typical flow velocities (∼150–250 km s−1) in Earth's magnetosheath permit us to fully resolve kinetic scale structures characteristic of this turbulent environment. We computed the current density using the high-resolution electron and proton velocity data from FPI.
Table 1. Description and Plasma Parameters of the Selected Intervals of MMS Burst-resolution Observations
| Date | Time |

|

|
sdp | de | βp | Va |
|---|---|---|---|---|---|---|---|
| (nT) | (cm−3) | (km) | (km) | (km s−1) | |||
| 2016 Jan 11 | 00:57:04–01:00:33 | 28.0 | 57.7 | 30.6 | 0.7 | 7.0 | 80.3 |
| 2016 Jan 24 | 23:36:14–23:47:33 | 19.4 | 34.7 | 38.5 | 0.9 | 12.0 | 71.9 |
| 2016 Oct 25 | 09:45:54–09:54:33 | 44.0 | 187.5 | 16.6 | 0.4 | 11.3 | 70.0 |
| 2017 Jan 18 | 00:45:53–00:49:42 | 26.2 | 165.5 | 16.1 | 0.4 | 13.1 | 44.5 |
| 2017 Jan 27 | 08:02:03–08:08:02 | 21.1 | 14.7 | 56.4 | 1.4 | 9.3 | 120.4 |
Download table as: ASCIITypeset image
For context, Figure 1 provides, for the case of one of the chosen intervals, an overview of the magnetic field and the plasma moments as well as some of the diagnostics used in this study. Figure 2 shows an example of a turbulent structure taken from a small subregion of the same interval (highlighted in Figure 1). We note that the subinterval shown in Figure 2 contains a magnetic field reversal, coinciding with enhanced density and a large increase of parallel electron temperature. This current sheet also exhibits a strong PVI signature, large values of  , and enhanced non-Maxwellianity. All of these indicate energy exchanges and enhanced dissipation. They are consistent with the possibility of local reconnection. However, we note the absence of a clear exhaust jet in the velocity data, which would make such an identification more conclusive.

Figure 1. Overview of one burst-resolution interval of magnetosheath turbulence from 2017 January 27. Panel A shows the magnetic field in GSE coordinates. Panel B shows the electron density. Panel C shows the electron temperature, along with the components parallel and perpendicular to the local magnetic field. Panel D shows the electron velocity in GSE coordinates. Panel E shows the magnitude of the current density computed from the FPI particle moments. Panel F shows the multi-spacecraft PVI Index. Panel G shows the product  , where
  is the electric field in the electron reference frame and
  is the current. Panel H shows e2, the non-Maxwellianity measure of the electron distribution functions. The highlighted structure is shown in detail in Figure 2.
Download figure:
Standard image High-resolution image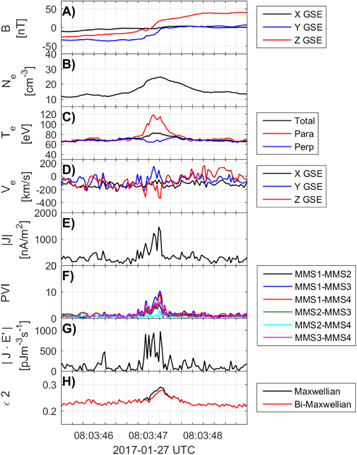
Figure 2. Example of a turbulent structure highlighted in Figure 1. The magnetic field structure and the associated electric current are accompanied by electron heating parallel to the magnetic field as well as a high PVI index,  and the non-Maxwellianity of the electron distribution e2.
Download figure:
Standard image High-resolution image3. Partial Variance of Increments and Detection of Intermittent Structures
The PVI provides a simple method to detect coherent structures (or sharp gradients) within a data sample (Greco et al. 2009). By comparing the magnitude of an increment with the regional root-mean-square value of that increment, one may ascertain with some confidence that this value of increment was likely to have been selected at random from a Gaussian distribution. If the magnitude of the increment from the local sample exceeds regional expectations by more than a few standard deviations, then it is very unlikely to be an extreme value selected from a Gaussian distribution. Under such circumstances, the observed structure is probably the result of a process characterized by a non-Gaussian probability distribution. The PVI approach is an efficient way to identify sharp coherent structures, but it does not separate different types, e.g., tangential and rotational discontinuities. Nor does PVI provide any detailed physical insight into the origin of the identified structures, although it does have a very basic relationship to higher order statistics that relate to intermittency (Greco et al. 2008). In that sense, the PVI can be used essentially as a surrogate of current density, to show that dissipation signatures may be almost equally related to either of these quantities. This is relevant for some single spacecraft measurements that do not provide accurate current density data.
The magnitude of the magnetic vector increment that we use for the PVI calculation is expressed as

where t is the time and the pair i, j = 1, 2, 3, 4 labels two of the four distinct MMS spaceraft. From that, we calculate the two-spacecraft version (Chasapis et al. 2015) of the partial variance of increments index (PVI index) as

where  denotes the time average over an appropriate span of the time series. In the case of this study, the average was calculated over the duration of each burst data interval.
The net value of PVI assigned to the time t, designated as PVI(t), will be defined as the mean of PVIij over the six distinct pairs of spacecraft at the time t. The time series of PVI(t) for one of the selected MMS intervals is shown as panel F of Figure 1. The PVI time series is, as expected, bursty, and the comparison with the other illustrated time series, shows that bursts of PVI tend to occur near complex patterns of edges or enhancements of other quantities. We will not, however, in this paper examine individual PVI "events" and their associations. Instead, we will focus only on statistical relationships.
It should be noted that using a two-point method to estimate the PVI allows us to focus on structures of size comparable to the scale of the spacecraft separation without use of the Taylor hypothesis. Given that in the case of the intervals examined here this corresponds to scales at or below the ion inertial scale, this allows us to examine the properties of intermittent dissipation at kinetic scales in the turbulence of Earth's magnetosheath.
Figure 3 shows the probability density function of values of PVI. It is evident that the decrease with increasing PVI value is roughly exponential with a slope of approximately −2, consistent with related studies based on simulations and observations (Greco et al. 2016). We note that Pollock et al. (2018) find the the distribution of PVI to be similar to a so-called kappa distribution. Like the exponential distribution, the kappa distribution exhibits distinctive "tails" corresponding to an enhanced probability of extreme values.

Figure 3. Probability density function of the PVI index of the multi-spacecraft magnetic vector increments for the selected MMS burst mode data sets in the magnetosheath.
Download figure:
Standard image High-resolution image4. Measurement of Dissipation at Kinetic Scales
Studies of collisionless plasma turbulence have not yet identified a dissipation function that accurately quantifies the irreversible degeneration of fluid and electromagnetic fluctuation energy into heat.10
This stands in contrast to the strongly collisional case, e.g., non-ideal MHD turbulence, for which a viscous or viscous-like closure is available. Therefore, to examine the association of coherent structures with dissipation, we need to adopt a parameter to be used as a signature, or surrogate, for dissipation.
We adopt what is essentially the Zenitani et al. (2011) measure, originally conceived as a method to identify reconnection activity. This has been adopted in several studies as a dissipation measure or surrogate (Wan et al. 2012, 2015, 2016) in kinetic turbulence. Here  is defined as the work done on particles by the electromagnetic field,

computed in the electron fluid frame, so that the electric field is

We should note that this is similar to the measure De defined in Zenitani et al. (2011), with the exception of the charge density term. This term, which typically has a rather small contribution, and which has relatively large errors associated with it, is not included in  in the present study.
Figure 4 shows that there is a clear and essentially monotonic relationship between  and the local value of PVI. This strongly suggests that dissipation is localized at small-scale intermittent structures.

Figure 4. Average dissipation measure conditioned on the binned PVI index,  .
.  is normalized to the average of its absolute value for each burst interval. For PVI values greater than about 3, the events selected are increasingly inconsistent with a process having a Gaussian distribution (Greco et al. 2009). Here, we observe that such high PVI events are associated on average with higher values of dissipation.
Download figure:
Standard image High-resolution image5. Further Analysis: Conditional Statistics
The behavior of the dissipation measure according to the local magnetic field "roughness" as measured by PVI, is strongly suggestive that dissipation and heating occur preferentially in coherent magnetic structures. We also know that there is a statistical association between PVI and current density (Greco et al. 2016; Chasapis et al. 2017), so it is natural to inquire as to whether values of  are correlated with local intensities of electric current density. It is straightforward to confirm that this is indeed the case, by computing the conditional average
  as the magnitude of current density J varies, for the selected interval of MMS data. The conditional average
  is defined as the average of
  in the regions where the magnitude of the current density has values between J − δJ and J + δJ. For this case, we chose
  .
.
This relationship is illustrated in Figure 5. At this point it is important to emphasize that a similar result for the conditional average  has also been obtained in several types of kinetic plasma simulations of turbulence (Wan et al. 2012, 2015, 2016). Here we revisit that simulation result in Figure 5 to facilitate the comparison with the results obtained using MMS data in the magnetosheath. Even though the plasma conditions are quite different in the simulation, the similarity in the
  relationship is evident.
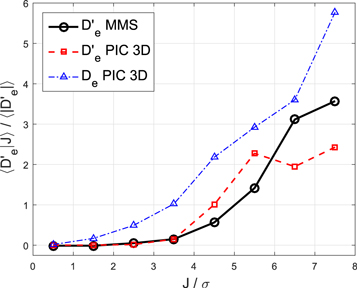
Figure 5. Average dissipation measure  conditioned on local values of the magnitude of the current density,
  . The current density is normalized to its variance over each interval.
  and De are normalized to the average of its absolute value for each burst interval. Results from the MMS observations of
  shown in black, while results from simulations (Wan et al. 2016) shown in red (
 ) and blue (De) for comparison. We observe that regions with higher values of magnitude current density also have higher average dissipation measure
  .
.
Download figure:
Standard image High-resolution imageExtending the inquiry further, given the statistical associations of the dissipation surrogate measure with coherent structures, one might also investigate whether the temperatures themselves are elevated in the same regions. Here we investigate this question using the MMS electron temperature data measured by the FPI instrument for the same selected data interval.
To proceed, we compute the local enhancement of electron temperature with respect to its regional average. We define as the regional average the average within a rolling time window of a size equivalent to a few di, for the typical flow velocity. Consequently, the ratio of the local temperature with respect to its regional average yields an estimate of the electron local heating. We do this for total electron temperature, and also separately for the electron temperature parallel and perpendicular to the local magnetic field direction, which permits somewhat richer conclusions to be drawn. These temperature change data are separately averaged, conditioned on the magnitude of current density. The results are shown in Figure 6.

Figure 6. Electron temperature as measured by MMS divided by the regional average, accumulated conditionally as a function of local magnitude current density J. The current density is normalized to its variance over each interval. We observe that the electron temperature is larger at stronger currents, the effect being greater for parallel temperatures.
Download figure:
Standard image High-resolution imageIt is evident that an enhancement of the electron temperature is seen in regions of higher current intensity, which points to electron heating localized within those regions. However, the effect is substantially enhanced in the direction parallel to the magnetic field.
Finally, we estimate the non-Maxwellian properties of the measured distribution functions. To that end, we define a non-Maxwellianity parameter  2 as
2 as

where  is the measured electron distribution function at each instant of time and
  is the equivalent Maxwellian or bi-Maxwellian distribution with the same density, temperature, and velocity as f . C is a normalization parameter defined as
  .
.
The reference Maxwellian is computed using the MMS FPI density, velocity, and temperature. Similarly, the reference bi-Maxwellian is based on the FPI density, velocity, and parallel and perpendicular temperatures, so that we determine analytically,  , with fluid velocity
  , temperatures parallel T∥ and perpendicular T⊥ to the measured local magnetic field.
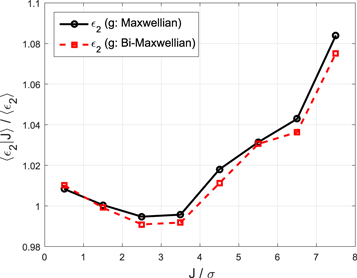
As we can see in Figure 7, the conditional distribution of  shows a rising trend for higher values of the current density. This points to nonthermal particle energization occurring at small-scale current structures.
Figure 7. Average of the non-Maxwellianity parameter 2 conditioned on local values of the magnitude of the current density,  . The current density is normalized to its variance over each interval. 2 is normalized to its average value for each burst interval. Results are shown both for an equivalent Maxwellian and for an equivalent bi-Maxwellian.
Download figure:
Standard image High-resolution image
6. Discussion
In the present analysis of magnetosheath data using MMS burst data, the detected intermittent structures had on average a positive dissipation measure  , a quantity indicating conversion of magnetic field energy into microscopic flows (Yang et al. 2017), a step widely considered to represent a pathway to particle heating and energization. The dissipation measure was found to be systematically greater for structures with higher current and PVI index. This is evidence that structures such as thin current sheets are sites of major dissipation. We note that these associations of dissipation measure are consistent with the magnetosheath analysis of Retinò et al. (2007) except carried out here with high-resolution MMS data.
We also note that these features of the dissipation measure, and in particular its variation (on average) with the magnitude of current density, are consistent with findings in both 2.5 and three-dimensional kinetic plasma simulation studies (Wan et al. 2015, 2016). This finding is of considerable potential importance since the cited numerical studies also reported that the variation of average  with local current density is strikingly similar to the variation that would be expected for a collisional resistive Ohms law. However, the kinetic plasma simulations as well as the magnetosheath plasma are nearly collisionless. This correspondence remains unexplained at a theoretical level.
The suggestion that dissipative mechanisms are active near coherent structures in the magnetosheath (Retinò et al. 2007; Sundkvist et al. 2007; Chasapis et al. 2015, 2017) is well supported in the present study. We also observe that there is a strong statistical association of anisotropic electron heating with current density, a result that is again consistent with simulation studies that find a statistical connection between electron temperature anisotropies and coherent structures (Greco et al. 2012; Karimabadi et al. 2013; Servidio et al. 2016). The finding of enhanced electron parallel temperature at current enhancements is also consistent with numerous other reports of preferential parallel electron energization. For example, Dmitruk et al. (2004) studied energization at early times in test particle simulations based on MHD turbulence data. That study found that small gyroradius particles (electrons) are subject to parallel energization in current sheets and similar structures. Additionally, the observed predominance of non-Maxwellian features of the electron distribution functions in those cases suggest that there may be mechanisms of nonthermal particle energization in effect.
The results presented here add to a growing body of evidence that turbulent dissipation, electron heating, and energization are greatly enhanced at coherent structures such as current sheets. One may wonder if magnetic reconnection and associated plasma jets are significant contributors to activity observed near electric current structures in turbulent plasmas (Sundkvist et al. 2007; Greco et al. 2016; Yordanova et al. 2016). Reconnection geometries can be difficult to identify when turbulence produces highly distorted structures, as is expected to frequently be the case in three-dimensional dynamics (see, e.g., Dmitruk & Matthaeus 2006). The observations presented here suggest that localized mechanisms, including possible reconnection-like activity, result in significant dissipation of turbulent electromagnetic field energy. This is observed in the magnetosheath to be channeled into electron heating that is predominantly parallel to the local magnetic field. At least some of this internal energy appears as non-Maxwellian features, presumably beams or more complex structures in velocity space (Servidio et al. 2012, 2017). Higher resolution numerical studies, and future observations by MMS and other heliospheric missions will help determine the underlying mechanisms of turbulent kinetic dissipation.
This research partially supported by the MMS mission through NASA grant NNX14AC39G at the University of Delaware, by NASA LWS grant NNX17AB79G, and in part by NSF-SHINE AGS-1460130. A.C. is supported by the NASA grants. W.H.M. is a member of the MMS Theory and Modeling team. M.W. acknowledges the support from the National Natural Science Foundation of China (NSFC grant Nos. 11672123 and 91752201). We are grateful to the MMS instrument teams, especially SDC, FPI, and FIELDS, for cooperation and collaboration in preparing the data. The data used in this analysis are Level 2 FIELDS and FPI data products, in cooperation with the instrument teams and in accordance their guidelines. All MMS data are available at https://lasp.colorado.edu/mms/sdc/.
Footnotes
- 10
An alternative characterization is the production of entropy, but we do not attempt to develop a formal definition here.