


Abstract
By clearing neutral gas away from a young starburst, superwinds may regulate the escape of Lyman continuum (LyC) photons from star-forming galaxies. However, models predict that superwinds may not launch in the most extreme, compact starbursts. We explore the role of outflows in generating low optical depths in the Green Peas (GPs), the only known star-forming population with several confirmed and candidate LyC-leaking galaxies. With Hubble Space Telescope UV spectra of 25 low-redshift GPs, including new observations of 13 of the most highly ionized GPs, we compare the kinematics of UV absorption lines with indirect H i optical depth diagnostics: Lyα escape fraction, Lyα peak separation, or low-ionization absorption line equivalent width. The data suggest that high-ionization kinematics tracing superwind activity may correlate with low optical depth in some objects. However, the most extreme GPs, including many of the best candidate LyC emitters with weak low-ionization absorption and strong, narrow Lyα profiles, show the lowest velocities. These results are consistent with models for suppressed superwinds, which suggests that outflows may not be the only cause of LyC escape from galaxies.
Export citation and abstract BibTeX RIS
1. Introduction
Star-forming galaxies are likely the dominant source of the Lyman continuum (LyC) photons that reionized the universe at  (e.g., Robertson et al. 2015). However, because of the high H i column densities near young star-forming regions, LyC photons do not easily escape their host galaxy. To overcome this challenge, a variety of theoretical and observational studies invoke mechanical feedback, particularly by supernovae (SNe), as a means of clearing out H i gas and enabling LyC escape. Clarke & Oey (2002) show that above a critical star formation rate (SFR), overlapping SN-driven bubbles create a porous interstellar medium through which LyC photons can travel. Similarly, radiation hydrodynamic simulations find that SN-driven outflows in low-mass galaxies boost their LyC escape fractions (e.g., Wise & Cen 2009; Trebitsch et al. 2017), with LyC emission peaking in a star-forming region after SNe expel surrounding gas (Ma et al. 2015). Observations suggest that high SFR surface densities (
 ) and high gas velocities may correlate with low optical depths (Alexandroff et al. 2015).
However, theoretical predictions are converging on a different behavior in the regime of extreme feedback. For the most massive, compact, super star clusters (SSCs), superwinds should be inhibited by strong radiative cooling (Silich et al. 2007; Krause & Diehl 2014; Yadav et al. 2017) due to high gas densities. The high ambient density and pressure can also suppress the growth of individual stellar wind bubbles, thereby preventing them from merging into a superwind (Silich & Tenorio-Tagle 2017). These models contrast strongly with the standard paradigm for mechanical feedback driven by energy-conserving superwinds. Also, since any mechanical feedback takes time to mature, radiative feedback is expected to dominate at the youngest SSC ages (e.g., Freyer et al. 2003; Krumholz & Matzner 2009). Superwind suppression has been reported in SSCs in M82 (Smith et al. 2006; Westmoquette et al. 2014) and NGC 2366 (Oey et al. 2017).
With the recent confirmation of high LyC escape fractions ( = 6%–13%) from five out of five targeted "Green Pea" (GP) galaxies (Izotov et al. 2016a, 2016b), we can now investigate these feedback models in the context of strong LyC emitters. As a population, the GPs show elevated [O iii] λ5007/[O ii] λ3727 ratios, as expected for density-bounded nebulae (e.g., Jaskot & Oey 2013). In addition to the confirmed leakers, several other GPs show indirect evidence of LyC escape, such as weak low-ionization absorption lines and narrow double-peaked Lyα profiles (Jaskot & Oey 2014; Henry et al. 2015; Verhamme et al. 2015). Observations of the five confirmed leakers show that
  may correlate with [O iii]/[O ii],
  , and Lyα properties such as escape fraction (
 ), Lyα equivalent width (EW), and separation of the Lyα peaks (
 ; Izotov et al. 2016b; Verhamme et al. 2017).
The role of mechanical feedback in enabling LyC escape from the GPs is not yet clear. Some GPs show broad emission line wings (e.g., Amorín et al. 2012), which may suggest that concentrated SN feedback is driving outflows. On the other hand, such broad wings are not obviously due to expanding shells or winds and are difficult to interpret (Binette et al. 2009). Furthermore, Henry et al. (2015) find no correlation between low-ionization gas outflow velocities and  , and Chisholm et al. (2017) show that LyC-leaker outflow velocities are no more extreme than a control sample.
Here, we present new, high-S/N Hubble Space Telescope (HST) Cosmic Origins Spectrograph (COS) observations of 13 extreme GPs, with [O iii]/[O ii] ∼ 7–34. Combined with previous GP samples (Jaskot & Oey 2014; Henry et al. 2015; Chisholm et al. 2017), we assess whether gas velocities correlate with indirect diagnostics of LyC escape and examine evidence for suppressed superwinds. In contrast to the prevailing picture of mechanical feedback, we show that the best LyC emitter candidates have nearly static gas velocities.
2. Sample and Measurements
We selected a sample of 13 star-forming GPs at  based on high [O iii]/[O ii] and high S/N from the Sloan Digital Sky Survey (SDSS) Data Release 10 (DR10; Ahn et al. 2014). We correct all optical nebular lines for Milky Way extinction using the Schlafly & Finkbeiner (2011) maps and Fitzpatrick (1999) attenuation law. Following Izotov et al. (2017a), we correct for internal dust extinction using the Cardelli et al. (1989) law. We obtain COS spectra with the G130M grating; we will describe these observations in a forthcoming work (A. E. Jaskot et al. 2017, in preparation), but we summarize the main points below. We bin the spectra to 12–34 km s−1 resolutions as estimated from the FWHM of the cross-dispersion profiles. The spatial profiles are compact; we estimate that deviations from a point-source profile will cause at most a 6% flux uncertainty per pixel in the final spectrum, and we incorporate this uncertainty accordingly. The Lyα spatial profiles are typically only a few pixels more extended than the continuum emission. However, because of our sources' low redshifts (
 ), some Lyα emission may be scattered outside the COS aperture and missed entirely.
To measure gas velocities, we first linearly fit the continuum region near each spectral line and normalize the spectrum. Following Henry et al. (2015), we measure a characteristic velocity ( ), the velocity weighted by absorption depth, and a maximum velocity (
 ), the velocity where the absorption meets the continuum. For GPs from Jaskot & Oey (2014) and the new sample, we measure velocities for the low-ionization lines O i λ1302, Si iiλλ1190, 1193, 1260, 1304, and C ii λ1334 and the high-ionization lines Si iii λ1206 and Si ivλλ1394, 1403. Not all lines are covered or detected in each object; some spectra only cover the low-ionization lines. The highest [O iii]/[O ii] GP in our sample, J160810+352809 (J1608), shows the high-ionization lines in emission with superimposed absorption forming double-peaked line profiles. For this object, we set
  to the velocity of the deepest absorption and
  equal to the velocity of the blue emission peak. For the LyC-emitting GPs, we adopt the
  measurements from Chisholm et al. (2017), which are comparable to
  .
.
Each velocity measurement is subject to different systematic effects. Low spectral resolution or infilling by scattered emission may shift  to more negative velocities, while low S/N or low EW absorption may lead to underestimates of
  . The Si iv
  doublet could also contain significant stellar absorption. However, the measured Si iv velocities do not differ systematically from the velocities of the interstellar Si iii absorption, with median differences of only 30 km s−1 in
  and 110 km s−1 in
  .
.
We compare the observed velocities with three indirect measures of H i optical depth:  , the median EW of the low-ionization absorption lines listed above, and
  (Table 1). The velocity separation of the red and blue peaks of a double-peaked Lyα spectral profile should correlate with optical depth, as reduced Lyα scattering at low
  produces a narrower spectral profile (Verhamme et al. 2015; Dijkstra et al. 2016). For the galaxy J080841+172856 (J0808), which has a triple-peaked profile, we calculate
  twice, once for each blue peak. We also calculate the EW of low-ionization absorption lines, which should be weaker in LyC emitters (e.g., Heckman et al. 2001), although gas metallicity and emission scattered into the line of sight will also affect the observed EW.
Table 1. GP Sample Properties
| Low-ionizationa | High-ionizationa | ||||||||
|---|---|---|---|---|---|---|---|---|---|
| Galaxy | z |
![$\tfrac{[{\rm{O}}\,{\rm{III}}]}{[{\rm{O}}\,{\rm{II}}]}$](https://content.cld.iop.org/journals/2041-8205/851/1/L9/revision1/apjlaa9d83ieqn26.gif)
|

|

|
EWb |

|

|

|

|
| (km s−1) | (Å) | (km s−1) | (km s−1) | (km s−1) | (km s−1) | ||||
| J144805-011058 | 0.0274 | 7.4 | 0.00 | ⋯ | −1.04 (6) | −5 (6) | −281 (5) | −136 (3) | −435 (3) |
| J150934+373146 | 0.0326 | 14.3 | 0.04 ± 0.02 | 400 ± 27 | −0.35 (5) | −4 (5) | −118 (5) | −67 (3) | −198 (3) |
| J160810+352809 | 0.0327 | 34.2 | 0.16 ± 0.04 | 214 ± 30 | −0.17 (3) | 19 (3) | −95 (3) | 2 (3) | −46 (3) |
| J230210+004939 | 0.0331 | 8.4 | 0.26 ± 0.05 | 279 ± 48 | −0.15 (3) | −28 (3) | −116 (3) | −50 (3) | −230 (3) |
| J021307+005612 | 0.0399 | 7.0 | 0.11 ± 0.02 | 397 ± 47 | −0.48 (6) | −29 (6) | −203 (6) | −82 (1) | −315 (1) |
| J080841+172856 | 0.0442 | 10.1 | 0.31 ± 0.07 | 156 ± 37; 441 ± 58 | ⋯ | ⋯ | ⋯ | −236 (1) | −324 (1) |
| J173501+570309 | 0.0472 | 6.9 | 0.09 ± 0.02 | 460 ± 47 | −0.53 (6) | −85 (6) | −401 (5) | −156 (1) | ⋯ |
| J131131-003844 | 0.0811 | 6.7 | 0.24 ± 0.05 | 273 ± 26 | −0.32 (6) | −83 (6) | −233 (5) | ⋯ | ⋯ |
| J120016+271959 | 0.0819 | 9.0 | 0.40 ± 0.08 | 327 ± 65 | −0.17 (3) | −89 (3) | −214 (3) | ⋯ | ⋯ |
| J024052-082827 | 0.0822 | 13.9 | 0.20 ± 0.04 | 266 ± 29 | −0.58 (6) | −149 (6) | −412 (5) | ⋯ | ⋯ |
| J085116+584055 | 0.0919 | 9.2 | 0.04 ± 0.01 | 361 ± 25 | −0.64 (5) | −44 (5) | −186 (5) | ⋯ | ⋯ |
| J122612+041536 | 0.0942 | 8.0 | 0.11 ± 0.02 | 360 ± 40 | −0.41 (4) | −25 (4) | −137 (3) | ⋯ | ⋯ |
| J133538+080149 | 0.1235 | 7.1 | 0.00 | ⋯ | −1.04 (5) | 3 (5) | −170 (5) | ⋯ | ⋯ |
| J081552+215624 | 0.1410 | 10.1 | 0.26 ± 0.05 | 296 ± 52 | ⋯ | ⋯ | ⋯ | −318 (1) | ⋯ |
| J145735+223202 | 0.1487 | 7.3 | 0.01 ± 0.01 | 749 ± 56 | −0.79 (4) | −39 (4) | −299 (3) | −155 (3) | −189 (1) |
| J030321-075923 | 0.1649 | 7.1 | 0.05 ± 0.01 | 443 ± 156 | −0.50c (4) | −200c (2) | −560c (1) | −240c (3) | −580c (3) |
| J092600+442737 | 0.1807 | 3.2 | 0.20 ± 0.03 | 409 ± 71c | −0.45c (4) | −280c (2) | −580c (2) | −320c (3) | −880c (3) |
| J142406+421646 | 0.1848 | 5.7 | 0.24 ± 0.04 | 374 ± 71c | −0.50c (2) | −235c (2) | −480c (2) | −280c (1) | −560c (1) |
| J113722+352427 | 0.1944 | 2.8 | 0.11 ± 0.02 | 556 ± 71c | −1.15c (4) | −145c (4) | −445c (4) | −170c (3) | −510c (3) |
| J121904+152609 | 0.1956 | 10.4 | 0.55 ± 0.08 | 242 ± 43 | ⋯ | ⋯ | ⋯ | −395c (2) | −815c (2) |
| J124423+021540 | 0.2394 | 3.7 | 0.06 ± 0.01 | 487 ± 71c | −1.20c(4) | −90c (4) | −380c (4) | −100c (3) | −400c (3) |
| J113304+651341 | 0.2414 | 3.7 | 0.27 ± 0.05 | 340 ± 71c | ⋯ | ⋯ | ⋯ | −270c (1) | ⋯ |
| J105331+523753 | 0.2526 | 2.5 | 0.06 ± 0.01 | 506 ± 71c | −0.80c (3) | −140c (3) | −440c (3) | −180c (3) | −650c (3) |
| J091113+183108 | 0.2622 | 1.9 | 0.16 ± 0.03 | 359 ± 71c | −0.80c (4) | −250c (4) | −525c (4) | −290c (3) | −815c (2) |
| J124835+123403 | 0.2634 | 3.5 | 0.42 ± 0.06 | ⋯ | −0.85c (2) | −180c (2) | −420c (3) | −250c(3) | −470c (3) |
| J144231-020952 | 0.2937 | 6.7 | 0.51 ± 0.03 | 310 ± 14d | −0.65e (1) | −473e (1) | ⋯ | −250e (1) | ⋯ |
| J092532+140313 | 0.3013 | 4.8 | 0.30 ± 0.01 | 310 ± 14d | −0.75e (1) | −64e (1) | ⋯ | −135e (1) | ⋯ |
| J133304+624604 | 0.3181 | 4.8 | 0.54 ± 0.04 | 390 ± 14d | −0.75e (1) | −237e (1) | ⋯ | −311e (1) | ⋯ |
| J115205+340050 | 0.3419 | 5.4 | 0.34 ± 0.02 | 270 ± 14d | −0.49e (1) | −336e (1) | ⋯ | −193e (1) | ⋯ |
| J150343+364451 | 0.3557 | 4.9 | 0.29 ± 0.02 | 430 ± 14d | −0.56e (1) | −187e(1) | ⋯ | −128e (1) | ⋯ |
Notes.
aMedian values with the number of observed lines in parentheses. Typical uncertainties on individual measurements are 0.19 Å, 41 km s−1 , and 32 km s−1 for low-ionization EW, , and
, and  and 54 km s−1 and 51 km s−1 for high-ionization
  and
and  .
bNegative EWs indicate absorption.
cFrom Henry et al. (2015).
dFrom Verhamme et al. (2017).
eFrom Chisholm et al. (2017).
.
bNegative EWs indicate absorption.
cFrom Henry et al. (2015).
dFrom Verhamme et al. (2017).
eFrom Chisholm et al. (2017).
Download table as: ASCIITypeset image
Galaxies with low  should also have high
  (e.g., Yajima et al. 2014; Dijkstra et al. 2016; Verhamme et al. 2017). However, aperture effects may lower
  in the new
  GPs compared to other GP samples (Jaskot & Oey 2014; Henry et al. 2015; Izotov et al. 2016b). To obtain
  , we measure the Lyα emission within any associated Lyα absorption trough; the uncertainties account for the difference between including and excluding absorption. After correcting the flux for Milky Way extinction, we derive the intrinsic Lyα flux before scattering by scaling the extinction-corrected Hα flux by the Case B Lyα/Hα ratio (Dopita & Sutherland 2003) at the starburst's calculated electron temperature and density (Lyα/Hα = 8.24–8.96 for our sample). Deviations from Case B only become important at
  > 90% (Ferland 1999). For consistency, we recalculate
  for the Henry et al. (2015) and Izotov et al. (2016b) GPs in the same manner.
3. Results
3.1. Velocity and Optical Depth
In Figure 1, we show optical depth diagnostics as a function of the measured velocities of high-ionization gas, characteristic of a starburst's wind or wind interface regions. For clarity, we plot one data point for each GP, showing the median and range of the observed absorption lines. In Figure 1, most of the objects follow a correlation between blueshifted high-ionization gas velocity and diagnostics of lower LyC optical depth. However, the subset of objects with the lowest  appears to show the opposite trend: at lower optical depths, the gas velocities decrease.
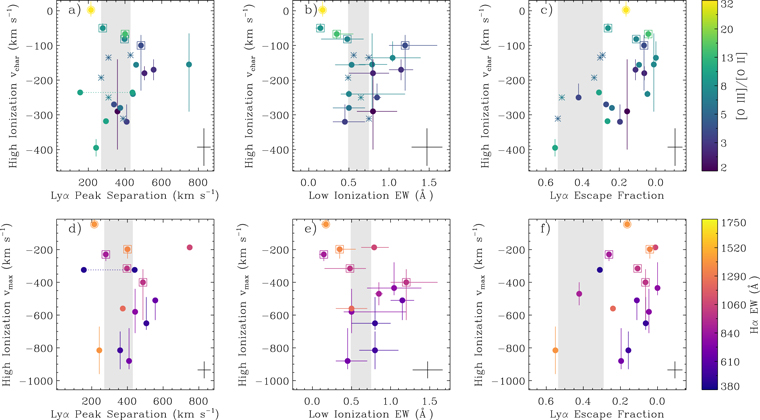
Figure 1. Top panels show the median  of high-ionization absorption lines (Si iii λ1206 and Si iv λλ1394,1403) as a function of indirect optical depth diagnostics ((a)
  , (b) median low-ionization EW, and (c)
  ). Color indicates [O iii]/[O ii]. Bottom panels show the median
  of the high-ionization lines as a function of the same diagnostics, with color indicating Hα EW. Optical depth increases to the right in all panels. Data points and error bars show the median and range, respectively, of the lines observed in a given GP. The objects with the five lowest
  values are surrounded by open symbols and suggest an inverse trend, with slower velocities at lower optical depths; the open circle indicates J1608. For J0808's triple-peaked Lyα profile, we show both values of
  connected with a dotted line. The black error bar in the corner indicates the typical errors on individual line measurements. Gray bands show the range of
  , Si ii λ1260 EWs, and
  observed in the confirmed LyC-emitting GPs (Chisholm et al. 2017; Verhamme et al. 2017), which are plotted with asterisks.
Download figure:
Standard image High-resolution imageThese objects include the highest excitation GPs. The best LyC-leaker candidates, with low  and weak low-ionization EWs, generally have high [O iii]/[O ii] ratios and high Hα EWs (see Izotov et al. 2016b). These same galaxies tend to have low outflow velocities. The GPs with outflow velocities
  km s−1 all have
 km s−1 , as narrow as known GP LyC emitters (Verhamme et al. 2017). With burst ages of only a few Myr (e.g., Jaskot & Oey 2013; Izotov et al. 2017b), some GPs may be too young for SN feedback, although stellar winds should still be present. These results support predictions that superwinds may be inhibited by catastrophic cooling and high pressure in extreme SSCs (e.g., Silich et al. 2007; Silich & Tenorio-Tagle 2017). These extreme SSCs may have conditions that promote LyC escape, such as high ionizing fluxes, combined with conditions detrimental to superwind formation. Radiative, not mechanical, feedback may dominate in young, compact starbursts like the GPs (e.g., Freyer et al. 2003; Krumholz & Matzner 2009). The remaining, typically lower excitation, objects do suggest a correlation between velocity and low line-of-sight optical depth. These starbursts may not have suppressed superwinds or may be dominated by SN activity.
The low-ionization gas, which tracks neutral gas kinematics, could originate near or far from the starburst and may not necessarily trace the starburst's wind. However, this gas will have the greatest effect on Lyα and LyC escape. Many objects again appear to show both low velocities and indirect indicators of low optical depth (Figure 2). As with the high-ionization gas, the GPs with narrow Lyα tend to have the slowest outflow velocities (Figures 2(a) and (d)), and most GPs with weak low-ionization absorption show low velocities in both  and
and  .
.
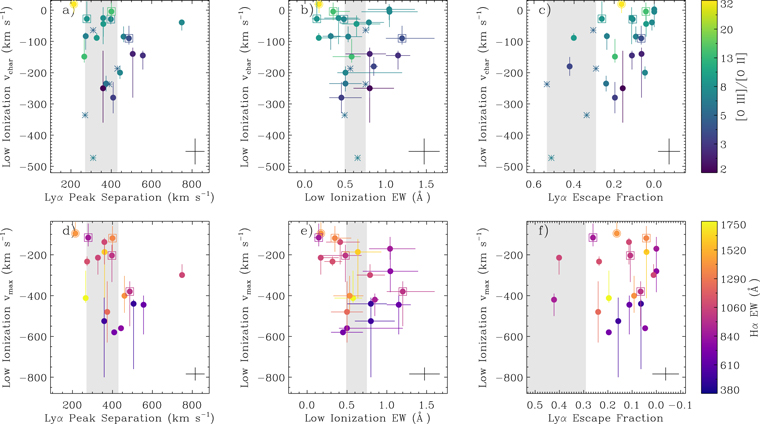
Figure 2. The panels and symbols are the same as Figure 1, but for the velocities of low-ionization absorption lines (O i λ1302, Si ii λλ1190, 1193, 1260, 1304, and C ii λ1334).
Download figure:
Standard image High-resolution imageSystematic effects are unlikely to alter these conclusions. Programs GO-12928 (Henry et al. 2015) and GO-13293 (Jaskot & Oey 2014) include GPs with a range of [O iii]/[O ii] ratios from the original  GP sample of Cardamone et al. (2009), while we selected our new sample (GO-14080) based on observability and high [O iii]/[O ii]. These new GPs have systematically higher [O iii]/[O ii] ratios and lower redshifts than the previous samples. Since the optical depth in Lyα is 104 times than that of LyC, Lyα will scatter even in LyC emitters. The COS aperture will capture less of this scattered Lyα halo in lower-redshift GPs. At z = 0.047, the median redshift of the new sample, the COS aperture subtends 2.3 kpc,
  the aperture size for the (Izotov et al. 2016b) LyC leakers, and at a given
  , GPs with
  show systematically lower
  . The
. The  values for these GPs are likely underestimated; higher
  values would only increase the number of GPs with low optical depth and low velocities in Figures 1(c), (f), 2(c), and (f).
For the higher-redshift GPs, metal line emission captured by the larger physical aperture could fill in absorption at the systemic velocity, thereby causing  to appear more blueshifted. However, we observe the same trends with
  , which should be less affected by scattered emission. Even if emission is biasing
  too high, this effect merely emphasizes that the GPs' velocities must truly be low. Lastly, we could underestimate
  due to low S/N. However, the high [O iii]/[O ii] GPs show the lowest
  values yet generally have higher S/N spectra. At low optical depths, weak low-ionization absorption could lead to underestimated
  values, but the low
  values appear in the stronger high-ionization absorption lines as well. We show a characteristic example of some of the weakest detected low-ionization absorption lines in Figure 3. Although the lines are weak, they are narrow and centered at systemic velocity; a significantly higher
  seems unlikely.
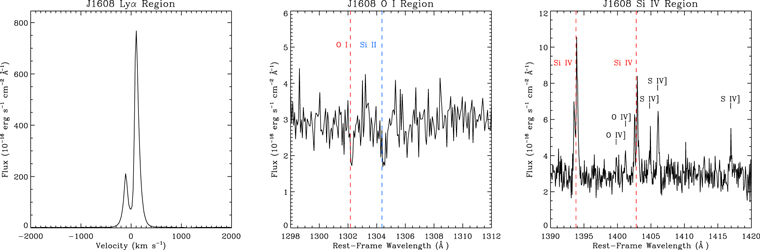
Figure 3. J1608's Lyα profile is strong and narrow with significant flux at the systemic velocity (left panel). Its low-ionization absorption lines (central panel) are weak, narrow, and barely offset from the expected transition wavelength (dashed lines). J1608 shows high-ionization lines such as Si iv (right panel) and Si iii in emission with absorption superimposed at the systemic velocity. Dashed red lines indicate the Si iv transition wavelengths; labels identify other lines from O iv] and S iv].
Download figure:
Standard image High-resolution imageAlthough outflows are not driving the GPs' low optical depths, they may have a slight effect on Lyα escape. In Figures 1(c), (f), 2(c), and (f), only  may show an overall trend with faster outflows. This tentative trend may arise because Lyα photons are out of resonance with the higher velocity gas and thereby escape more easily (Mas-Hesse et al. 2003). However, the correlation is most evident in the high-ionization gas velocities, not the low-ionization gas that should affect Lyα escape (see Henry et al. 2015). As discussed above, aperture effects may account for part of the observed
  trend by leading to systematic underestimates of
  for the highest [O iii]/[O ii] GPs. For low-redshift galaxies,
  may be an unreliable indicator of LyC escape.
3.2. J1608: Optical Depth at Extreme Ionization
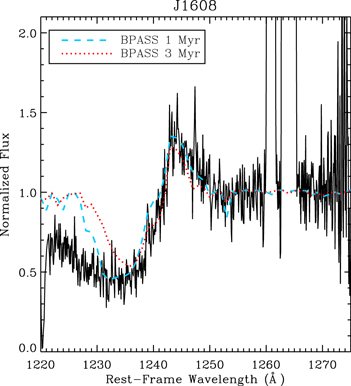
The most extreme galaxy in the sample, J1608, has the highest [O iii]/[O ii] ratio among SDSS DR10 star-forming galaxies and exemplifies the disconnect between gas velocity and  . With a dust-corrected [O iii]/[O ii] = 34, J1608's enormous ionization parameter may indicate a density-bounded nebula (e.g., Jaskot & Oey 2013), a conclusion supported by other spectral diagnostics (Izotov et al. 2017b). J1608 is likely extremely young; its rest-frame Hα EW is 1450 Å, and its strong N v 1240 Å stellar P-Cygni feature matches a ∼1 Myr stellar population (Figure 4) with Very Massive Stars (
 M☉). Furthermore, J1608 shows the unprecedented detection of Si iii
  and Si iv
  1394,1403 as double-peaked emission lines, along with fainter emission from semi-forbidden O iv] and S iv] (Figure 3). CLOUDY photoionization models (Ferland et al. 1998; Jaskot & Ravindranath 2016) predict strong nebular Si iv emission only for
  , while stellar Si iv absorption weakens with both age and metallicity (e.g., Stanway et al. 2016). The fact that Si iv emission dominates absorption suggests that J1608 must be young and highly ionized and is consistent with its low metallicity (
 Izotov et al. 2017b).
Figure 4. We compare the N v λ1240 line in J1608 with predictions from the BPASS models (Stanway et al. 2016) for a 1 Myr and 3 Myr instantaneous burst with a 150 M☉ upper mass limit. The height and depth of the N v line suggest an age close to 1 Myr. Lyα absorption affects the blue side of the observed N v profile.
Download figure:
Standard image High-resolution image
J1608 shows no evidence of SN-driven outflows, yet it is also the best LyC emitter candidate in our sample. Its absorption lines are nearly static, with  ranging from −17 to +27 km s−1 (Figure 3). Nevertheless, J1608 may have one of the lowest column densities for low-redshift starbursts. Its low-ionization absorption EWs are all
  Å, and its Lyα peaks are separated by 214 km s−1 (Figure 3), lower than any other double-peaked Lyα profile yet reported. J1608's Lyα EW (∼163 Å) is among the strongest of the GPs, and J1608 has more Lyα flux at the systemic velocity, where Lyα optical depth should be highest. Although J1608's
  of 0.16 is intermediate for the sample, the observations may experience more aperture losses given J1608's low redshift (
 ). Dust may also suppress scattered Lyα photons, as J1608's
  is above the sample average. The evidence from both the Lyα profile and the low-ionization lines strongly suggests low
  along the line of sight. J1608 offers a clear template of the extreme GP properties linked to LyC emission.
4. Discussion
Our results support predictions for an extreme feedback regime characterized by suppressed superwinds. In extreme, young starbursts like the GPs, catastrophic cooling and high pressure may prevent stellar winds and supernovae from forming a superwind (e.g., Silich et al. 2007; Silich & Tenorio-Tagle 2017). In addition, we may be catching these starbursts at particularly young ages,  , before the death of the most massive stars as SNe. The GPs' optical spectra show enormous Balmer line EWs (Jaskot & Oey 2013), unusually strong nebular continua (Izotov et al. 2011), and nebular emission from the weak, age-sensitive He i λ3819 and higher-order Balmer series lines (Jaskot & Oey 2013). The strong stellar N v λ1240 P-Cygni profile observed in the extreme GP J1608 further indicates an age
  Myr (Section 3.2). With young ages, the GPs may be at their peak LyC production (see Schaerer et al. 2016; Izotov et al. 2017a). By ionizing the surrounding nebular gas, this intense radiation may ensure its own escape.
The recently identified, local GP analog Mrk 71-A (Micheva et al. 2017) appears to be a similarly young starburst without evident mechanical feedback. Mrk 71-A may be only ∼1 Myr-old, and CO kinematics demonstrate the absence of an energy-driven superwind from the 105 M☉ SSC (Oey et al. 2017). Radiation may dominate Mrk 71-A's feedback, and a high star formation efficiency may also contribute to the removal of neutral gas (Oey et al. 2017). Like the GPs, Mrk 71-A's optical emission lines show mysterious broad wings, but SN activity may not generate this feature (e.g., Roy et al. 1992; Binette et al. 2009). Instead, these wings could be associated with the catastrophic cooling of the mechanical feedback (e.g., Tenorio-Tagle et al. 2010).
Our results suggest that LyC emitters may come in different types, with suppressed superwinds in the most extreme GP systems, and conventional wind and SN feedback clearing out neutral gas in other systems. One known high-redshift LyC emitter is GP-like (Vanzella et al. 2016), while at least one other is not (Shapley et al. 2016). Ultimately, the reionization of the universe may require the contribution of different types of galaxies (e.g., Fontanot et al. 2012). Extremely young starbursts, like the GPs, may contribute thanks to prolific LyC production combined with strong radiative feedback. As these starbursts age, SN feedback may provide a new means of LyC escape, while older sources, such as evolved binary systems, contribute the LyC photons (e.g., Ma et al. 2016; Stanway et al. 2016). The existence of multiple mechanisms for LyC escape may help explain how galaxies were able to reionize the universe.
We thank the referee for a helpful response and thank Crystal Martin for useful discussions. A.E.J. acknowledges support by NASA through Hubble Fellowship grant HST-HF2-51392 and STScI grant HST-GO-14080. M.S.O. acknowledges support from NASA through grant HST-GO-14080 from STScI. STScI is operated by AURA under NASA contract NAS-5-26555. T.D. acknowledges support from the Massachusetts Space Grant Consortium. Funding for SDSS-III has been provided by the Alfred P. Sloan Foundation, the Participating Institutions, the National Science Foundation, and the U.S. Department of Energy Office of Science. SDSS-III is managed by the Astrophysical Research Consortium for the Participating Institutions of the SDSS-III Collaboration.
Footnotes
- ∗
Based on observations made with the NASA/ESA Hubble Space Telescope, obtained at the Space Telescope Science Institute, which is operated by the Association of Universities for Research in Astronomy, Inc., under NASA contract NAS-5-26555. These observations are associated with programs GO-14080, GO-13293, and GO-12928.