


Abstract
Simultaneous measurements of air showers with the fluorescence and surface detectors of the Pierre Auger Observatory allow a sensitive search for EeV photon point sources. Several Galactic and extragalactic candidate objects are grouped in classes to reduce the statistical penalty of many trials from that of a blind search and are analyzed for a significant excess above the background expectation. The presented search does not find any evidence for photon emission at candidate sources, and combined p-values for every class are reported. Particle and energy flux upper limits are given for selected candidate sources. These limits significantly constrain predictions of EeV proton emission models from non-transient Galactic and nearby extragalactic sources, as illustrated for the particular case of the Galactic center region.
Export citation and abstract BibTeX RIS
1. Introduction
Ultra-high energy (UHE) photons with energies around 1 EeV (1 EeV = 1018 eV) and above have not yet been identified (see Bleve & Pierre Auger Collaboration 2015 and references therein). At these high energies photons are produced primarily by  decays, implying the existence of hadrons (that cause the production of
  mesons) with energies typically 10 times higher than the secondary photon (Risse & Homola 2007). At energies of about 5 EeV, around the "ankle" of the energy spectrum (Abraham et al. 2010; Schulz & the Pierre Auger Collaboration 2013), several experiments, including the Pierre Auger Observatory, HiRes, and Telescope Array, have all found their measurements to be consistent with the existence of a light component among the cosmic rays (Abbasi et al. 2010; Abreu et al. 2012b; Jui & the Telescope Array Collaboration 2012; Aab et al. 2014a, 2014b, 2016). If these protons interact in the vicinity of their sources they can produce photons by pion photoproduction or inelastic nuclear collisions. Since photons are not deflected by magnetic fields, the experimental signature would then be an accumulation of photon-like events from a particular celestial direction.
Assuming that the energy spectra of measured TeV γ sources (Hinton & Hofmann 2009; Abramowski et al. 2011) extend to EeV energies, it is plausible that photon and neutron fluxes are also detectable in the EeV energy range. Sources producing particle fluxes according to an  energy spectrum inject equal energy into each decade. A measured energy flux of 1 eV cm−2 s−1 in the TeV decade would result in the same energy flux in the EeV decade if the spectrum continues to such high energies and energy losses en route to Earth are negligible (see Section 3). Furthermore, the H.E.S.S. collaboration measured a TeV gamma-ray spectrum from the Galactic center region without any observation of a cutoff or a spectral break up to tens of TeV, implying that our Galaxy hosts petaelectronvolt accelerators called "PeVatrons" (Abramowski et al. 2016). If these photons are produced in hadronic processes they are necessarily accompanied by neutrons produced in charge exchange interactions of protons. The ratio between photon and neutron emissivities from p–p collisions at the same pivot energy depends primarily on the spectral index of the proton source and it is shown in Crocker et al. (2005) that for spectral indices
  photon emissivities dominate, assuming a continuation of the parent proton spectrum well beyond the pivot energy. Several experiments, including the Pierre Auger Observatory, Telescope Array, IceCube, and KASCADE, searched for an indication of neutron fluxes above the PeV energy range from specific source directions, but no significant excess or correlation with catalogs could be found (e.g., Antoni et al. 2004; Aab et al. 2014d; Abbasi et al. 2015; Aartsen et al. 2016).
This paper reports on a targeted search for photon point sources at EeV energies and complements previous neutron searches. The search for a photon flux, as opposed to a neutron flux, has a more direct connection to TeV measurements where the messengers are photons. A neutron flux is limited by decay of the neutrons with a mean path length of 9.2 × E [EeV] kpc, requiring an energy of at least 1 EeV to observe the Galactic center region. In this paper we apply a lower energy threshold of  using events measured by the air fluorescence detector (FD) as well as the surface detector (SD) of the Pierre Auger Observatory (see Section 2). This choice provides high event statistics despite the reduced duty cycle of the FD. The sensitivity to photon point sources is increased by reducing the hadronic background contribution using mass-sensitive observables. In the case of neutron-induced air showers that is not possible, since they are indistinguishable from proton primaries.
In a previous paper the Pierre Auger Collaboration published the directional search for EeV photon point sources from any direction in the exposed sky (blind search; Aab et al. 2014c). That analysis did not find statistical evidence for any photon flux. The detected small p-values are within the expectation given 526,200 target centers. To reduce the statistical penalty of many trials from that of a blind search, this analysis focuses on just 12 target sets, each set being a class of possible sources of high-energy photons (Section 3). The candidate sources all lie in the declination range  and
and  . Targets in each class are combined in a "stacked analysis," assuming that most or all candidate sources in a target set are emitting photons resulting in a more significant combined signal compared to that of a single target (Section 4). The results of this analysis, including particle and energy flux upper limits of selected target directions, are given in Section 5. This study uses the same methods for hadron reduction and calculation of upper limits that were explained in the preceding paper.
2. Data Set
Air showers induced by UHE cosmic rays detected with the Pierre Auger Observatory (The Pierre Auger Collaboration 2015) are used in this analysis. The observatory is located in Argentina near Malargüe and is centered at latitude 35 2 S and longitude 695 W at a mean altitude of 1400 m above sea level. A SD of 1660 water-Cherenkov particle detectors covering an area of 3000 km2 on a triangular grid with 1.5 km spacing observes electrons, muons, and photons at the ground, with a duty cycle of nearly 100%. The area is overlooked by 27 fluorescence telescopes operating on dark nights with a duty cycle of ∼15%. Events recorded between 2005 January and 2013 December in hybrid mode, i.e., recorded by both the FD and SD, are used in this analysis. The selection criteria are the same as in the previous blind search paper (Aab et al. 2014c), but additional accumulated data increase the statistics by 28% to 308,676 recorded events in the present study. The energy range is between
  and
and  to take advantage of high statistics at low energies and to avoid additional shower development processes at the highest energies (Risse & Homola 2007). The average angular resolution of the final data set is 07.
3. Target Set
The detectable source distance is limited by interactions of UHE photons with low-energy background photons in pair or double-pair production processes. The attenuation length, i.e., the distance at which the survival probability has dropped to  , depends on the energy of the UHE photon. The expected attenuation length for photons in interactions with the cosmic microwave background (dominating) and with radio (Protheroe & Biermann 1996) and infrared (Kneiske et al. 2004) photon fields is shown as the solid black line in Figure 1. In the energy range of the data set, the attenuation length varies between 90 kpc at
  and 900 kpc at
  encompassing Galactic and nearby extragalactic sources. Requiring only a survival probability of 1% the attenuation length increases, as indicated by the dashed line in Figure 1, extending to a distance of a few Mpc at the highest energies considered and hence also including the nearest active galactic nucleus Centaurus A, which lies at less than 4 Mpc. It should be noted that the observable distance may increase further if including also secondary photons, i.e., UHE photons converted back from electrons via inverse Compton scattering within the electromagnetic cascading process taking place outside the Galaxy. However, to be useful for point source searches, these photons must be in the energy range and have parent electrons that have not been deflected more than
  in ambient magnetic fields (see Section 4). The expected increase of the maximum observable distance in a Kolmogorov-type turbulent field with a mean magnetic field strength
  is shown as the green shaded area in Figure 1, applying a three-dimensional CRPropa 3 simulation (Alves Batista et al. 2016). Note that even primary photon energies outside the energy window above
  become visible if there is sufficient time to form the electromagnetic cascade. However, these results are very sensitive to the uncertain extragalactic magnetic field assumption, e.g., the maximum observable distance would drop to the values corresponding to the primary photon line if the mean magnetic field were
  , since in this case the electrons would be largely deflected.
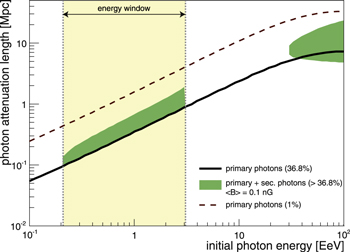
Figure 1. Photon attenuation length as a function of the initial primary energy. The thick black line indicates the attenuation length (survival probability  ) and the dashed line indicates a reduced survival probability of 1%. The energy range of this paper between
  and
and  is indicated by the yellow shaded region and the vertical dotted lines. The expected increase of the observable distance by including secondary photons (detected in the energy range of this paper and with less than
  deflection with respect to the primary photon) is shown as the green area using an average magnetic field strength of 0.1 nG.
Download figure:
Standard image High-resolution imageSince there is a close connection between hadronic production processes for photons and neutrons, any candidate source of neutrons is also a candidate source of photons. As a consequence this analysis adopts the Galactic point source target sets defined in Aab et al. (2014d) but adds the new H.E.S.S. unidentified sources reported in Deil et al. (2015). The Galactic source classes are millisecond pulsars (msec PSRs), γ-ray pulsars (γ-ray PSRs), low-mass and high-mass X-ray binaries (LMXBs and HMXBs), H.E.S.S. Pulsar Wind Nebulae (PWNe), other H.E.S.S. identified and unidentified sources, microquasars, magnetars, and the Galactic center. To retain independent target sets a candidate source that appears in two or more sets is kept only in the most exclusive set. Because the maximum observable distance of EeV photons is greater than that for EeV neutrons, two additional extragalactic target sets are included in this analysis. One set consists of three powerful gamma-ray emitters in the Large Magellanic Cloud (LMC) at a distance of ∼50 kpc (Abramowski et al. 2015). The core region of Centaurus A (Cen A) is, by itself, the second extragalactic target set. The 12 source classes collectively include 364 individual candidate source directions.
4. Analysis Method
To reduce the contamination of hadronic background events, only air showers similar to the photon expectation are selected using the multivariate method of Boosted Decision Trees (Breiman et al. 1984; Schapire 1990) trained with Monte Carlo simulations of showers produced by photon and proton primaries. For a fixed primary energy, photon induced air showers have, on average, a delayed shower development and fewer muons (mostly electromagnetic component) compared to hadron-induced showers. As in the previous photon search paper, five different mass-sensitive observables are used: the depth of shower maximum  (from FD, being sensitive to delayed shower development), reduced
  and normalized energy of the Greisen fit to the longitudinal profile (from FD, being sensitive to the electromagnetic component), Sb-parameter (Ros et al. 2011) (from SD, being sensitive to the slope of the lateral distribution of the shower, and hence to the muonic content), and the ratio of the early arriving to the late arriving integrated signal in the detector with the strongest signal (from SD, being sensitive to the muonic component and to the delayed shower development).
The optimized cut in the multivariate output distribution for a specific candidate source direction i depends on the expected number of isotropic background events bi. This number is calculated by applying the scrambling technique (Cassiday et al. 1990), and naturally takes into account detector efficiencies and aperture features by assigning arrival times and arrival directions, binned for each telescope, randomly from measured events. This procedure is repeated 5000 times and the mean number of arrival directions within a target is then used as the expected isotropic background count. For each target direction we use a top-hat counting region of  . Details of this multivariate cut selection and counting procedure are given in Aab et al. (2014c). Averaging over all 364 target directions, the multivariate cut is expected to retain 81.4% of photons while rejecting 95.2% of background hadrons. After applying the cut, the total number of recorded events from all of the targets is reduced from 11,180 to 474.
Each target set is tested with and without statistical weights. The weight wi is assigned to each target i in a target set proportional to the measured electromagnetic flux fi in the catalog and proportional to the directional photon exposure  of the Pierre Auger Observatory based on Settimo & The Pierre Auger Collaboration (2012). Relative attenuation differences from candidate sources of the same class can be neglected given an interaction length between 90 and 900 kpc of primary photons in the energy range considered (see Figure 1). The sum of weights in each set is normalized to 1 (see Aab et al. 2014d):

A p-value pi is assigned to each candidate source of a target set as follows. The p-value for the target i is defined by ![${p}_{i}\equiv [\mathrm{Poisson}({n}_{i},{b}_{i})+\mathrm{Poisson}({n}_{i}+1,{b}_{i})]/2$](https://content.cld.iop.org/journals/2041-8205/837/2/L25/revision1/apjlaa61a5ieqn25.gif) , where Poisson
, where Poisson  is the probability of getting ni or more arrival directions in the target when the observed value is ni, and the expected number from the background is bi. Averaging the values for n and
  avoids a bias toward low or high p-values for pure background fluctuations.
The combined weighted probability  is the fraction of isotropic simulations yielding a weighted product
  that is not greater than the measured weighted product
  :
:

where  denotes the p-value of target i in an isotropic simulation. The combined unweighted probability
  is given by the same formula with wi = 1 for all targets (see Aab et al. 2014d).
5. Results
The results for the combined analysis for each of the 12 target sets are shown in Table 1, along with detailed information about the target that has the smallest p-value in each set. In addition to the direction of the candidate source, the measured and expected numbers of events within an opening angle of  are given along with the required number of events for a
  observation. In the last two columns are the minimum p-value of the target set (p) and the penalized p-value
  , which is the chance probability that one or more of the N candidate sources in the target set would have a p-value less than p if the N p-values were randomly sampled from the uniform probability distribution.
Table 1.
Combined Unweighted Probabilities  and Weighted Probabilities
  for the 12 Target Sets
| Class | No. |

|

|
R.A. | Decl. | Obs | Exp | Exposure | Flux UL | E-flux UL | p | p* |
|---|---|---|---|---|---|---|---|---|---|---|---|---|
| (°) | (°) | (km2 yr) | (km−2 yr−1) | (eV cm−2 s−1) | ||||||||
| msec PSRs | 67 | 0.57 | 0.14 | 286.4 | 4.0 | 5 (7, 9*) | 1.433 | 236.1 | 0.043 | 0.077 | 0.010 | 0.476 |
| γ-ray PSRs | 75 | 0.97 | 0.98 | 312.8 | −8.5 | 6 (8, 10*) | 1.857 | 248.1 | 0.045 | 0.080 | 0.007 | 0.431 |
| LMXB | 87 | 0.13 | 0.74 | 258.1 | −40.8 | 6 (8, 11*) | 2.144 | 233.9 | 0.046 | 0.083 | 0.014 | 0.718 |
| HMXB | 48 | 0.33 | 0.84 | 285.9 | −3.2 | 4 (7, 9*) | 1.460 | 235.2 | 0.036 | 0.066 | 0.040 | 0.856 |
| H.E.S.S. PWN | 17 | 0.92 | 0.90 | 266.8 | −28.2 | 4 (8, 10*) | 2.045 | 211.4 | 0.038 | 0.068 | 0.104 | 0.845 |
| H.E.S.S. other | 16 | 0.12 | 0.52 | 258.3 | −39.8 | 5 (8, 10*) | 2.103 | 233.3 | 0.040 | 0.072 | 0.042 | 0.493 |
| H.E.S.S. UNID | 20 | 0.79 | 0.45 | 257.1 | −41.1 | 6 (8, 10*) | 2.142 | 239.2 | 0.045 | 0.081 | 0.014 | 0.251 |
| Microquasars | 13 | 0.29 | 0.48 | 267.0 | −28.1 | 5 (8, 10*) | 2.044 | 211.4 | 0.045 | 0.080 | 0.037 | 0.391 |
| Magnetars | 16 | 0.30 | 0.89 | 257.2 | −40.1 | 4 (8, 10*) | 2.122 | 253.8 | 0.031 | 0.056 | 0.115 | 0.858 |
| Gal. Center | 1 | 0.59 | 0.59 | 266.4 | −29.0 | 2 (8, 8*) | 2.048 | 218.9 | 0.024 | 0.044 | 0.471 | 0.471 |
| LMC | 3 | 0.52 | 0.62 | 84.4 | −69.2 | 2 (8, 9*) | 2.015 | 180.3 | 0.030 | 0.053 | 0.463 | 0.845 |
| Cen A | 1 | 0.31 | 0.31 | 201.4 | −43.0 | 3 (8, 8*) | 1.948 | 214.1 | 0.031 | 0.056 | 0.221 | 0.221 |
Note. In addition, information on the most significant target from each target set is given. The number of observed (Obs) and expected (Exp) events and the corresponding exposure are shown. The numbers in brackets in the observed number of events column indicate the numbers of events needed for a  observation unpenalized and penalized (*). Upper limits (UL) are computed at the 95% confidence level. The last two columns indicate the p-value unpenalized (p) and penalized (p*). Due to the discrete distribution of p-values arising in isotropic simulations,
  can differ from p in the sets that contain only a single target.
Download table as: ASCIITypeset image
No combined p-value ( or
or  ) nor any individual target p-value has a statistical significance as great as
  . Upper limits are therefore derived for the flux from the target of smallest p-value in each target set assuming an
  photon spectrum and they are indicated in Table 1. Upper limits on the photon flux from a point source i are calculated as
  , where
  is the upper limit, at the 95% confidence level, on the number of photons using Zech's definition (Zech 1989),
  is the expected signal fraction within the search window, and
  is the directional photon exposure.
Various sources of systematic uncertainties have been investigated in Aab et al. (2014c). The main contribution arises from the unknown photon spectral index due to the associated change in the directional photon exposure. Differences in the particle flux upper limit of −34% and +51% have been estimated when changing the photon spectral index from 2.0 to 1.5 or 2.5, respectively. Considering the background rejection, differences in the hadronic interaction models change the particle flux upper limits by, on average, −9% when using EPOS-LHC (Pierog et al. 2015) for proton simulations instead of QGSJET-01c (Kalmykov & Ostapchenko 1989).
In the following, the limit on the Galactic center is examined in more detail. This is of particular interest, as the H.E.S.S. collaboration recently reported an indication of the acceleration of PeV protons from this region (Abramowski et al. 2016). H.E.S.S. measured the diffuse γ-ray emission following a power-law spectrum according to  with a spectral index of
  and flux normalization
  TeV−1 cm−2 s−1 without a cutoff or break up to tens of TeV (Abramowski et al. 2016). Since the results in Table 1 are based on a photon spectral index of
  the limit is recalculated assuming
  , resulting in a particle flux upper limit at the 95% confidence level of the Galactic center region of
  km−2 yr−1. As can be seen in Figure 2, the current photon flux upper limit can severely constrain the allowed parameter space for a flux continuation to EeV energies. This extrapolation takes into account interactions with the cosmic microwave background (dominating) and with radio (Protheroe & Biermann 1996) and infrared (Gilmore et al. 2012) photon fields. Furthermore, assuming a power law with an exponential cutoff of the form
  an upper limit of the cutoff energy
  can be placed by setting
  with
with  and
and  and solving for
  . The corresponding cutoff spectrum is also given by the dashed line in Figure 2.

Figure 2. Photon flux as a function of energy from the Galactic center region. Measured data by H.E.S.S. are indicated, as well as the extrapolated photon flux at Earth in the EeV range, given the quoted spectral indices (Abramowski et al. 2016; conservatively the extrapolation does not take into account the increase of the p–p cross-section toward higher energies). The Auger limit is indicated by a green line. A variation of the assumed spectral index by ±0.11 according to systematics of the H.E.S.S. measurement is denoted by the light green and blue band. A spectral index with cutoff energy  is indicated as well.
Download figure:
Standard image High-resolution image
6. Discussion
No target class reveals compelling evidence for photon-emitting sources in the EeV energy regime. For the 12 sets, the minimum combined weighted probability  is 0.12. With 12 trials, one expects a
  -value at least that small to occur by chance, with 78% confidence. The minimum unweighted
  -value, 0.14, is similarly not statistically significant. There is also no evidence for one outstanding target in any target set. The minimum penalized p-value p* in the 12 sets is 0.221. The null result holds also against the hypothesis that only a subset of some target class contributes a photon flux. This has been tested by calculating combined
  -values scanning only over the most significant, i.e., the smallest p-value, targets in the catalog.
The results presented in this paper complement previous results published by the Pierre Auger Collaboration searching for neutrons at higher energies using SD data (Abreu et al. 2012a; Aab et al. 2014d), and photons using hybrid data (Aab et al. 2014c), by restricting the photon search to 12 predefined target classes. Flux upper limits from photon point sources constrain the continuation of measured TeV fluxes to EeV energies, as shown for the particular case of the Galactic center introducing an upper limit of the cutoff photon energy of  .
.
The discovery of photon fluxes from any target set or individual targets in this study would have proved that EeV protons are being accelerated at discrete sources within the galaxy or its neighborhood. The null results reported here leave open the possibility that EeV protons, as observed on Earth, are of extragalactic origin. Some support for that hypothesis was noted in the large-scale anisotropy analysis of Auger data (Abreu et al. 2013). It is important to note, however, that the absence of detectable photon fluxes, as reported here, does not exclude the production of EeV protons within the galaxy. The derived flux limits are time-averaged values. EeV photons might be produced in transient sources, such as gamma-ray bursts or supernovae, or aligned in jets not pointing to us. An alternative explanation is that EeV protons escape from a source more freely than protons that produce TeV photon fluxes, and the production of EeV photons is thereby too meager to be detectable in the present study.
With the detector upgrade AugerPrime (Engel & the Pierre Auger Collaboration 2015; The Pierre Auger Collaboration 2016) the photon-hadron separation will be further improved, allowing an increased sensitivity for photon point sources.
The successful installation, commissioning, and operation of the Pierre Auger Observatory would not have been possible without the strong commitment and effort from the technical and administrative staff in Malargüe. We are very grateful to the following agencies and organizations for financial support:
Argentina—Comisión Nacional de Energía Atómica; Agencia Nacional de Promoción Científica y Tecnológica (ANPCyT); Consejo Nacional de Investigaciones Científicas y Técnicas (CONICET); Gobierno de la Provincia de Mendoza; Municipalidad de Malargüe; NDM Holdings and Valle Las Leñas, in gratitude for their continuing cooperation over land access; Australia—the Australian Research Council; Brazil—Conselho Nacional de Desenvolvimento Científico e Tecnológico (CNPq); Financiadora de Estudos e Projetos (FINEP); Fundação de Amparo à Pesquisa do Estado de Rio de Janeiro (FAPERJ); São Paulo Research Foundation (FAPESP) Grants No. 2010/07359-6 and No. 1999/05404-3; Ministério de Ciência e Tecnologia (MCT); Czech Republic—Grant No. MSMT CR LG15014, LO1305, and LM2015038 and the Czech Science Foundation Grant No. 14-17501S; France—Centre de Calcul IN2P3/CNRS; Centre National de la Recherche Scientifique (CNRS); Conseil Régional Ile-de-France; Département Physique Nucléaire et Corpusculaire (PNC-IN2P3/CNRS); Département Sciences de l'Univers (SDU-INSU/CNRS); Institut Lagrange de Paris (ILP) Grant No. LABEX ANR-10-LABX-63 within the Investissements d'Avenir Programme Grant No. ANR-11-IDEX-0004-02; Germany—Bundesministerium für Bildung und Forschung (BMBF); Deutsche Forschungsgemeinschaft (DFG); Finanzministerium Baden-Württemberg; Helmholtz Alliance for Astroparticle Physics (HAP); Helmholtz-Gemeinschaft Deutscher Forschungszentren (HGF); Ministerium für Innovation, Wissenschaft und Forschung des Landes Nordrhein-Westfalen; Ministerium für Wissenschaft, Forschung und Kunst des Landes Baden-Württemberg; Italy—Istituto Nazionale di Fisica Nucleare (INFN); Istituto Nazionale di Astrofisica (INAF); Ministero dell'Istruzione, dell'Universitá e della Ricerca (MIUR); CETEMPS Center of Excellence; Ministero degli Affari Esteri (MAE); Mexico—Consejo Nacional de Ciencia y Tecnología (CONACYT) No. 167733; Universidad Nacional Autónoma de México (UNAM); PAPIIT DGAPA-UNAM; The Netherlands—Ministerie van Onderwijs, Cultuur en Wetenschap; Nederlandse Organisatie voor Wetenschappelijk Onderzoek (NWO); Stichting voor Fundamenteel Onderzoek der Materie (FOM); Poland—National Centre for Research and Development, Grants No. ERA-NET-ASPERA/01/11 and No. ERA-NET-ASPERA/02/11; National Science Centre, Grants No. 2013/08/M/ST9/00322, No. 2013/08/M/ST9/00728, and No. HARMONIA 5—2013/10/M/ST9/00062; Portugal—Portuguese national funds and FEDER funds within Programa Operacional Factores de Competitividade through Fundação para a Ciência e a Tecnologia (COMPETE); Romania—Romanian Authority for Scientific Research ANCS; CNDI-UEFISCDI partnership projects Grants No. 20/2012 and No.194/2012 and PN 16 42 01 02; Slovenia—Slovenian Research Agency; Spain—Comunidad de Madrid; Fondo Europeo de Desarrollo Regional (FEDER) funds; Ministerio de Economía y Competitividad; Xunta de Galicia; European Community 7th Framework Program Grant No. FP7-PEOPLE-2012-IEF-328826; USA—Department of Energy, Contracts No. DE-AC02-07CH11359, No. DE-FR02-04ER41300, No. DE-FG02-99ER41107 and No. DE-SC0011689; National Science Foundation, Grant No. 0450696; The Grainger Foundation; Marie Curie-IRSES/EPLANET; European Particle Physics Latin American Network; European Union 7th Framework Program, Grant No. PIRSES-2009-GA-246806; and UNESCO.