


ABSTRACT
HCN is an important constituent in Titan's upper atmosphere, serving as the main coolant in the local energy budget. In this study, we derive the HCN abundance at the altitude range of 960–1400 km, combining the Ion-Neutral Mass Spectrometer data acquired during a large number of Cassini flybys with Titan. Typically, the HCN abundance declines modestly with increasing altitude and flattens to a near constant level above 1200 km. The data reveal a tendency for dayside depletion of HCN, which is clearly visible below 1000 km but weakens with increasing altitude. Despite the absence of convincing anti-correlation between HCN volume mixing ratio and neutral temperature, we argue that the variability in HCN abundance makes an important contribution to the large temperature variability observed in Titan's upper atmosphere.
Export citation and abstract BibTeX RIS
1. INTRODUCTION
Titan, the largest satellite of Saturn, contains a chemically complicated atmosphere/ionosphere where the dissociation of N2 and CH4 by either solar radiation or charged particle precipitation leads to the formation of a variety of organic molecules from relatively simple hydrocarbons and nitriles to negatively charged massive molecules known as tholins (Waite et al. 2007). Among all the detected constituents, hydrogen cyanide (HCN) is of special interest. It is produced in Titan's thermosphere and mesosphere from photochemistry (e.g., Wilson & Atreya 2004; Lavvas et al. 2008; Krasnopolsky 2014), and removed by condensation in the stratosphere (e.g., Lavvas et al. 2011; de Kok et al. 2014). The seminal work by Yelle (1991) revealed that throughout Titan's upper atmosphere, the dominant cooling mechanism is the rotational line emission of HCN molecules. This scenario has been widely accepted in subsequent modeling works (e.g., Müller-Wodarg et al. 2000; Bell et al. 2010).
Following early remote-sensing observations, either ground-based (e.g., Marten et al. 2002; Coustenis et al. 2003; Yelle & Griffith 2003) or Voyager-based (e.g., Coustenis & Bezard 1995; Vervack et al. 2004), our knowledge of the HCN distribution in Titan's atmosphere has been greatly improved by extensive measurements made by a variety of instruments on board Cassini, including the Composite Infrared Spectrometer (CIRS) that samples the stratosphere (e.g., Teanby et al. 2006, 2007, 2008), as well as the Visual Infrared Mapping Spectrometer (VIMS; e.g., Adriani et al. 2011), the Ultraviolet Spectrometer (UVIS; e.g., Koskinen et al. 2011), and the Ion-Neutral Mass Spectrometer (INMS; e.g., Vuitton et al. 2007; Magee et al. 2009) that sample the mesosphere and thermosphere. Among these instruments, INMS provides the largest data set available for constraining the HCN abundance, but it is the least analyzed in existing studies.
With the accumulation of the Cassini data over the past 7 years, it is timely to perform a thorough and systematic analysis of the HCN distribution in Titan's upper atmosphere based on the INMS data currently available at the Planetary Plasma Interactions (PPI) node of the NASA Planetary Data System (PDS) public archives (http://ppi.pds.nasa.gov). Details of data reduction are provided in Section 2. We then present in Section 3 the observed vertical and diurnal variations of HCN in Titan's upper atmosphere. Finally, concluding remarks are given in Section 4 where we also discuss the impact of the variability in HCN abundance on the variability in neutral temperature.
2. THE RETRIEVAL OF HCN ABUNDANCE
In this work, we retrieve the HCN abundance in Titan's upper atmosphere from the INMS data obtained in the Closed Source Neutral (CSN) mode during close flybys of Cassini with the satellite (Waite et al. 2005). The HCN number densities could in principle be inferred from the counts at  amu where M/Z is the mass-to-charge ratio, but these counts are contaminated by the overflow of signals at
  amu due to the high N2 density in the ambient atmosphere (Cui et al. 2009). Fortunately, such a contamination, denoted as channel crosstalk in Cui et al. (2009), could be avoided by using the INMS data made with a high-resolution mass scan, at a mass resolution of 0.125 amu to be compared with the ordinary resolution of 1 amu (Magee et al. 2009). The low-mass resolution data, making up the bulk of the available INMS sample in the CSN mode, have been extensively used in previous data analysis works (e.g., Müller-Wodarg et al. 2008; Cui et al. 2009; Magee et al. 2009).
By inspecting the typical high-resolution mass spectrum over the  range of 25–29 amu, Magee et al. (2009) argued that the counts at
  , 26.75 and 26.875 amu were relatively constant and more appropriate for deriving the HCN densities in the ambient atmosphere than the counts at
  amu (see their Figure 17). Among all Titan flybys with INMS neutral data that are available to us (up to T107), 41 contain both low- and high-mass resolution measurements. Typically, the low-mass resolution data cover a continuous altitude range from the closest approach (CA) to above the exobase, whereas the high-mass resolution data cover a much narrower range from 960 to 1100 km. To make use of both the extended sampling of the low-mass resolution data and the robustness of the high-mass resolution data, for each flyby we calculate the ratio of the average count at
  , 26.75, and 26.875 amu to the count at
  amu. We find this ratio to be fairly constant from flyby to flyby, at least over the sampled N2 density range of (0.2–
 cm−3. Throughout this study, a mean ratio of 0.93 is used to correct for channel crosstalk.
The sample used for mapping the distribution of HCN in Titan's upper atmosphere includes a total number of 49 flybys with low-mass resolution measurements available at  amu, irrespective of whether high-mass resolution measurements exist or not. Such a sample is significantly larger than any of the INMS samples used in previous works, giving more than 2100 individual measurements of HCN abundance over the altitude range from below 1000 km up to 1400 km. Above 1400 km, the counts at
  amu are typically too noisy to allow a robust determination of the ambient HCN abundance.
The corrected counts at  amu from the low-resolution mass scan are converted to number densities using the appropriate peak sensitivity and ram enhancement factor for HCN. The former, being
  cm3 s−1, is smaller than the old value of Cui et al. (2009) by a factor of 1.55 to account for INMS detector gain reduction (Teolis et al. 2015). The latter is calculated based on the realistic neutral gas transmission through the instrument, including flow pathways not recognized in previous works (Teolis et al. 2015). The HCN volume mixing ratios are then obtained by using the N2 and CH4 density profiles of Cui et al. (2012), recalculated with the above-mentioned updates in ram enhancement and sensitivity.
Taking the T41 flyby as an example, we show the HCN density as a function of altitude in Figure 1, with inbound and outbound densities given by circles and squares, respectively. All error bars in the figure represent uncertainties in density due to counting statistics. The difference between the inbound and outbound measurements should not be interpreted as horizontal variation, but is instead indicative of wall chemistry that is well-known to occur on the inner surface of the INMS antechamber and enhance the outbound densities of most hydrocarbons and nitriles (Vuitton et al. 2008; Cui et al. 2009). To avoid such an instrumental effect, we hereby focus on the inbound INMS data only. For comparison, in the same figure we show the HCN density profile acquired by UVIS during the same Titan flyby, represented by triangles (Koskinen et al. 2011). The altitude ranges probed by the two instruments connect at 1000 km, where both INMS and UVIS give an identical HCN density of  cm−3. Such a consistency between measurements made by two completely different instruments is a demonstration of the validity of the results presented below.
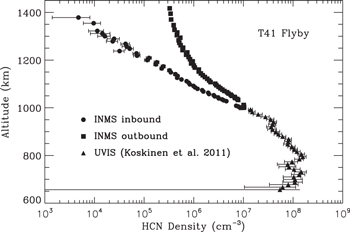
Figure 1. HCN density as a function of altitude in Titan's upper atmosphere derived from the INMS data acquired during the T41 flyby. The circles and squares represent the inbound and outbound measurements, respectively. The outbound densities are substantially higher than the inbound values, indicative of wall chemistry occurring on the inner surface of the INMS antechamber (Cui et al. 2009). For comparison, the HCN densities acquired by UVIS during the same Titan flyby are shown by the triangles (Koskinen et al. 2011). The altitude ranges probed by the two instruments connect at 1000 km, where both INMS and UVIS give an identical HCN density of  cm−3.
cm−3.
Download figure:
Standard image High-resolution image3. THE VERTICAL AND DIURNAL VARIATIONS OF HCN ABUNDANCE
In Table 1 we provide the HCN volume mixing ratios in units of 10−4 for all individual flybys in our sample, interpolated to a common altitude grid from 960 km to above 1200 km. Except for in the last column, each value is calculated as the mean of all measurements made within a vertical extent of 10 km around the given altitude. Only measurements with signal-to-noise ratios greater than 3 are included. The solar zenith angle (SZA) at CA for each flyby is also tabulated. The compilation of these results incorporates both vertical and diurnal variations of HCN in Titan's upper atmosphere, detailed as follows.
Table 1. HCN Volume Mixing Ratios in Titan's Upper Atmosphere for all Individual Flybys in Our Sample, Interpolated to a Common Altitude Grid from 960 to above 1200 km
| Flyby | SZA | Temp. (K) | Alt. (km) | ||||||
|---|---|---|---|---|---|---|---|---|---|
| 960 | 980 | 1000 | 1050 | 1100 | 1150 |

|
|||
| TA | 91° | 143 | ⋯ | ⋯ | ⋯ | ⋯ | ⋯ | ⋯ | 4.25 (0.14) |
| TB | 101° | ⋯ | ⋯ | ⋯ | ⋯ | ⋯ | ⋯ | ⋯ | 0.71 (0.06) |
| T5 | 127° | 157 | ⋯ | ⋯ | ⋯ | 5.60 (0.12) | 4.46 (0.20) | 3.96 (0.21) | 3.74 (0.13) |
| T16 | 105° | ⋯ | 4.49 (0.08) | 4.31 (0.11) | 4.23 (0.11) | ⋯ | 3.41 (0.15) | 2.99 (0.15) | 2.58 (0.14) |
| T17 | 45° | 121 | ⋯ | ⋯ | 7.28 (0.13) | ⋯ | ⋯ | ⋯ | 5.22 (1.06) |
| T18 | 90° | 126 | 5.19 (0.12) | 4.67 (0.08) | 4.21 (0.10) | 4.10 (0.12) | 3.74 (0.22) | 3.43 (0.24) | 3.39 (0.18) |
| T19 | 81° | 142 | ⋯ | 6.98 (0.17) | 6.40 (0.11) | 5.19 (0.16) | 4.53 (0.21) | 3.79 (0.29) | 3.64 (0.17) |
| T20 | 25° | 171 | ⋯ | ⋯ | ⋯ | 4.76 (0.12) | 4.18 (0.17) | 3.75 (0.23) | 3.78 (0.19) |
| T21 | 125° | 156 | ⋯ | ⋯ | 5.43 (0.13) | 4.42 (0.12) | 3.90 (0.14) | 3.31 (0.25) | 2.96 (0.09) |
| T23 | 53° | 151 | ⋯ | ⋯ | 5.61 (0.09) | 4.71 (0.13) | 4.22 (0.13) | 4.34 (0.19) | 3.58 (0.11) |
| T25 | 161° | 178 | ⋯ | ⋯ | 6.17 (0.11) | 4.14 (0.12) | 3.39 (0.16) | 3.46 (0.23) | 3.02 (0.10) |
| T26 | 149° | 152 | ⋯ | 6.87 (0.26) | 6.16 (0.10) | 4.81 (0.13) | 4.57 (0.13) | 4.42 (0.26) | 3.66 (0.10) |
| T27 | 144° | 134 | ⋯ | ⋯ | ⋯ | 4.71 (0.10) | 4.21 (0.14) | 3.77 (0.22) | 3.74 (0.18) |
| T28 | 137° | 145 | ⋯ | ⋯ | 6.58 (0.16) | 4.98 (0.13) | 4.39 (0.13) | 4.08 (0.20) | 3.97 (0.13) |
| T29 | 130° | 158 | ⋯ | 6.90 (0.11) | ⋯ | 5.27 (0.14) | 4.85 (0.16) | 4.65 (0.25) | 4.10 (0.12) |
| T30 | 122° | 151 | 5.79 (0.10) | ⋯ | 4.55 (0.12) | 4.73 (0.17) | 4.42 (0.24) | 4.59 (0.28) | 3.93 (0.14) |
| T32 | 107° | 129 | ⋯ | ⋯ | 4.57 (0.09) | 4.32 (0.12) | 3.85 (0.23) | 4.00 (0.30) | 3.47 (0.19) |
| T34 | 34° | ⋯ | ⋯ | ⋯ | ⋯ | ⋯ | ⋯ | ⋯ | 3.61 (0.34) |
| T36 | 67° | 182 | ⋯ | 4.37 (0.09) | 3.97 (0.11) | 4.23 (0.14) | 4.17 (0.25) | 4.01 (0.19) | 3.17 (0.11) |
| T38 | 70° | ⋯ | ⋯ | ⋯ | ⋯ | ⋯ | ⋯ | ⋯ | 4.36 (0.22) |
| T39 | 61° | 124 | ⋯ | 5.78 (0.17) | 5.39 (0.11) | 4.74 (0.12) | 4.24 (0.17) | 3.92 (0.22) | 3.89 (0.21) |
| T40 | 38° | 137 | ⋯ | ⋯ | ⋯ | 4.50 (0.10) | 4.20 (0.19) | 3.97 (0.17) | 3.95 (0.14) |
| T41 | 30° | ⋯ | ⋯ | ⋯ | 5.88 (0.10) | 4.56 (0.14) | 4.19 (0.18) | 4.09 (0.28) | 4.11 (0.27) |
| T42 | 21° | 158 | ⋯ | ⋯ | 8.56 (0.13) | 7.73 (0.22) | 6.60 (0.21) | 6.35 (0.26) | 6.20 (0.17) |
| T43 | 36° | 113 | ⋯ | ⋯ | 5.26 (0.12) | 4.15 (0.12) | 3.98 (0.21) | 3.30 (0.23) | 3.34 (0.24) |
| T48 | 25° | 149 | 5.98 (0.10) | ⋯ | 4.71 (0.11) | 4.22 (0.13) | 4.07 (0.29) | 3.70 (0.31) | 3.14 (0.16) |
| T49 | 83° | ⋯ | ⋯ | 5.62 (0.14) | 4.84 (0.12) | 4.35 (0.18) | 4.10 (0.16) | 3.97 (0.33) | 3.71 (0.23) |
| T50 | 136° | 133 | ⋯ | 4.14 (0.14) | 3.81 (0.09) | 3.32 (0.13) | 2.81 (0.16) | 2.40 (0.24) | 2.20 (0.17) |
| T51 | 84° | ⋯ | 7.51 (0.15) | ⋯ | 5.99 (0.15) | 5.18 (0.16) | 4.98 (0.20) | 4.87 (0.37) | 4.55 (0.25) |
| T55 | 142° | ⋯ | ⋯ | 6.10 (0.10) | 5.68 (0.12) | 5.31 (0.16) | 5.21 (0.22) | 4.81 (0.37) | 4.89 (0.23) |
| T56 | 135° | 129 | ⋯ | 4.56 (0.15) | 4.46 (0.10) | 4.46 (0.21) | 3.68 (0.24) | 4.30 (0.42) | 4.07 (0.27) |
| T57 | 128° | 141 | 6.69 (0.09) | 5.92 (0.15) | 5.34 (0.13) | 5.14 (0.21) | 4.85 (0.19) | 4.82 (0.34) | 3.90 (0.17) |
| T58 | 120° | 143 | ⋯ | ⋯ | 5.25 (0.14) | 4.36 (0.18) | 3.89 (0.24) | 3.54 (0.27) | 3.94 (0.22) |
| T59 | 112° | 138 | 4.86 (0.07) | 4.35 (0.11) | 4.27 (0.10) | 4.41 (0.18) | 3.64 (0.16) | 3.81 (0.31) | 3.39 (0.20) |
| T61 | 86° | 118 | 6.13 (0.10) | ⋯ | 5.04 (0.10) | 4.50 (0.14) | 3.93 (0.24) | 3.59 (0.33) | 3.71 (0.26) |
| T64 | 86° | ⋯ | 8.64 (0.21) | ⋯ | 6.30 (0.23) | 6.43 (0.32) | 5.83 (0.23) | 4.91 (0.42) | 4.44 (0.27) |
| T65 | 95° | 151 | ⋯ | ⋯ | ⋯ | ⋯ | 6.36 (0.18) | 6.17 (0.30) | 5.50 (0.19) |
| T71 | 82° | 140 | ⋯ | ⋯ | 5.14 (0.13) | 4.97 (0.12) | 5.07 (0.18) | 4.42 (0.34) | 3.36 (0.14) |
| T83 | 71° | 142 | 3.52 (0.07) | 3.18 (0.07) | 2.92 (0.08) | 2.76 (0.19) | 2.06 (0.14) | 2.21 (0.34) | 2.14 (0.18) |
| T84 | 75° | ⋯ | 3.51 (0.06) | 3.30 (0.14) | 3.27 (0.08) | 3.08 (0.12) | 2.89 (0.22) | 2.89 (0.29) | 2.71 (0.18) |
| T86 | 47° | ⋯ | 3.25 (0.04) | 2.99 (0.07) | 2.97 (0.10) | ⋯ | 2.35 (0.15) | 2.01 (0.23) | 2.22 (0.19) |
| T87 | 68° | 156 | ⋯ | 5.19 (0.10) | 4.70 (0.13) | 4.24 (0.19) | 3.57 (0.19) | 3.52 (0.32) | 3.08 (0.21) |
| T91 | 50° | ⋯ | ⋯ | 3.46 (0.08) | 3.31 (0.10) | 2.62 (0.15) | 2.39 (0.15) | 1.94 (0.25) | 2.78 (0.26) |
| T92 | 46° | ⋯ | 3.61 (0.10) | 3.33 (0.07) | 3.42 (0.10) | ⋯ | 3.17 (0.23) | 2.51 (0.20) | 2.41 (0.16) |
| T95 | 25° | ⋯ | 5.42 (0.09) | 4.57 (0.17) | 4.21 (0.12) | 3.63 (0.14) | 3.27 (0.14) | 2.76 (0.19) | 2.73 (0.14) |
| T98 | 44° | 206 | ⋯ | ⋯ | ⋯ | ⋯ | ⋯ | ⋯ | 3.58 (0.12) |
| T100 | 60° | ⋯ | 4.33 (0.11) | ⋯ | 3.76 (0.11) | 3.37 (0.11) | 3.18 (0.17) | 3.11 (0.13) | 2.81 (0.07) |
| T104 | 12° | 185 | 4.31 (0.12) | ⋯ | 3.81 (0.11) | 3.48 (0.15) | 3.19 (0.28) | 3.22 (0.27) | 3.05 (0.15) |
| T107 | 56° | 145 | ⋯ | 3.93 (0.08) | 3.61 (0.16) | 3.40 (0.15) | 3.41 (0.26) | 2.88 (0.28) | 3.02 (0.19) |
| Mean | ⋯ | 147 | 5.20 (1.54) | 4.79 (1.27) | 4.92 (1.24) | 4.48 (0.94) | 4.03 (0.95) | 3.78 (0.95) | 3.54 (0.92) |
Note. Only inbound measurements with signal-to-noise ratios greater than 3 are included. All volume mixing ratios are in units of 10−4 and values in the parentheses represent uncertainties due to counting statistics. Also provided in the table are the solar zenith angles (SZA) at the closest approach (CA) and the neutral temperature for each flyby. The last row gives the globally averaged profile for the HCN volume mixing ratio, with values in parentheses reflecting flyby-to-flyby variability in terms of standard deviation.
Download table as: ASCIITypeset image
The vertical profiles of HCN volume mixing ratio from several representative flybys, T26, T55, T83 and T104, are shown in Figure 2, with error bars representing uncertainties due to counting statistics. Each profile reveals a clear trend of decreasing HCN abundance with increasing altitude but flattening to a near constant level above 1200 km. These asymptotic HCN volume mixing ratios are calculated by averaging all measurements made at 1200–1400 km, and provided in the last column of Table 1. The globally averaged distribution is represented by the thick dashed line in each panel for comparison (see also the last row of Table 1, with values in parentheses characterizing the flyby-to-flyby variability in terms of standard deviation). The mean HCN volume mixing ratio is  at 960 km and declines by a modest amount to an asymptotic value of
  above 1200 km.
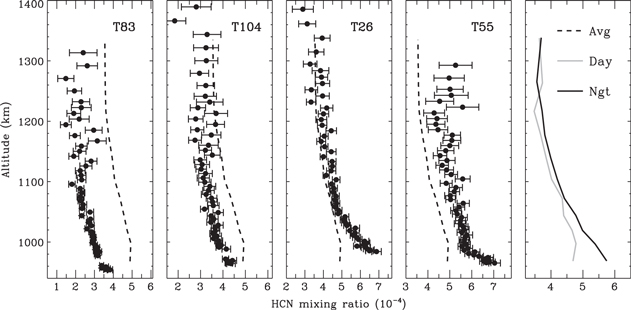
Figure 2. HCN volume mixing ratio as a function of altitude in Titan's upper atmosphere derived from the inbound INMS data for several representative flybys (T26, T55, T83, and T104). The thick dashed lines in these panels show the globally averaged profile for comparison. Typically, the HCN volume mixing ratio declines modestly with increasing altitude but flattens to a near constant level above 1200 km. The rightmost panel compares the dayside and nightside averaged profiles, with a clear signature of dayside depletion of HCN but restricted to altitudes below 1100 km.
Download figure:
Standard image High-resolution imageBased on the data from the same instrument, Magee et al. (2009) reported a mean HCN volume mixing ratio of  at 1050 km, lower than our value of
  by nearly 50%. This difference is partly because the sample used here is substantially larger than that of Magee et al. (2009), and partly because the INMS data reduction procedures have been improved over time, especially in terms of an updated algorithm for calculating the background N2 and CH4 densities in regions where counter saturation is a concern (Cui et al. 2012). Also based on the INMS data, Vuitton et al. (2007) derived an HCN volume mixing ratio of
  at 1100 km, comparable to Magee et al.'s result and lower than ours. We caution that Vuitton et al. (2007) calculated the HCN densities indirectly from the densities of other constituents, both neutral and ionic, using a prescribed list of ion-neutral chemical reactions and assuming photochemical equilibrium. Therefore Vuitton et al.'s result is subject to additional uncertainties in the photochemical network assumed for Titan's atmosphere/ionosphere.
The flyby-to-flyby variability in HCN abundance is large based on Table 1. For example, the maximum HCN volume mixing ratio at 1000 km is encountered in T42 with  , whereas the minimum is encountered in T83 with
  . They differ by nearly a factor of 3.
Adriani et al. (2011) have shown that the HCN number densities derived from the VIMS limb observations present clear diurnal variation in Titan's middle/upper atmosphere over the SZA range of 40°–80°. Such a variation, in terms of increasing HCN density with increasing SZA, is most pronounced at 600–800 km and diminishes both above and below. Of more interest is the diurnal variation of a minor constituent in terms of its volume mixing ratio. In Figure 2, T83 and T104 sample the dayside of Titan, both showing depleted HCN at all altitudes compared to the globally averaged case. In contrast, T26 and T55 are typical nightside flybys, both with enhanced HCN. These facts motivate us to examine possible diurnal variation of HCN abundance based on the INMS data as well.
The diurnal variation of the INMS-derived HCN abundance is demonstrated in the rightmost panel of Figure 2, where we compare the HCN volume mixing ratio profiles averaged over the dayside and nightside, respectively. Here, to allow for the extended nature of Titan's atmosphere (Müller-Wodarg et al. 2000), the dayside and nightside subsamples are defined with a separating SZA of 110°. The figure reveals a tendency for dayside depletion of HCN in Titan's upper atmosphere. At the altitudes probed by INMS, the observed diurnal difference is maximized near the lower boundary, with a dayside mean HCN volume mixing ratio of  at 980 km and a nightside mean of
  at the same altitude. Such a tendency gradually weakens with increasing altitude, with the HCN volume mixing ratios on both sides merging to a common asymptotic value of
  above 1200 km. The overall trend of the diurnal difference appears to be consistent, at least qualitatively, with that found by Adriani et al. (2011), but we caution that those authors reported a dayside averaged HCN volume mixing ratio of
  at 1000 km, an order of magnitude higher than our value and that of Koskinen et al. (2011) as well. The reason for such a difference is unclear, but we note that most of the recent photochemical model calculations predict an HCN volume mixing ratio of several 10−4 at relevant altitudes (e.g., Lavvas et al. 2008; Krasnopolsky 2014).
4. DISCUSSIONS AND CONCLUSIONS
In this study, we derived the HCN abundance in Titan's upper atmosphere, combining the inbound INMS measurements made during 49 Cassini flybys. Such a sample is significantly larger than any of the INMS samples used in previous works. In our data analysis, an updated algorithm for calculating ram enhancement is adopted following Teolis et al. (2015). We also correct for channel crosstalk that is crucial for deriving HCN densities from the raw counts at  amu acquired from a low-resolution mass scan (Magee et al. 2009). Cross-instrument comparisons suggest that the HCN densities derived here are in perfect agreement with the UVIS results (Koskinen et al. 2011), both substantially lower than the VIMS results (Adriani et al. 2011). Modest differences from the early INMS result of Magee et al. (2009) are due to the substantial increase in sample size, as well as the updates to INMS data reduction algorithms.
Typically, the HCN abundance declines modestly with increasing altitude and flattens to a near constant level above 1200 km. In the globally averaged sense, our analysis indicates an HCN volume mixing ratio of  at 960 km and
  above 1200 km. Photochemical model calculations predict that at the lowest altitude probed by INMS, the molecular diffusion timescale of HCN is comparable to its chemical timescale, but the former falls off with increasing altitude more steeply than the latter (e.g., Lavvas et al. 2008). This implies that the vertical shape of HCN abundance is eventually controlled by dynamics at sufficiently high altitudes, where the observation of a constant HCN volume mixing ratio is expected due to the small mass difference between HCN and background N2.
Considerable flyby-to-flyby variability in HCN is seen in the INMS data. Of special interest is a tendency for dayside depletion of HCN, as compared to the nightside. This could be interpreted in terms of various loss mechanisms of HCN in Titan's upper atmosphere, where it is either directly dissociated by solar EUV radiation, or converted to more complex constituents via its reactions with radicals, e.g., C2H3 and CH (Lavvas et al. 2008; Krasnopolsky 2014). As Titan rotates into darkness, incident solar radiation, along with radicals that are produced by photodissociation of other atmospheric neutrals, disappear, leading to enhanced HCN abundance at the nightside. At the altitudes probed by INMS, the observed diurnal difference is maximized near the lower boundary and weakens with increasing altitude, with the HCN volume mixing ratios at both the dayside and nightside finally merging to a common asymptotic value above 1200 km. Such behavior could also be explained by the dominance of diffusion over photochemistry at high altitudes.
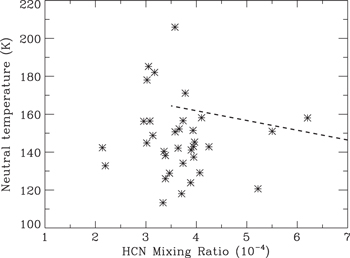
The rotational line emission of HCN is thought to be the most important cooling mechanism in Titan's upper atmosphere (Yelle 1991). As a verification for such a scenario, it would be interesting to examine the relation between the HCN volume mixing ratio and neutral temperature. Values of the neutral temperature, detailed in Table 1 for reference, are obtained from barometric fittings to the inbound N2 density profiles assuming isothermal over the altitude range of interest but incorporating the vertical variation of local gravity (e.g., Westlake et al. 2011). For a robust determination of the temperature, we require that the N2 data cover at least the altitude range continuously from 1250 to 1450 km. Our analysis does not reveal any convincing evidence of anti-correlation as physically expected, with an example demonstrated in Figure 3 in which the mean HCN volume mixing ratio above 1200 km is shown. Since the temperature in the upper atmosphere is the combined effect of heating and cooling (e.g., Yelle 1991; Müller-Wodarg et al. 2000), the absence of anti-correlation in Figure 3 must imply a considerable variability in local heating from flyby to flyby.
Figure 3. HCN volume mixing ratio as a function of neutral temperature in Titan's upper atmosphere. The former refers to the mean value above 1200 km and the latter is obtained from isothermal fitting to the inbound N2 density profile for each flyby. The figure does not reveal any convincing evidence of anti-correlation as physically expected. The dashed line demonstrates the model results of Snowden & Yelle (2014) for comparison.
Download figure:
Standard image High-resolution image
A situation referred to as energy crisis is known to be present in the upper atmospheres of all the four giant planets in the solar system, with the temperatures observed to be 400–1000 K but predicted to be 100–200 K within the framework of the solar-driven scenario (e.g., Seiff et al. 1997; Koskinen et al. 2015). Existing studies of Titan's upper atmosphere have revealed a similar problem, though to a lesser extent. Assuming solar heating alone, the dayside temperature in Titan's upper atmosphere should be higher than the nightside value, but such a feature has not been observed (e.g., de La Haye et al. 2007). The diurnal variation in HCN abundance, which leads to reduced cooling via HCN rotational line emission at the dayside, should in principle enhance the diurnal variation in temperature, making the solar-driven scenario an even worse description of the actual energy budget. Meanwhile, previous INMS analysis works have revealed a temperature variability of at least 60 K at altitudes above 1000 km up to the exobase (Cui et al. 2011; Westlake et al. 2011; Snowden et al. 2013). This is too large to be interpreted by solar heating alone (Snowden & Yelle 2014).
The failure of the solar-driven scenario motivates us to consider alternative energy inputs, especially charged particle precipitation from the ambient plasma (e.g., Arridge et al. 2011). At face value, this scenario is supported by the identification of a correlation between charged particle precipitation and neutral temperature in Titan's upper atmosphere (Westlake et al. 2011). However, such an observation may not be directly interpreted as dominant plasma heating because the typical timescale on which Titan's plasma environment varies is much shorter than the typical heating/cooling timescale for atmospheric neutrals. The calculations made by Snowden & Yelle (2014) have indeed shown that Titan's varying plasma environment contributes to a temperature variability of only 7 K.
The above discussions clearly demonstrate that neither the solar-driven scenario nor the plasma-driven scenario alone is able to account for the observed temperature variability in Titan's upper atmosphere. Energy deposition via wave dissipation has also been considered since wave structures were found to be a common feature of Titan's atmosphere (e.g., Fulchignoni et al. 2005; Müller-Wodarg et al. 2006; Koskinen et al. 2011; Cui et al. 2013, 2014). Whether or not such a wave-driven scenario provides a solution has to be answered with the aid of rigorous model calculations, which are currently absent.
The present study essentially takes into account a fourth scenario that could be referred to as cooling-driven. The model results of Snowden & Yelle (2014) indicate that a decrease in HCN volume mixing ratio from  by 50% in Titan's upper atmosphere leads to an increase in temperature from 145 to 165 K above 1200 km (see the dashed line in Figure 3). The range of the HCN volume mixing ratio obtained here is even larger than this. Accordingly, the impact of the variability in HCN abundance has to be evaluated carefully for a full interpretation of the temperature variability observed in Titan's upper atmosphere. To this end, it would certainly be interesting to explore with a numerical model how temperature differences follow from changes in both the energy inputs and HCN abundances and how these relate to the INMS observations.
J.C. and Y.T.C. acknowledge support from the Strategic Priority Research Program of the Chinese Academy of Sciences through grant XDB09040400, and the National Science Foundation of China (NSFC) through grants 41374178 and 41525015. J.C. is also supported by the Science and Technology Development Fund of Macau SAR (FDCT) through grants 039/2013/A2 and 082/2015/A3. P.P.L. is supported by the French Space Agency (CNES) as a Cassini Participating Scientist and also by the French National Program of Planetology (PNP). T.T.K. is supported by the NASA Cassini Data Analysis and Participating Scientists (CDAPS) Program through grant NNX14AD51G.