


ABSTRACT
The origin and evolution of cosmic magnetic fields as well as the influence of the magnetic fields on the evolution of galaxies are unknown. Though not without challenges, the dynamo theory can explain the large-scale coherent magnetic fields that govern galaxies, but observational evidence for the theory is so far very scarce. Putting together the available data of non-interacting, non-cluster galaxies with known large-scale magnetic fields, we find a tight correlation between the integrated polarized flux density, SPI, and the rotation speed, vrot, of galaxies. This leads to an almost linear correlation between the large-scale magnetic field  and vrot, assuming that the number of cosmic-ray electrons is proportional to the star formation rate, and a super-linear correlation assuming equipartition between magnetic fields and cosmic rays. This correlation cannot be attributed to an active linear α-Ω dynamo, as no correlation holds with global shear or angular speed. It indicates instead a coupling between the large-scale magnetic field and the dynamical mass of the galaxies,
  0.25–0.4. Hence, faster rotating and/or more massive galaxies have stronger large-scale magnetic fields. The observed
  correlation shows that the anisotropic turbulent magnetic field dominates
  in fast rotating galaxies as the turbulent magnetic field, coupled with gas, is enhanced and ordered due to the strong gas compression and/or local shear in these systems. This study supports a stationary condition for the large-scale magnetic field as long as the dynamical mass of galaxies is constant.
Export citation and abstract BibTeX RIS
1. INTRODUCTION
Magnetic fields are present on all scales in the universe from planets and stars to galaxies and galaxy clusters, and even at high redshifts. They are important for the continuation of life on the Earth, the onset of star formation, the order of the interstellar medium, and the evolution of galaxies (Beck & Wielebinski 2013). Hence, understanding the universe without understanding magnetic fields is impossible.
The most widely accepted theory to explain the magnetic fields on stars and planets is the dynamo theory. This describes the process through which a rotating, convecting, and electrically conducting fluid can maintain a magnetic field over astronomical timescales (Steenbeck & Krause 1969). A similar process can also explain the large-scale coherent magnetic fields in galaxies (see Widrow 2002 and references therein). It is assumed that such fields arise from the combined action of helical turbulence and differential rotation, a process known as the α-Ω dynamo. While a number of fundamental questions concerning the nature of the galactic dynamo remain unanswered, so far, no observational evidence for the effect of galaxy rotation on the large-scale magnetic field has been found. This motivated our currently reported investigation of a possible connection between the tracers of the large-scale magnetic field strength and the rotation of galaxies. Finding such a correlation observationally is not necessarily straightforward due to the possible dilution by galaxy-galaxy interactions and environmental effects which influence the rotation curves and possibly the magnetic fields. Such disturbing effects had to be taken into account when selecting the sample.
The present study is based on a careful measurement of the galaxy rotation speed as well as the model-free tracer of the large-scale magnetic field strength and the integrated polarized flux density (SPI). We introduce the sample and the data in Section 2 and describe the vrot measurements in Section 3. We investigate the possible correlations in Section 4 and discuss and summarize the results in Sections 5 and 6, respectively.
2. GALAXY SAMPLE
Not many galaxies are found in the literature with known polarized intensity measurements. Table 1 shows the 4.8 GHz integrated polarized intensity measurements for a sample of nearby galaxies, including Local Group galaxies and barred galaxies from Beck et al. (2002). To minimize environmental effects, we excluded galaxies in the Virgo and Ursa Major clusters and those known to be in interacting systems. Measurements with poor signal-to-noise ratio (≤1) were also omitted. We included the Local Group dwarf galaxies from Chyży et al. (2011), as they also show large-scale coherent magnetic fields. Galaxies that fit our selection limits, i.e., with known large-scale magnetic fields and minimum environmental disturbances are listed in Table 1. Each galaxy was observed in polarized light at a linear resolution d smaller than the galaxy optical size (in the sample, d < 0.25 × R25, with R25 as the optical radius). Thus, the large-scale magnetic field with a coherent length l (≃half a galaxy size; e.g., Fletcher 2010) is resolved in all galaxies and the beamwidth depolarization is small (∼d2/l2 ≤ 6% in the sample).
Table 1. Properties of the Galaxy Sample
| Galaxy | Hubble | Inclination | Distance | SI | SPI | vrot | Rmin | Rmax | SFR | R25 |
|---|---|---|---|---|---|---|---|---|---|---|
| Name | Type | (°) | (Mpc) | (mJy) | (mJy) | (km s−1) | (kpc) | (kpc) | (M☉ yr−1) | (kpc) |
| IC 342 | SABcd | 25 | 3.1 | 108 ± 91 | 14 ± 21 | 193 ± 24S | 5 | 18 | 0.59 | 11.87 |
| NGC 6946 | SABcd | 30 | 6.8 | 270 ± 552 | 30 ± 1.12 | 220 ± 24S | 6 | 14 | 1.15 | 9.18 |
| NGC 253 | SABc | 78 | 3.94 | 420 ± 254 | 12.4 ± 1.54 | 211 ± 12S | 2 | 9 | 4.94 | 13.77 |
| NGC 3628 | SAb pec | 86 | 6.7 | 111 ± 205 | 4.4 ± 0.45 | 215 ± 15S | 2 | 12 | 0.6 | 18.34 |
| NGC 4565 | SAb | 86 | 13.1 | 88 ± 105 | 10.6 ± 2.55 | 255 ± 12S | 5 | 25 | 0.36 | 62.61 |
| NGC 4736 | SABab | 35 | 4.7 | 27 ± 66 | 2.16 ± 0.506 | 178 ± 16S | 3 | 7 | 0.37 | 7.91 |
| NGC 5907 | Sc | 88 | 16.4 | 90 ± 77 | 4.5 ± 0.77 | 254 ± 14S | 5 | 22 | 0.77 | 28.14 |
| NGC 891 | SAb | 88 | 8.4 | 264 ± 455 | 5.3 ± 0.75 | 225 ± 10S | 4 | 14 | 0.31 | 18.48 |
| NGC 1097 | SBbc | 40 | 16 | 359 ± 303 | 30.5 ± 4.43 | 295 ± 24S | 5 | 27 | 4.13 | 22.35 |
| NGC 1365 | SBb | 46 | 19 | 744 ± 473 | 17.9 ± 0.93 | 235 ± 15S | 15 | 25 | 7 | 35.01 |
| NGC 3359 | SBc | 51 | 11 | 28 ± 23 | 1.4 ± 0.83 | 149 ± 6BA | 11 | 20 | 0.25 | 20.65 |
| NGC 1493 | SBc | 27 | 12 | 4 ± 13 | 0.24 ± 0.163 | 102 ± 12W | ⋯ | ⋯ | 0.14 | 6.54 |
| NGC 1559 | SBc | 57 | 15 | 232 ± 133 | 9.1 ± 1.13 | 145 ± 9W | ⋯ | ⋯ | 2.1 | 8.22 |
| NGC 1672 | SBb | 39 | 15 | 250 ± 143 | 9.5 ± 2.33 | 200 ± 15W | ⋯ | ⋯ | 1.2 | 16.02 |
| NGC 3059 | SBc | 27 | 14 | 57 ± 43 | 3.99 ± 0.633 | 129 ± 16W | ⋯ | ⋯ | 0.7 | 7.73 |
| NGC 5643 | SBc | 23 | 14 | 129 ± 83 | 2.6 ± 1.33 | 209 ± 27W | ⋯ | ⋯ | 2.2 | 9.58 |
| NGC 7552 | SBbc | 28 | 21 | 546 ± 873 | 10.9 ± 3.23 | 224 ± 29W | ⋯ | ⋯ | 9.2 | 11.08 |
| NGC 1300 | SBb | 35 | 20 | 44 ± 83 | 3.96 ± 1.583 | 221 ± 20W | ⋯ | ⋯ | 2.8 | 18.56 |
| NGC 7479 | SBbc | 45 | 34 | 379 ± 463 | 24.6 ± 6.43 | 237 ± 18W | ⋯ | ⋯ | 0.9 | 19.94 |
| M 31 | SAb | 77 | 0.69 | 9 ± 18 | 1.9 ± 0.38 | 229 ± 12C | 16 | 34 | 0.6 | 21.06 |
| M 33 | SAcd | 54 | 0.84 | 9.06 ± 0.959 | 0.53 ± 0.19 | 120 ± 10CS | ⋯ | ⋯ | 0.30 | 8.49 |
| LMC | Irr/SBm | 33 | 0.050 | 7.6 ± 1.510 | 0.16 ± 0.0310 | 69 ± 7A | 2.5 | 13 | 0.26 | 4.70 |
| SMC | Irr | 40 | 0.060 | 0.9 ± 0.211 | 0.029 ± 0.00611 | 59 ± 4.5B | ⋯ | ⋯ | 0.046 | 2.75 |
| IC 10 | Irr | 40 | 0.66 | 0.88 ± 0.1512 | 0.020 ± 0.00212 | 47 ± 5M | 2.68 | 3.40 | 0.06 | 0.60 |
| NGC 6822 | Irr | 67 | 0.50 | 0.37 ± 0.0712 | 0.013 ± 0.00512 | 51 ± 4M | ⋯ | ⋯ | 0.02 | 1.13 |
| IC 1613 | Irr | 35 | 0.73 | 0.07 ± 0.0112 | 0.0005 ± 0.000212 | 37 ± 5M | ⋯ | ⋯ | 0.003 | 1.72 |
Note. The integrated flux densities SI and SPI were measured at 4.8 GHz and projected to a distance of 10 Mpc. The Hubble type and distance are taken from the NASA Extragalactic Database, 1—Graeve & Beck (1988), 2—Beck & Hoernes (1996), 3—Beck et al. (2002) 4—Heesen et al. (2009), 5—Dumke & Krause (1998), 6—Chyży & Buta (2008), 7—Dumke et al. (2000), 8—Berkhuijsen et al. (2003), 9—Tabatabaei et al. (2007, 2008), 10—Dickel et al. (2005), 11—Dickel et al. (2010), 12—Chyży et al. (2011), A—Alves & Nelson (2000), B—Bekki & Stanimirović (2009), BA—Ball (1983), C—Carignan et al. (2006), CS—Corbelli & Salucci (2000), M—Mateo (1998), S—Sofue et al. (1999), W—Koribalski et al. (2004). The inclinations were taken from the vrot references.
Download table as: ASCIITypeset image
3. GALAXY ROTATION SPEEDS
The adopted rotation speed vrot of the sample galaxies was derived in one of three ways, namely, by (I) averaging the rotation speed over the flat part of the rotation curves, (II) using the corrected W20 measurements of HIPASS data, or (III) taking values directly from the literature.
In case I, 10 galaxies had rotation curves derived by Sofue et al. (1999)6 ; these are indicated with "S" in Table 1. The measurements in the "flat part" of the rotation curve were averaged to calculate vrot (see the radial range for individual galaxies in Table 1). The errors were estimated assuming 10 km s−1 measurement errors (Sofue et al. 1997) and 3° errors on the inclination. Five galaxies (with reference indicators "A," "B," "BA," "C," and "CS") were taken from other papers (see references in Table 1). For the SMC, vrot was derived by a weighted average in the flat part of the rotation curve presented in Bekki & Stanimirović (2009), assuming uncertainties of 6 km s−1 in velocity and 5° in inclination. For NGC 3359, in a similar way, we read the 13 outer data points of the rotation curve in Figure 11 of Ball (1983), excluding the outermost point. For the remaining three galaxies, vrot was calculated in the same way, but with measurements and errors given in their reference papers.
In case II, we derived vrot from HI W20 measurements for eight galaxies (indicated by "W" in Table 1). The W20 measurements were taken from Koribalski et al. (2004) and have been corrected for instrumental effects, internal turbulent motion, and inclination following Martinsson et al. (2016), assuming a gas velocity dispersion σHI = 10 km s−1 and using the HIPASS spectral resolution of 18 km s−1. The measurement errors on W20 were estimated to be three times the error on the systemic velocity as suggested by Koribalski et al. (2004), and the error on inclination was assumed to be three degrees for all galaxies.
For three galaxies, vrot is taken from the literature (Mateo 1998, with superscript "M" in Table 1), only correcting for the inclination (case III).
4. A TIGHT CORRELATION
The polarized intensity (PI) provides a measure of the large-scale magnetic field in galaxies. It is defined through the integral over the path length L in the emitting medium

with ncr the cosmic-ray electron number density,  the large-scale transverse magnetic field strength averaged over the line of sight, and K a dimensional constant (Beck et al. 2003). The above definition is similar to that of the total intensity of the radio continuum emission,

with B the total transverse magnetic field strength that includes both the large-scale uniform field and the local turbulent field,  , where
  is the turbulent magnetic field strength. Observationally, the total intensity I is just a measure of the Stokes I parameter, while the linearly polarized intensity PI is a measure of the Stokes Q and U parameters,

The integrated flux densities of the total intensity SI and linearly polarized intensity SPI (in units of Jansky) are obtained by integrating the I and PI maps (in Jansky/beam) over the area A,


For the selected sample of 26 galaxies, we collected SI and SPI at 4.8 GHz from the literature. Table 1 shows those fluxes, projected to a common distance of 10 Mpc. Plotting SPI versus vrot, we find a tight correlation (Figure 1). The Pearson correlation coefficient is rp = 0.94 ± 0.04, and the Spearman rank coefficient is rsp = 0.8 ± 0.0. The correlation is even tighter than that between SI and vrot with a rank rsp = 0.7 ± 0.0 (same figure). A linear fit in logarithmic plane leads to a slope of 4.6 ± 0.3, slightly steeper than that found between SI and vrot (4.0 ± 0.3). The ratio of the integrated polarized to total flux density, SPI/SI, is not constant and increases with vrot with a least squares fit slope of 0.6 ± 0.2 and a bisector fit slope of 1.2 ± 0.3.

Figure 1. Top: integrated total (top, blue squares) and polarized flux densities (bottom, black dots) projected at a distance of 10 Mpc vs. the rotation speed of galaxies, vrot. Bottom: fractional polarization SPI/SI against vrot. The lines show the least squares fits (solid) and their 2σ scatter (dotted). In the bottom panel, the dashed line shows the bisector fit and open symbols indicate NGC 7552, NGC 1365, and NGC 5643 (Section 5.1).
Download figure:
Standard image High-resolution image5. DISCUSSION
Taking into account the well-known correlation between the total star formation rate (SFR) and radio luminosity of galaxies (Condon 1992) and the correlation between SFR and stellar mass (e.g., Sparre et al. 2015) that scales with vrot according to the Tully–Fisher relation (Tully & Fisher 1977), are the observed correlations  and
and  (Figure 1) merely secondary correlations that represent a more direct relation between SFR and vrot? We estimated SFR by combining the GALEX far-UV (FUV; Lee 2011; Cortese et al. 2012) and the IRAS 25 μm fluxes (Abrahamyan et al. 2015) and following the calibration relation given by Hao et al. (2011) and Kennicutt et al. (2009):
In a few cases with no GALEX data, only the IR data were used to estimate the SFR following Kennicutt & Evans (2012):
Table 1 lists the SFR values obtained. We address the question raised by comparing the correlations of SI and SPI with SFR and vrot. We found that SFR is indeed correlated with vrot with rsp = 0.67, similar to the  correlation (rsp = 0.72), indicating that the SFR could be the main cause of the observed
  correlation. This is shown better by a tighter correlation of SI with SFR (rsp ∼ 0.9) than vrot (rsp ∼ 0.7; Figure 2).
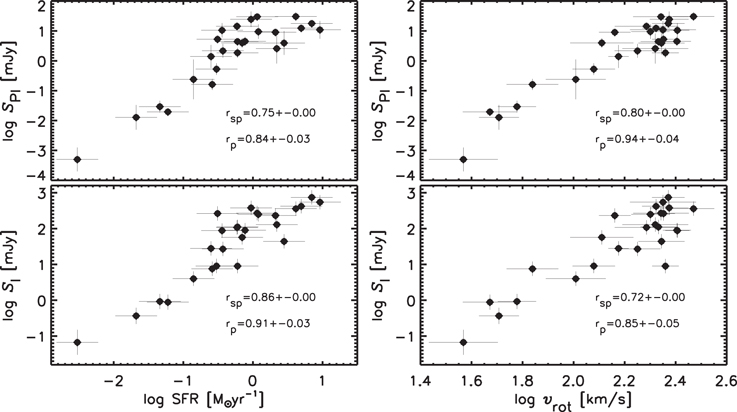
Figure 2. Integrated polarized (SPI, top) and total flux densities (SI, bottom) against SFR (left panels). The horizontal error bars show a 25% uncertainty. Shown for comparison are SPI and SI against vrot (right panels).
Download figure:
Standard image High-resolution imageThe  correlation is, however, not as tight as the
  correlation (rsp = 0.80). Hence, the correlation between SFR and SPI (Figure 2) may not fully explain the tighter
  correlation. A correlation is expected between the integrated polarized flux density SPI and SFR due to cosmic rays as their number Ncr increases with star formation activity (e.g., Murphy et al. 2008). Otherwise, no correlation is expected between the large-scale field
  (traced by PI) and SFR, while the turbulent (and total) magnetic field positively correlates with SFR (Tabatabaei et al. 2013a, 2013b). This could also explain that the
  correlation is tighter than the
  correlation (Figure 2). We note that SFR is not a directly measured quantity. Potential systematic effects in calibration, like a dependence of the calibration factors on the galaxy properties, could increase uncertainties in SFR.
5.1. The Large-scale Magnetic Field
Equation (4) can be written as  , with V as the integration volume. The ratio
  is a measure of the energy of the large-scale magnetic field, E(
 )=
)= . Studying the corresponding energy density and the large-scale magnetic field strength is then possible via
  with
with  . The SFR can be taken as a proxy for Ncr (Section 5), and hence
  . Figure 3 (top) shows that SPI/SFR is correlated with
  with rp = 0.8 ± 0.1 and rsp = 0.7 ± 0.0. Thus,
  or
or  , the large-scale ordered field, is linearly proportional to the rotation speed of the galaxies.

Figure 3. Top: ratio of the integrated polarized flux density to the SFR vs. the rotation speed. Middle: ratio of the integrated polarized flux density to the SFR0.5 vs. the rotation speed. Open symbols indicate NGC 7552, NGC 1365, and NGC 5643 (see the text). Bottom: ratio of the integrated polarized flux density to the SFR vs. the angular speed.
Download figure:
Standard image High-resolution imageThe relation between Ncr and SFR differs if an equipartition between the energy densities of the cosmic-ray electrons and the total magnetic field holds. The global equipartition condition leads to Ncr ∼ B2, with B the mean total magnetic field strength in each galaxy. Independent observations show a global correlation between B and SFR in galaxies, B ∼ SFR0.25–0.3 (Chyży et al. 2011; Heesen et al. 2014). Thus, Ncr changes with SFR as Ncr ∼ SFR0.5–0.6. It then follows that  (0.5–0.6), which is correlated to
  with rp = 0.9 ± 0.1 (Figure 3, middle). Hence, a super-linear correlation holds between
  and vrot:
  .
.
We note that the scatter at the high-vrot end in Figure 3 (top) is due to the galaxies with the highest SFR, NGC 7552 and NGC 1365, as well as the Seyfert galaxy NGC 5643. The large turbulence due to high SF and active galactic nucleus activities in these galaxies could enhance the generation of turbulent fields by the small-scale dynamo. It could also cause depolarization due to internal Faraday dispersion (Sokoloff et al. 1998) reducing the observed PI and SPI and shifting the SPI/SFR ratio to relatively low values.
5.2. Tracing the Dynamo Effect
Could the observed  correlations be due to an active dynamo process? Following the linear mean-field α-Ω dynamo theory, the large-scale field is set by the shear, S = rdΩ/dr, with r as the galactocentric radius and Ω the angular speed. For a flat rotation curve, the shear is given by S = −vrot/r = −Ω. Thus, theoretically,
  can be expected to grow proportionally with Ω, and hence the dynamo's appropriate parameter is the angular speed and not the linear speed. However, we did not find any correlation between SPI/SFR and Ω = vrot/R257
(see Figure 3, bottom).
can be expected to grow proportionally with Ω, and hence the dynamo's appropriate parameter is the angular speed and not the linear speed. However, we did not find any correlation between SPI/SFR and Ω = vrot/R257
(see Figure 3, bottom).
A correlation between  and Ω is not expected theoretically if dynamo quenching and saturation take place (Van Eck et al. 2015). This saturation occurs when the large-scale magnetic field and turbulent energy densities are similar in the interstellar medium, or because of a balance between Coriolis and Lorentz forces, or due to magnetic helicity (see Widrow 2002; Van Eck et al. 2015 and references therein). In this case, the galactic large-scale dynamos are normally in a nonlinear, statistically steady state. As both the quenching and growth of
  increase with Ω (Chamandy et al. 2014), a correlation between
  and Ω is not trivial in the nonlinear mean-field dynamo models. Hence,
  is not expected to be correlated with either vrot or Ω in these models.
The large-scale magnetic field as traced by the polarized emission could be actually dominated by an anisotropic turbulent field that differs from the field regulated by the dynamo process theoretically. The turbulent magnetic field could become anisotropic and apparently large-scale due to compression and/or local shear by gas streaming velocities (e.g., Laing 2002). Strong anisotropic fields in galaxies were found, e.g., in M51 (Fletcher et al. 2011) and in IC 342 (Beck 2015). Hence, the  correlation could show that the anisotropic turbulent field dominates in faster rotating galaxies due to higher gas streaming velocities.
On the other hand, the  correlation could be caused by larger
  values in galaxies with higher dynamical mass. The dynamical mass inside the optical radius is given by
  , with G as the gravitational constant. We found that SPI/SFR (
 ) increases with Mdyn with a slope of 0.5 ± 0.1,
  (rsp = 0.68 ± 0.00). Assuming equipartition, it follows that
  .
.
Earlier attempts to establish a correlation between  and the dynamics of galaxies met not much success, although some theoretical works went as far as suggesting an effect of
  on rotation curves of galaxies (Battaner & Florido 2007). Van Eck et al. (2015) collected the mean magnetic fields for a sample of 20 nearby galaxies. They, however, found no correlation between
  and vrot. This, as noted by Van Eck et al. (2015), could be due to (1) using inconsistent methods/assumptions per galaxy each referring to a different
  component and (2) inhomogeneous galaxy sample including both interacting and isolated galaxies. We avoided these caveats by using a consistent method for all sources in our sample of the non-interacting/non-cluster galaxies.
5.3. Magnetic Energy versus Rotational Energy
The total energy of the large-scale magnetic field scales with SPI/ncr or SPI V/Ncr (Section 1). Assuming Ncr ∼ SFR, the magnetic energy is

while assuming equipartition leads to

To estimate  using Equations (6) and (7), the synchrotron radiating volume V is taken to be the volume of the thick disk with the radius of R25 and scale height of 1 kpc, corrected for inclination. The case of equipartition (Equation (7)) even allows calibration of
  in erg through
with  ,
,  , and SFR0 as the corresponding parameters of a reference galaxy. We took a galaxy residing between the dwarfs and normal spirals, i.e., M33 (
 G; Tabatabaei et al. 2008), as the reference galaxy in the sample.
The vrot data allow estimation of the rotational energy of the galaxies,  , with
  the moment of inertia. For disks,
  leading to
  .
.
Figure 4 shows the energy of the large-scale magnetic field  against the rotational energy of the galaxies Erot. The slope of the
  correlation in logarithmic scale is 1.03 ± 0.10 (rp = 0.91 ± 0.08) for Ncr ∼ SFR, and 1.25 ± 0.08 (rp = 0.96 ± 0.06) assuming equipartition (the magnetic-to-rotation energy changes as
  with a median value of 0.002). Therefore, the two different assumptions on Ncr do not lead to a significant difference in the
  relation. These correlations show that galaxies with higher rotational energy have a higher energy of the large-scale magnetic field. Considering that the rotational energy is balanced with the gravitational energy and is constant particularly for non-interacting galaxies, these relations show that the large-scale magnetic field is almost stationary at the current epoch in each galaxy (this does not reject a possibly linear dynamo process in the past). This supports the theoretical predictions that the present-day large-scale dynamos cannot be in their linear (growing) phase.

Figure 4. Energy of the large-scale magnetic field E( ) vs. the rotational energy E(rot) in erg assuming equipartition (dots). Squares show E(
 ) in arbitrary units vs. E(rot) assuming Ncr ∼ SFR. The lines show the ordinary least squares fits (solid) and their 5 σ scatter (dotted). The error bars indicate a 50% uncertainty.
Download figure:
Standard image High-resolution image
Considering active star formation as the main source of the turbulence, the  correlation implies that the turbulent energy does not change much, as long as the galaxy mass is fixed. Several studies show an equipartition between the turbulent and the total magnetic field energy densities (e.g., Beck 2007, 2015; Tabatabaei et al. 2008) indicating that the total magnetic field also does not evolve further.
6. SUMMARY
To study the relations between galactic magnetic fields and rotation, we selected from the literature observations of the large-scale magnetic field of galaxies that are not in clusters and are not interacting. These show a tight correlation between the polarized flux density and the rotation speed vrot over three orders of magnitude in dynamical mass. Assuming Ncr ∼ SFR, a linear correlation is found between the large-scale magnetic field strength  and vrot. This correlation is super-linear (
 ) assuming equipartition between the cosmic-ray electrons and the total magnetic field. On the other hand, no correlation is found between
  and Ω, expected from the linear α-Ω dynamo theory. The
  correlation suggests that there is a coupling between the large-scale magnetic field and the dynamical mass of galaxies:
  . Therefore, faster rotating/more massive galaxies have stronger magnetic fields than slower rotating/less massive galaxies. The
  correlation shows that the anisotropic turbulent field dominates the large-scale field in faster rotating galaxies, perhaps due to high streaming velocities of the gas with which the magnetic field is coupled.
A comparison between the magnetic and rotational energies shows that the large-scale magnetic field is stationary and does not evolve further in galaxies with fixed dynamical mass.
This is the first study showing a statistically meaningful effect of the galaxy rotation/mass on the large-scale magnetic fields.
We thank the anonymous referee for valuable comments. We also thank Anvar Shukurov and Andrew Fletcher for stimulating discussions and to John Dickel for providing us with the LMC and SMC data. F.S.T., T.P.K.M., and J.H.K. acknowledge financial support from the Spanish Ministry of Economy and Competitiveness (MINECO) under grant number AYA2013-41243-P. J.H.K. and J.E.B. acknowledge financial support to the DAGAL network from the People Programme (Marie Curie Actions) of the European Unions Seventh Framework Programme FP7/2007-2013/under REA grant agreement number PITN-GA-2011-289313.
Footnotes
- 6
- 7
Averaging the actual shear in the flat part of the rotation curves results in r ∼ R25.