


ABSTRACT
In a Λ cold dark matter (ΛCDM) cosmology, the baryonic Tully–Fisher relation (BTFR) is expected to show significant intrinsic scatter resulting from the mass–concentration relation of dark matter halos and the baryonic-to-halo mass ratio. We study the BTFR using a sample of 118 disk galaxies (spirals and irregulars) with data of the highest quality: extended  rotation curves (tracing the outer velocity) and Spitzer photometry at 3.6 μm (tracing the stellar mass). Assuming that the stellar mass-to-light ratio (
 ) is nearly constant at 3.6 μm, we find that the scatter, slope, and normalization of the BTFR systematically vary with the adopted
  . The observed scatter is minimized for
 , corresponding to nearly maximal disks in high-surface-brightness galaxies and BTFR slopes close to ∼4. For any reasonable value of
  , the intrinsic scatter is ∼0.1 dex, below general ΛCDM expectations. The residuals show no correlations with galaxy structural parameters (radius or surface brightness), contrary to the predictions from some semi-analytic models of galaxy formation. These are fundamental issues for ΛCDM cosmology.
Export citation and abstract BibTeX RIS
1. INTRODUCTION
The baryonic Tully–Fisher relation (BTFR) links the rotation velocity of a galaxy to its total baryonic mass (Mb) and extends for six decades in Mb (McGaugh 2012). In a Λ cold dark matter (ΛCDM) cosmology, the BTFR must emerge from the complex process of galaxy formation, hence it is expected to show significant intrinsic scatter. Using a semi-analytic galaxy-formation model, Dutton (2012) predicts a minimum intrinsic scatter of ∼0.15 dex along the BTFR (see also Di Cintio & Lelli 2016). The majority of this scatter comes from the mass–concentration relation of dark matter (DM) halos, which is largely independent of baryonic processes and well-constrained by cosmological DM-only simulations (Bullock et al. 2001). Hence the BTFR scatter provides a key test for ΛCDM.
The BTFR has been extensively studied using  observations from radio interferometers (e.g., Verheijen 2001; Noordermeer & Verheijen 2007) and single-dish telescopes (e.g., Gurovich et al. 2010; Zaritsky et al. 2014). Radio interferometers can spatially resolve the
  kinematics in nearby galaxies, providing high-quality rotation curves (RCs). Despite being limited to small galaxy samples, the study of RCs has provided key insights into the BTFR. Primarily, the BTFR scatter is minimized using the velocity along the flat part (Vf), which extends well beyond the optical galaxy (Verheijen 2001; Noordermeer & Verheijen 2007). Presumably, Vf is set by the DM halo and closely relates to its virial velocity.
Single-dish  surveys provide large samples for BTFR studies (thousands of objects), which are most useful to estimate galaxy distances and investigate local flows (Tully et al. 2013). When interpreted in a galaxy formation context, however, they are prone to systematic effects because rotation velocities from
  line widths do not necessarily correspond to Vf (Verheijen 2001). Studies using
  line widths generally report shallower BTFR slopes (∼3) than those using Vf (∼4), leading to drastically different interpretations (Gurovich et al. 2010; McGaugh 2012). Studies based on Hα (Pizagno et al. 2007) or CO (Ho 2007) observations may present similar issues, since Hα and CO disks are typically less extended than
  disks and their maximum velocities may not be tracing Vf.
In this Letter, we investigate the BTFR using a sample of 118 galaxies with data of the highest quality: (i) extended  RCs providing precise measurements of Vf, and (ii) Spitzer surface photometry at 3.6 μm providing the optimal tracer of the stellar mass.
2. DATA ANALYSIS
2.1. Galaxy Sample
This work is based on the Spitzer Photometry and Accurate Rotation Curves (SPARC) data set, which will be presented in detail in F. Lelli et al. (2016, in preparation). In short, we collected more than 200 high-quality  RCs of disk galaxies from previous compilations, large surveys, and individual studies. The major sources are Swaters et al. (2009, 52 objects), Sanders & Verheijen (1998, 30 objects), de Blok & McGaugh (1997, 24 objects), Sanders (1996, 22 objects), and Noordermeer et al. (2007, 17 objects). The RCs were derived using similar techniques: fitting a tilted ring model to the
  velocity field (Begeman 1987) and/or using position–velocity diagrams along the disk major axis (de Blok & McGaugh 1997).
Subsequently, we searched the Spitzer archive for 3.6 μm images of these galaxies. We found 173 objects with useful [3.6] data. We derived surface brightness profiles and asymptotic magnitudes using the Archangel software (Schombert 2011), following the same procedures as Schombert & McGaugh (2014). The surface brightness profiles will be presented elsewhere; here we simply use asymptotic magnitudes at [3.6] to estimate stellar masses (M*).
For the sake of this study, we exclude starburst dwarf galaxies (eight objects from Lelli et al. 2014a and Holmberg II from Swaters et al. 2009) because they have complex  kinematics and are likely involved in recent interactions (Lelli et al. 2014b). This reduces our starting sample to 164 objects.
2.2. Rotation Velocity
Empirically, the velocity along the flat part of the RC minimizes the scatter in the BTFR (Verheijen 2001). The choice of velocities at some photometric radius, like 2.2 Rd (the disk scale length; Dutton et al. 2007) or R80 (the radius encompassing 80% of the i-band light; Pizagno et al. 2007), lead to relations with larger scatter. This can be simply understood. For some low-mass, gas-dominated galaxies, these radii may occur along the rising part of the RC (Swaters et al. 2009). For high-mass, bulge-dominated galaxies, they may occur along the declining part of the RCs (Noordermeer & Verheijen 2007). These photometric radii do not necessarily imply a consistent measurement of the rotation velocity due to the different distribution of baryons within galaxies. Conversely, Vf appears insensitive to the detailed baryonic distribution, being measured at large enough radii to encompass the bulk of the baryonic mass. Vf represents our best proxy for the halo virial velocity.
We estimate Vf using a simple automated algorithm. We start by calculating the mean of the two outermost points of the RC:

and require that

If the condition is fulfilled, the algorithm includes  in the estimate of
  and iterates to the next velocity point. When the condition is falsified, the algorithm returns
  . This algorithm returns similar values of Vf as previously employed techniques based on the logarithmic slope
  (Stark et al. 2009), but is more stable against small radial variations in the RC. Galaxies that do not satisfy the condition at the first iteration are rejected, hence we only consider RCs that are flat within ∼5% over at least three velocity points. This excludes 36 galaxies with rising RCs (∼20%), reducing the sample to 129 objects.
The error on Vf is estimated as

where (i)  is the random error on each velocity point along the flat part of the RC, quantifying non-circular motions and kinematic asymmetries between the two sides of the disk; (ii)
  is the dispersion around
  , quantifying the degree of flatness of the RC; and (iii) δi is the error on the outer disk inclination i. High-quality
  velocity fields can be used to obtain kinematic estimates of i and trace possible warps (e.g., Battaglia et al. 2006). This is another advantage of interferometric surveys over single-dish ones, since the latter must rely on photometric inclinations that depend on the assumed stellar-disk thickness and may be inappropriate for warped
  disks. Inclination corrections become very large for face-on disks due to the
  dependence, hence we exclude galaxies with i < 30°, reducing the sample to 118 galaxies. Clearly, this does not introduce any selection effects since galaxy disks are randomly oriented across the sky, but decreases the mean error on Vf to ∼0.03 dex.
2.3. Baryonic Mass
We estimate the baryonic mass as

where Mg is the gas mass, L[3.6] is the [3.6] luminosity (adopting a solar magnitude of 3.24, Oh et al. 2008), and  is the stellar mass-to-light ratio. Several studies suggest that
  is almost constant in the near-infrared ([3.6] or K-band) over a range of galaxy types and masses. A small scatter of ∼0.1 dex is consistently found using different approaches: stellar population synthesis models (McGaugh & Schombert 2014; Meidt et al. 2014), resolved stellar populations (Eskew et al. 2012), and the vertical velocity dispersion of galaxy disks (Martinsson et al. 2013). Large inconsistencies persist in the overall normalization (McGaugh & Schombert 2015). In this Letter, we assume that
  is constant among galaxies and systematically explore the BTFR for different
  .
.
In disk galaxies Mg is typically dominated by atomic gas (probed by  observations). The molecular gas content can be estimated from CO observations assuming a CO-to-H2 conversion factor, which can vary from galaxy to galaxy depending on metallicity or other properties. CO emission is often undetected in low-mass, metal-poor galaxies (Schruba et al. 2012). Luckily, molecules generally are a minor dynamical component, contributing less than 10% to Mb (McGaugh & Schombert 2015). Similarly, warm/hot gas is negligible in the disk (McGaugh 2012). Hence we assume
  , where the factor 1.33 takes the contribution of helium into account. We note that any contribution from "dark gas" (molecular and/or ionized) is implicitly included in
  as long as this scales with M*.
The error on Mb is estimated as

where  and δL are, respectively, the errors on Mg and L[3.6] due to uncertainties on total fluxes (generally smaller than ∼10%). We assume
  dex, as suggested by stellar population models (McGaugh & Schombert 2014; Meidt et al. 2014). Galaxy distances (D) and corresponding errors (δD) deserve special attention. The 118 galaxies with accurate values of Vf have three different types of distance estimates (in order of preference):
- 1.Thirty-two objects have accurate distances from the tip of the red giant branch (26), Cepheids (3), or supernovae (3). These are generally on the same zero-point scale and have errors ranging from ∼5% to ∼10% (see Tully et al. 2013). The majority of these distances (24/32) are drawn from the Extragalactic Distance Database (Jacobs et al. 2009).
- 2.Twenty-six objects are in the Ursa Major cluster, which has an average distance of 18 ± 0.9 Mpc (Sorce et al. 2013). For individual galaxies, one should also consider the cluster depth (∼2.3 Mpc, Verheijen 2001), hence we adopt
 Mpc, giving an error of ∼14%. We consider two galaxies from Verheijen (2001) as background/foreground objects: NGC 3992, having D ≃ 24 Mpc from a SN Ia (Parodi et al. 2000), and UGC 6446, lying near the cluster boundary in both space and velocity (D ≃ 12 Mpc from the Hubble flow).
 - 3.Sixty objects have Hubble-flow distances corrected for Virgocentric infall (as given by NED3 assuming km s−1 Mpc−1). These are very uncertain for nearby galaxies where peculiar velocities may constitute a large fraction of the systemic velocities, but become more accurate for distant objects. Considering that peculiar velocities may be as high as ∼500 km s−1 and H0 has an uncertainty of ∼7%, we adopt the following errors: 30% for D ≤ 20 Mpc; 25% for Mpc; 20% for Mpc; 15% for Mpc; and 10% for Mpc. The most distant galaxy in our sample is NGC 6195 at D ≃ 130 Mpc.


We perform separate analyses for the total sample (mean  dex) and for galaxies with accurate distances (58 objects in groups 1 and 2; mean
  dex).
dex).
3. RESULTS
We systematically explore the BTFR for different values of  ranging from 0.1 to 1.0
  in steps of 0.05. Values higher than 1 are ruled out by maximum-disk models of high-surface-brightness (HSB) galaxies (F. Lelli et al. 2016, in preparation). For each
  , we fit a straight line:

We use the LTS_LINEFIT algorithm (Cappellari et al. 2013), which performs a least-square minimization considering errors in both variables and allowing for intrinsic scatter. Figure 1 shows the observed scatter ( ), intrinsic scatter (
 ), slope (s), and normalization (A) as a function of
  .
.

Figure 1. Properties of the BTFR as a function of  : observed scatter (top left), intrinsic scatter (top right), slope (bottom left), and normalization (bottom right). Dashed and solid lines show results for the total and accurate-distance samples, respectively.
Download figure:
Standard image High-resolution image3.1. Observed and Intrinsic Scatter
Figure 1 (top left) shows that  decreases with
  and reaches a plateau at
  . This plateau actually is a broad minimum that becomes evident by extending the
  range up to unphysical values of ∼10
  (not shown). The observed scatter is systematically lower for the accurate-distance sample, indicating that a large portion of
  in the full sample is driven by distance uncertainties.
Figure 1 (top right) shows that σint is below 0.15 dex for any realistic value of  . The similar intrinsic scatter between the two samples suggests that our errors on Hubble-flow distances are realistic. For a fiducial value of
 , we find
  for the full sample and
  for the accurate-distance sample. As we discuss in Section 4, this represents a challenge for the ΛCDM cosmological model.
3.2. Slope, Normalization, and Residuals
Figure 1 (bottom panels) shows that the BTFR slope (normalization) monotonically increases (decreases) with  . This is due to the systematic variation of the gas fraction (
 ) with
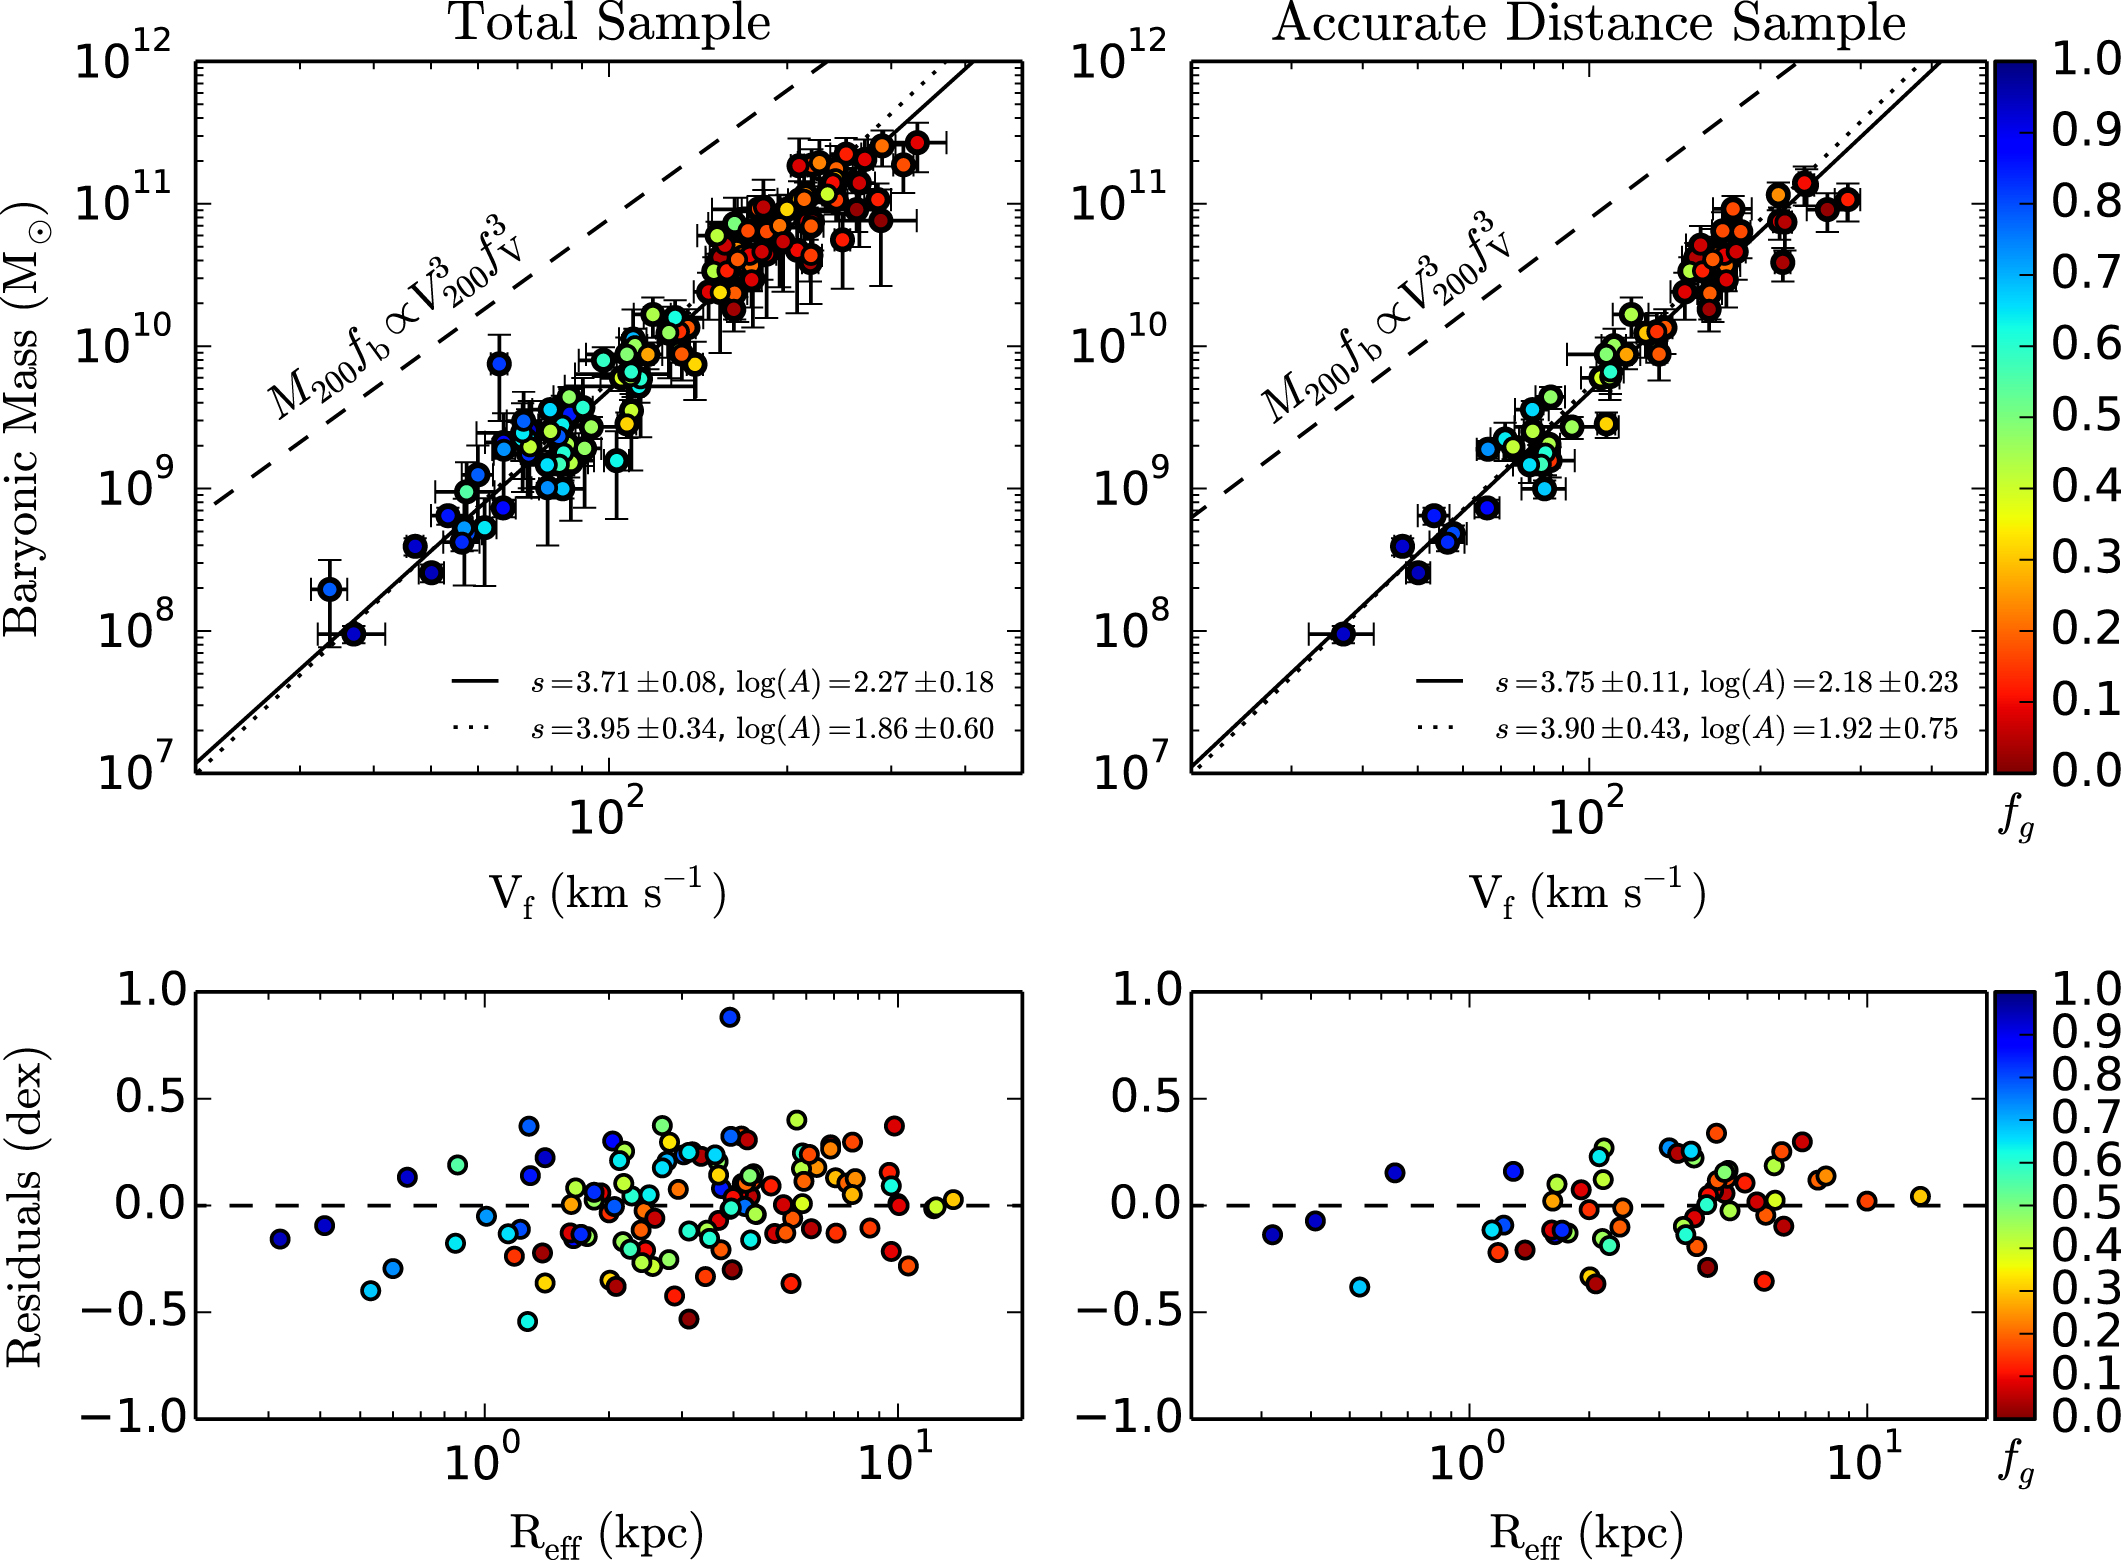
  . Figure 2 (top panels) shows the BTFR for
 , color-coding each galaxy by fg. Low-mass galaxies tend to be gas-dominated (fg ≳ 0.5) and their location on the BTFR does not strongly depend on the assumed
  (Stark et al. 2009; McGaugh 2012). Conversely, high-mass galaxies are star-dominated and their location on the BTFR strongly depends on
  . By decreasing
  ,
,  decreases more significantly for high-mass galaxies than for low-mass ones, hence the slope decreases and the normalization increases.

Figure 2. Top panels: BTFR adopting 
 . Galaxies are color-coded by
  . Solid lines show error-weighted fits. Dotted lines show fits weighted by
  , increasing the importance of gas-dominated galaxies. The dashed line shows the ΛCDM initial condition with fV = 1 and fb = 0.17 (the cosmic value). Bottom panels: residuals from the error-weighted fits vs. the galaxy effective radius. The outlier is UGC 7125, which has an unusually high correction for Virgocentric infall and lies near the region where the infall solution is triple-valued. If we consider only the correction for Local Group motion, UGC 7125 lies on the BTFR within the scatter. The data for this figure are available.
Download figure:
Standard image High-resolution imageFor any  , we find no correlation between BTFR residuals and galaxy effective radius: the Pearson's, Spearman's, and Kendall's coefficients are consistently between ± 0.4. Figure 2 (bottom panels) shows the case of
 . Similarly, we find no trend with effective surface brightness. We have also fitted exponentials to the outer parts of the luminosity profiles and find no trend between residuals and central surface brightness or scale length. These results differ from those of Zaritsky et al. (2014) due to the use of
  instead of
  line widths (see also Verheijen 2001). The lack of any trend between BTFR residuals and galaxy structural parameters is an issue for galaxy formation models, which generally predict such correlations (Dutton et al. 2007; Desmond & Wechsler 2015).
Gas-dominated galaxies provide an absolute calibration of the BTFR. McGaugh (2012) used 45 galaxies that were selected for having  (assuming
  based on stellar population models). Here we use a slightly different approach: we fit the BTFR weighting each point by
  . In this way, galaxies with fg = 0.5 are 25 times more important in the fit than galaxies with fg = 0.1. Our results are shown in Figure 2 for
 , using both standard error-weighted fits and
  -weighted fits. The latter hints at a small, systematic increase of
  with
with  or
or  (by ∼0.1 dex) in order to have symmetric residuals.
4. DISCUSSION AND CONCLUSIONS
In this Letter we study the BTFR using 118 galaxies with data of the highest quality: extended  RCs tracing Vf and Spitzer photometry at 3.6 μm tracing M*. We systematically explore the BTFR for different values of
  and find the following results:
- 1.The observed scatter reaches a broad minimum for, corresponding to nearly maximal stellar disks in HSB galaxies;
- 2.For any reasonable value of, the intrinsic scatter is below the minimum value expected in a ΛCDM cosmology (0.15 dex, Dutton 2012);
- 3.The residuals around the BTFR show no trend with galaxy size or surface brightness, providing a further challenge to galaxy formation models (Desmond & Wechsler 2015).


In a ΛCDM cosmology, the BTFR results from an underlying correlation between the "virial" mass (M200) and "virial" velocity (V200) of the DM halo (Mo et al. 1998). Following McGaugh (2012), we write

where G and H0 are Newton's and Hubble's constants, respectively. By construction, this relation has no intrinsic scatter. To map M200 and V200 onto the observed BTFR, we introduce the baryonic fraction  and the factor
  , hence

Since the observed BTFR has a slope higher than 3, we infer that fb and/or fV systematically vary with Mb. The presumed  and
and  relations are set by the galaxy formation process and must induce scatter on the observed BTFR. The factor fb is determined by baryonic processes like gas inflows, reionization, stellar feedback, and gas outflows. The factor fV, instead, is determined both by "primordial" halo properties (mass–concentration relation) and subsequent baryonic physics (halo contraction due to baryonic infall or expansion due to stellar feedback).
The mass–concentration relation has a well-established scatter of 0.11 dex from N-body simulations (Dutton & Macciò 2014), driving scatter on fV. The  relation, proxy of a more fundamental
  relation, has an estimated scatter of ∼0.1–0.2 dex (Moster et al. 2013; Zu & Mandelbaum 2015), driving scatter on
  . Since these two sources of scatter act in perpendicular directions on the BTFR, we expect an intrinsic scatter of at least ∼0.15–0.2 dex. For example, Dutton (2012) uses a semi-analytic model of galaxy formation to reproduce the BTFR and predicts a minimum intrinsic scatter of 0.15 dex. In his model, most of the expected scatter (∼73%) comes from the mass–concentration relation, while the remaining fraction comes from variations in the halo spin parameter. Hence, a value of ∼0.15 is a lower limit for ΛCDM cosmology: it is hard to imagine that stochastic baryonic processes would conspire to reduce the scatter expected from the basic structure of DM halos. Conversely, the diverse formation histories of galaxies should lead to significant variations in fb at a given halo mass (Eisenstein & Loeb 1996; McGaugh & de Blok 1998), hence a scatter larger than 0.15 dex would be a more natural result.
We find that the BTFR intrinsic scatter is ∼0.11 dex, below ΛCDM expectations. For galaxies with accurate distances, the observed scatter is already small (∼0.18 dex), thus there is little room for having overestimated the errors. Moreover,  dex is comparable to the mean error on Mb (driven by the assumed uncertainty on
  ), hence it should be considered as an observational upper limit.
One may wonder whether selection effects may artificially decrease the BTFR scatter. For example, Gurovich et al. (2010) argued that the exclusion of low-mass galaxies with rising RCs may introduce a bias toward objects where the  distribution is more extended with respect to the DM scale length. This is hardly the case. For low-mass bulgeless galaxies, RCs start to flatten at ∼2 Rd (independently of mass or luminosity) and reach a flat part beyond ∼3 Rd (Swaters et al. 2009). The presence or not of a flat part is mostly related to our ability to trace RCs out to large radii, where the
  column densities are low and the sensitivity of the observations decreases. Hence, the exclusion of galaxies with rising RCs helps avoid observational bias.
We stress that our sample spans a large range in mass ( ), size (
 ), surface brightness (
 ), gas fraction (
 ), and morphology (S0 to Im). We are only excluding merging and interacting galaxies, since they show disturbed, out-of-equilibrium
  kinematics that would artificially inflate the scatter on the BTFR. Hence our results are representative for the general population of non-interacting galaxies in low-density environments (field, groups, and diffuse clusters like Ursa Major).
In conclusion, the BTFR is an open issue for the current cosmological model: the stochastic process of galaxy formation needs to reproduce a global relation with little (if any) intrinsic scatter and no dependence on galaxy structural parameters.
We thank Michele Cappellari for providing LTS_LINEFIT. The work of F.L. and S.S.M. is supported by a grant from the John Templeton Foundation.
Footnotes
- 3
The NASA/IPAC Extragalactic Database (NED) is operated by the Jet Propulsion Laboratory, California Institute of Technology, under contract with the National Aeronautics and Space Administration.