


Abstract
During major solar flares, the photospheric magnetic field of the flaring active region is often observed to change abruptly, permanently, and significantly. Here we analyze vector magnetograms covering 15 X-class flares observed in 11 active regions by the Solar Dynamic Observatory Helioseismic and Magnetic Imager. Resolving magnetic changes using a reference potential field, more complex magnetic field, Lorentz force, and magnetic shear changes could be analyzed than previously. In each case, physical and coherent patterns of change were found. Generally the dominant change was in the horizontal field component that strengthened in the central structure, accompanied there by a downward Lorentz force change and strengthening of horizontal magnetic shear consistent with magnetic implosion, with weaker changes of opposite sign in neighboring and peripheral regions including sunspots. In most cases this central structure was a strong, sheared photospheric magnetic neutral line, but in one case it was an isolated unipolar sunspot. Magnetic relaxation in the vertical direction was typical throughout the flaring regions. Unique in this study was the behavior at bald-patch structures during the X-class flares of 2017 September 6 in NOAA Active Region 12673. During the X9.3 flare, the horizontal and vertical field components weakened and the shear relaxed in horizontal and vertical directions, indicating a large free magnetic energy source for the flare. The magnetic changes at the bald patches exhibited evidence of organized vertical magnetic flux reduction during three X-class flares, not found at other structures, suggesting the greater possibilities of magnetic reconfiguration and energy release at bald patches.
Export citation and abstract BibTeX RIS
1. Introduction
Solar active regions form when intense flux tubes emerge from the interior. Often these fields contain significant magnetic stress from the interior flows or from interaction with photospheric flows or preexisting coronal fields. The plasma-dominated physics of the photosphere and the magnetically dominated physics of the corona have distinctly different timescales: whereas photospheric flow speeds are generally lower than the typical sound speed of around 100 km s−1, so that the photosphere evolves on timescales of hours or days, flare-related coronal changes occur at rates comparable to the typical coronal Alfvén speed of about 1000 km s−1, and a major coronal change occurs in a matter of minutes. Although the coronal field is generally close to a force-free equilibrium state most of the time, this equilibrium is punctuated by episodes of abrupt magnetic stress relief, causing a significant release of magnetic energy, in the form of a major flare often accompanied by a coronal mass ejection (CME), which occurs over the minute timescales of the corona.
The photospheric magnetic field of a solar flaring active region is often observed to change abruptly during major flares, by hundreds of gauss (G) over timescales ranging from less than a minute to tens of minutes (Sudol & Harvey 2005; Petrie & Sudol 2010). Permanent stepwise flare-related changes are generally more pronounced in the horizontal than in the vertical field component (Wang & Liu 2015). Near major magnetic neutral lines the horizontal component tends to increase abruptly early during the flare (Wang & Liu 2010; Petrie 2012). This pattern is often accompanied by a "halo" of decreasing horizontal field around the neutral line. It has recently been suggested that the latter change occurs systematically later than the former (Sun et al. 2017).
The major magnetic field changes observed to occur over a matter of minutes during flares are therefore believed to represent rare cases of coronal forces significantly impacting the photosphere. The photospheric plasma and magnetic field are significantly denser and stronger than the coronal plasma and magnetic field so that, except during major flares, the physics flows very predominantly from the photosphere to the corona: photospheric changes produce coronal changes but not vice versa. During major flares, this causal direction can be briefly (and locally) reversed such that significant photospheric responses to coronal flares can be observed. These fast changes are attributed to coronal processes because they are spatially and temporally correlated with major flares and also because of their short duration and large size compared to photospheric background levels. While this time of photospheric change is brief, its effect can be "permanent" in the sense that it lasts at least a few hours and often longer, much longer than the timescale of the change itself.
The only plausible source of energy in the corona, where the magnetic field is dominant, is the free energy of the magnetic field. Hudson (2000) conjectured that coronal magnetic implosion, caused by an abrupt release of magnetic energy during a flare, would cause loops to contract and collapse toward the photosphere, resulting in shorter, lower-lying loops after the flare compared to before (Hudson et al. 2008). Abrupt coronal loop contraction during flares has indeed been observed (Liu et al. 2009; Liu & Wang 2009, 2010; Gosain 2012; Sun et al. 2012; Simões et al. 2013; Petrie 2016; Wang et al. 2016, 2018b). Such a change would be associated with an abrupt Lorentz force change that may be large enough to be detected in photospheric field measurements and that may be estimated from such measurements (Hudson et al. 2008; Fisher et al. 2012), particularly during eruptive flares whose momentum interchange should be associated with Lorentz force changes at the surface (Fisher et al. 2012). Such abrupt Lorentz force changes may also explain other short-timescale phenomena observed in the photosphere, such as abrupt sunspot displacements (Anwar et al. 1993) or weakening or strengthening of penumbral structure. Sunquakes may also be caused by them (Wang & Liu 2015). Interestingly, some major flares without CMEs have not been found to produce permanent photospheric changes as comparable flares accompanied by CMEs (Sun et al. 2015). The Lorentz force impulse associated with an upward-accelerating CME must be balanced by a downward force change on the photosphere. However, without an eruption there still may be Lorentz force changes acting on the photosphere, and cases with an eruption may not produce Lorentz force changes large enough to detect.
A downward Lorentz force change is not the only signature of a flare that might be expected in photospheric magnetic field data. In many flare models involving twisted magnetic flux, the pre-flare field is assumed to have excessive twist that is removed via eruption. Longcope & Welsch (2000) modeled the emergence of a twisted flux tube into the corona and concluded that expansion of the tube in the corona creates a torque imbalance at the photospheric surface, and Pevtsov et al. (2003) argued that to maintain torque balance the coronal portion of the tube should have its twist reduced. Photospheric field changes observed in twisted sunspots (TSs) during flares have been found to be consistent with this twist-removal scenario (Burtseva et al. 2017).
For a long time photospheric field gradients have been observed to be related to flare activity in active regions (e.g., Zhang et al. 1994). However, observational searches for flare-related changes in longitudinal (i.e., the component along the observer's line of sight) and vector photospheric magnetic fields were inconclusive because of limitations of instrument sensitivity, spatial resolution, cadence, and coverage (Sakurai & Hiei 1996). Furthermore, some apparent magnetic field changes initially associated with large flares were later found not to represent real magnetic field changes but were due to flare-induced changes in the spectral line profiles used in measuring magnetic field strength (Patterson 1984; Harvey 1986; Qiu & Gary 2003; Edelman et al. 2004). After multiple searches for evidence of real, permanent flare-related field changes in the photosphere (e.g., Severny 1964; Zirin & Tanaka 1981), abrupt, permanent photospheric field changes have been observationally linked to flares in the past two decades (Sudol & Harvey 2005). Wang (1992) and Wang et al. (1994) found rapid and permanent field changes in flaring active regions, but a number of later studies produced inconclusive results, as discussed by Wang (2006).
In the past two decades changes in the observed photospheric magnetic vector field have been observed near major neutral lines. Kosovichev & Zharkova (1999) reported a sudden decrease in magnetic energy near an X-class flare, during its impulsive phase, and Kosovichev & Zharkova (2001) discussed regions of permanent longitudinal magnetic flux decrease in the vicinity of the magnetic neutral line during the 2001 July 14 "Bastille Day" flare and linked the change in flux to the release of magnetic energy. Wang (2006) found an unshearing movement parallel to the neutral lines in flare-related longitudinal magnetic field changes in all five δ-spot flares that he studied, implying an overall release of shear, but that the two polarities converged toward the neutral line during some events and diverged during others. Studies based on vector magnetograms have often found that flare-related field changes near major neutral lines lead to a more horizontal field structure. Wang & Liu (2010) studied 11 X-class flares using vector magnetograms from the vector magnetograph of Big Bear Solar Observatory and other vector magnetographs and found in each case an increase of transverse field at the main neutral line. Since the launch of the Solar Dynamics Observatory (SDO) there has been a flurry of studies of flare-related magnetic vector field changes, many of them focusing on neutral lines, whose flare-related changes have followed a consistent pattern (Gosain 2012; Petrie 2012, 2013; Sun et al. 2012; Wang et al. 2012a, 2012b). Wang et al. (2012a) found that the vertical Lorentz force changes during flares were generally directed downward near neutral lines, and the sizes of these forces were (weakly) correlated with peak soft-X-ray flux as measured by GOES. Petrie (2012) found common patterns in magnetic field and Lorentz force vector changes during six major neutral-line flares observed by the Helioseismic and Magnetic Imager (HMI). During all six flares the neutral-line field vectors became stronger and more horizontal, and in each case the strengthening of the field occurred almost exclusively to the horizontal component parallel to the neutral line. During each flare the tilt angle of the photospheric field became closer to that of the reference potential field, implying that the release of magnetic stress played a leading role in the magnetic changes. The vertical Lorentz force changes were directed downward near the neutral line during each flare, and the horizontal Lorentz force changes were mostly parallel to the neutral line, but in opposite directions on each side, consistent with magnetic tension forces pulling the loops footpoints toward each other during the fields' collapse and contraction.
Distinctive patterns have also been found in the behavior of sunspot magnetic fields during major flares. Outer penumbral structure has been observed to decay rapidly after many flares, while neighboring umbral cores and inner penumbral regions become darker (Wang et al. 2004, 2005, 2009; Deng et al. 2005; Liu et al. 2005; Li et al. 2009). Transverse fields were found by these authors to decrease in the regions of penumbral decay and to increase at the flare neutral lines. The magnetic twist of sunspot fields has been observed to decrease abruptly as a result of flares (Ravindra et al. 2011; Inoue et al. 2014). Gosain & Venkatakrishnan (2010) studied the evolution of the photospheric vector field during the 2006 December 13 X3.4 flare and found that, in the penumbra of the main sunspot, the observed field was more inclined than the equivalent potential field, and the difference in inclination between the observed and potential fields steadily increased before the flare, abruptly decreased during the flare, and steadily increased again after the flare. Petrie (2012) found that during the X2.2 flare on 2011 February 15 the two sunspots neighboring the main neutral line underwent an abrupt weakening of their azimuthal field components (see also Burtseva et al. 2017), accompanied by a consistent Lorentz force change, bringing the sunspot fields closer to the reference potential field, implying a reduction of Maxwell stress. Major flares have more recently been observed to produce changes in rotation speed and even direction (Bi et al. 2016), or nonuniform differential rotation associated with the flare ribbon pattern (Liu et al. 2016).
Most of the studies described above have focused on field changes near neutral lines or in sunspots. Sudol & Harvey (2005) and Petrie & Sudol (2010) adopted a more general approach. Carefully co-registering 1-minute line-of-sight magnetograms from the National Solar Observatory's Global Oscillations Network Group longitudinal (line-of-sight) magnetograms, they traced the field changes pixel by pixel and were able to show the spatial structure of the changes that took place during major flares. For 15 X-class flares (Sudol & Harvey 2005) and 77 flares of GOES class of at least M5 (Petrie & Sudol 2010) they characterized the spatial distribution, strength, and rate of change of permanent field changes. Exploring the relationship between increasing/decreasing longitudinal fields and azimuth and tilt angles at various positions on the disk, Petrie & Sudol (2010) found that the overall distributions were consistent with the loop-collapse scenario of Hudson et al. (2008). Castellanos Durán et al. (2018) applied similar techniques to HMI line-of-sight data for 18 X-class, 37 M-class, 1 B-class, and 19 C-class flares and found stepwise field changes in 59/75 of the flares, including all of M1.6 class and above. The number of permanent changes decayed exponentially with distance from the neutral line.
Recent publications have reported unexpected patterns of response to major flares in lower atmospheric layers of complex active regions that seem to challenge the standard results found at neutral lines and sunspots. Kleint (2017) compared stepwise line-of-sight magnetic field changes during the X1 flare on 2014 March 29 at 1748 UT in Ca ii λ8542 chromospheric spectropolarimetric data from the Interferometric Bidimensional Spectropolarimeter (IBIS) at the Dunn Solar Telescope, using the weak-field approximation, with the corresponding changes in HMI 45 s line-of-sight photospheric magnetograms. By fitting an arctan function (Sudol & Harvey 2005) to registered image pixel time series, she found that the chromospheric changes were larger and more spatially extensive than the photospheric changes and were concentrated near loop footpoints, close to but not cospatial with hard X-ray emission, whereas the photospheric changes were concentrated near the main neutral line of the active region. The chromospheric and photospheric changes appeared to be independent of each other in timing, sign, and magnitude. Also, Bi et al. (2016) reported an abrupt reversal in the direction of rotation of a TS during the X1.6 flare in NOAA Active Region 12158 on 2014 September 10 that they attributed to a Lorentz torque brought about by an abrupt change of twist in the coronal field due to the flare.
Then, during 2017 September, came NOAA AR 12673, the most flare-active region of cycle 24. This region's evolution featured the fast movement of newly emerged, twisted flux toward a preexisting sunspot, distorting the new bipoles and resulting in a very curved, very sheared neutral line (Yang et al. 2017; Verma 2018; Yan et al. 2018), with very strong >5 kG transverse fields in the Goode Solar Telescope (GST) Near Infra-Red Imaging Stokes Polarimeter (NIRIS) Stokes profiles taken a few hours after the X9.3 flare, along two sections of the main neutral line corresponding to light bridges in GST Nasmyth Focus Instrumentation (NFI) images (Wang et al. 2018a). In early 2017 September NOAA AR 12673 transformed from a decaying active region, via very fast emergence of highly twisted flux (Sun & Norton 2017), to the most flare-productive region of cycle 24. Strong shear flows along the main neutral line pushed the negative-polarity flux toward the positive part of the delta sunspot to the north. The newly emerged flux's motion, including movement toward and rotation with respect to the preexisting sunspot, were closely associated with the subsequent flare activity according to several studies (Yang et al. 2017; Romano et al. 2018) and unusual levels of emission resulting from the X9.3 flare in particular (Goryaev et al. 2018; Romano et al. 2018; Verma 2018).
It is clear, therefore, that the familiar patterns of magnetic field change, the downward motion of sheared loops crossing the main neutral line or the release of magnetic twist in sunspots, must be extended and refined to accommodate more complex magnetic structure and change, as well as comparison between active regions with sunspots and/or neutral lines arranged in different combinations and configurations. For this, instead of focused analysis of neutral-line or sunspot fields, or statistical analysis of decontextualized field changes, we require a study of vector field changes in the context of their place in their respective active regions: in what type of magnetic structure do they occur, and what is the status of this structure in the active region?
This overview is an attempt to gather results for 15 representative cycle 24 flares, including diverse types of flaring field, to study their differences and to highlight their common patterns. The flares include examples with changes concentrated near main photospheric neutral lines, examples whose changes were strongest in sunspots, and examples combining these two archetypical scenarios. The sample also includes the most active region of cycle 24, NOAA AR 12673, which features neutral-line fields that traverse the neutral line from the negative to the positive side instead of vice versa, known as "bald-patch" structure. We will analyze the role that this structure may have played in making NOAA AR 12673 the most energetically flaring region observed by HMI.
The paper is organized as follows. We introduce and discuss the data set in Section 2 and the methods for calculating the Lorentz force and magnetic shear changes in Section 3. We then present the results for the flares themselves, focusing in the main text on one case centered around relatively simple sheared neutral lines bracketed by TSs in Section 4; a flare that occurred in a unipolar TS in Section 5; and three flares occurring in NOAA AR 12673, the most energetically flaring region of cycle 24, in Section 6. In the appendices we present the remainder of the flares covered in this paper, all neutral-line flares whose broad similarity of flare-related magnetic change seems to represent modal behavior for major flares: two further examples centered around relatively simple sheared neutral lines bracketed by TSs in Appendix A, a neutral-line flare in a field of opposite handedness (dextral chirality) in Appendix B, two neutral-line flares whose more complex vector field changes produce simpler Lorentz force and magnetic shear changes in Appendix C, the X1 flare that occurred at a more diffuse neutral line and was studied by Kleint (2017) in Appendix D, two flares occurring at an asymmetric peninsula of magnetic flux in Appendix E, and two flares that occur in more complex magnetic structures in Appendix F.
We summarize the flare-related magnetic changes in Section 7, drawing out the contrasts between the modal behavior during neutral-line flares and the exceptional cases described in Sections 5 and 6. Section 8 presents a focused analysis and discussion of the bald-patch structure of NOAA AR 12673 and the flare-related magnetic changes associated with it. We conclude in Section 9.
2. Data
We use data from the HMI instrument aboard the SDO. Vector magnetic field maps were obtained from the Joint Science Operations Center data and software system at Stanford. These maps, projected onto a cylindrical equal-area Cartesian coordinate system, were obtained from observations of the Stokes vectors for the Fe i absorption line at 6173 Å with a resolution of 1'' (Hoeksema et al. 2014). In our analysis, all fields with magnitude less than 100 G are regarded as dominated by noise and are not included in calculations.
In particular, we use 12-minute Spaceweather HMI Active Region Patch (SHARP) vector magnetograms (Bobra et al. 2014). The 12-minute data have higher signal-to-noise ratio than the recently introduced 135 s data (Sun et al. 2017). This means that we expect the cleanest available Stokes inversion and disambiguation of the 180° azimuth angle ambiguity with the 12-minute data. In this study we are mainly interested in the net effect of a major flare on the magnetic field. An analysis of the field properties immediately before and after the main flare-related changes is needed. To assess the significance of these flare-related changes, a time series of observations, including several hours before and after each flare, is desirable. For all but one of the flares studied here several hours of continuous data covering the flare time are available. One advantage of higher-cadence data is that flare-related line emission artifacts can be temporally resolved, isolated, and eliminated from analysis (or studied). However, although spectral line emission can be an obstacle to Stokes inversion for the magnetic field, the visible light emission kernels of even major flares are small in size and brief in duration, so that their effects on the results can be controlled. Our goal in the project is not to characterize precisely the timing and duration of the magnetic changes but to study the overall patterns of these changes. Therefore, as a precaution, we take differences between measurements taken before and after the impulsive, emission phase of each flare, avoiding the emission artifacts. A follow-up study based on high-cadence data may dig into the details of the changes over ≈1-minute timescales. The present data set allows us to explore the spatial patterns of the changes with detail and precision.
We study the 15 flares in 11 active regions listed in Table 1. These flares were selected solely on the basis that they were well observed by HMI without a prohibitive viewing angle and exhibited flare-related photospheric field changes significantly above the level of background photospheric evolution. The flares represent a wide range of active region structure, from strong, simple, sheared neutral lines to more contorted neutral lines complicated by neighboring structure, and from simple pairs of nearly circular TSs to more asymmetric sunspot fields. We seek patterns relating the active region structure and the nature of its flare-related field changes. Several of the flares have already been studied, but the photospheric vector changes have not been analyzed as comprehensively and inclusively as here. The method for analyzing the vector field changes and the associated Lorentz force and shear changes, applicable to any magnetic vector structure, is described in the next section.
Table 1. Flares Included in This Study
| Flare | Start | End | Peak | GOES | Position | NOAA AR | See |
|---|---|---|---|---|---|---|---|
| Date | Time (UT) | Time (UT) | Time (UT) | Class | on Disk | Number | Figures |
| 2011 Feb 15 | 01:44 | 02:06 | 01:56 | X2.2 | S20W10 | 11158 | 1, 2 |
| 2011 Mar 9 | 23:13 | 23:29 | 23:23 | X1.5 | N08W11 | 11166 | 32, 33 |
| 2011 Sep 6 | 22:12 | 22:24 | 22:16 | X2.1 | N13W18 | 11283 | 14, 16 |
| 2011 Sep 7 | 22:32 | 22:44 | 22:38 | X1.8 | N14W31 | 11283 | 15, 17 |
| 2012 Mar 7 | 00:02 | 00:40 | 00:24 | X5.4 | N18E31 | 11429 | 18, 19 |
| 2013 Nov 5 | 22:07 | 22:15 | 22:12 | X3.3 | S12E44 | 11890 | 26, 28 |
| 2013 Nov 8 | 04:20 | 04:29 | 04:26 | X1.1 | S13E13 | 11890 | 27, 29 |
| 2014 Mar 29 | 17:35 | 17:54 | 17:48 | X1.0 | N10W32 | 12017 | 24, 25 |
| 2014 Sep 10 | 17:21 | 18:20 | 17:45 | X1.6 | N11E05 | 12158 | 3, 4 |
| 2014 Nov 7 | 16:53 | 17:34 | 17:26 | X1.6 | N14E36 | 12205 | 30, 31 |
| 2014 Dec 20 | 00:11 | 00:55 | 00:28 | X1.8 | S18W29 | 12242 | 20, 22 |
| 2015 Mar 11 | 16:11 | 16:29 | 16:22 | X2.1 | S17E22 | 12297 | 21, 23 |
| 2017 Sep 6 | 08:57 | 09:17 | 09:10 | X2.2 | S08W32 | 12673 | 5, 8 |
| 2017 Sep 6 | 11:53 | 12:10 | 12:02 | X9.3 | S09W34 | 12673 | 6, 9 |
| 2017 Sep 7 | 14:20 | 14:55 | 14:36 | X1.3 | S08W48 | 12673 | 7, 10 |
Note. The flares are listed chronologically but are not analyzed in chronological order in Sections 4–6 and Appendices A–F, but according to features and properties they have in common, such as neutral-line and/or sunspot structure and their degree of complexity.
Download table as: ASCIITypeset image
3. Methodology
Here we describe the quantitative methods used to analyze the magnetic vector field changes, the Lorentz force vector changes, and the magnetic shear changes that occurred during each flare at neutral lines, in sunspots, and elsewhere in the flaring part of each active region. Though flare-related Lorentz force and magnetic shear changes have been studied many times in the past, we study their interrelationship systematically here for the first time.
In all cases the active region field structure is complex to some degree, but most of the regions feature a prominent magnetic neutral line with strong magnetic shear, indicated by a strong horizontal component directed parallel to the neutral line. Several of the regions also feature large sunspots with well-organized field structure, sometimes including a well-defined direction of magnetic twist. Past studies (Petrie 2012, 2013, 2016) have employed rectangles and circles around the neutral lines and sunspots of interest, defining a local coordinate system around each of these features. Thus, besides the vertical vector components, the horizontal components can be simply resolved in both horizontal directions characteristic of the feature in question, along and across the neutral line or in the azimuthal and radial directions in a sunspot. Here we adopt a more general approach without losing clarity of description of the vector components in all three directions. We adopt as a reference field the unique potential field that shares its vertical component with the observed field. This potential field, being unstressed everywhere, is unsheared near neutral lines and untwisted in sunspots. Decomposing the horizontal vector components into components parallel and perpendicular to the reference potential field therefore isolates those components related to magnetic stress, such as shear near neutral lines and twist in sunspots.
3.1. Photospheric Lorentz Force Changes
We briefly summarize the method of Fisher et al. (2012) to estimate the total Lorentz force vector change acting on the photosphere and subphotospheric volume below an active region as a result of a flare. The Lorentz force per unit volume fL can be written as

where the Maxwell stress tensor (Tij) in local Cartesian coordinates in terms of the spherical field components (Br, Bθ, Bϕ ) is
Fisher et al. (2012) evaluated the total Lorentz force over an atmospheric volume surrounding an isolated flaring active region by integrating Equation (1) over this volume, whose lower boundary is identified with the photosphere, with the upper boundary far above the photosphere, and with side boundaries connecting these surfaces to form a closed volume V as shown in Figure 1 of Fisher et al. (2012). Evaluating the volume integral of Equation (1) using Gauss's divergence theorem then gives (Fisher et al. 2012)
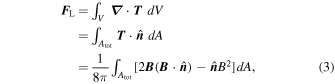
where the area integral is evaluated over all surfaces of the volume, denoted by Atot, with unit normal vector  . The first term on the right-hand side of Equation (3) represents the magnetic tension force, and the second term represents the magnetic pressure gradient force. As Fisher et al. (2012) argue, if the upper boundary of the volume is far enough above the photosphere and the side boundaries are distant enough from the active region that the field integrals over these surfaces are negligible, then the surface integral of Equation (3) reduces to an integral over the photospheric lower boundary Aph only. Petrie (2014) further argued that in large-scale structures (e.g., with typical horizontal magnetic length scale ≫300 km, about the size of an HMI pixel), and with strong magnetic fields (e.g., about ≥600 G in the HMI magnetograms), the Lorentz force acting on the photosphere may be approximated by a surface integral based on photospheric boundary data alone. These conditions include many of the sunspot fields and major neutral lines that have been studied using the method of Fisher et al. (2012) in the past (Petrie 2012, 2013; Wang et al. 2012b). Under these conditions, for the force acting on the volume below the photosphere,
  ,
,  ,
,

and

where we have reversed the signs of these expressions compared to Equations (5) and (6) of Fisher et al. (2012) because we are considering the forces imposed on the photosphere from above instead of the equal and opposite forces on the atmosphere from below. Equation (4) comprises contributions from both the magnetic tension and pressure gradient forces, whereas Equation (5) comes from the magnetic tension force only. Now, assuming that the photospheric vector field is observed over a photospheric area Aph at two times, t = 0 before the flare-related field changes begin and t = δt after the main field changes have occurred, the corresponding changes in the Lorentz force vector components between these two times are given by Equations (17) and (18) of Fisher et al. (2012), again with a change of sign:

and

where at a fixed location in the photosphere


Equations (6) and (7) therefore express the Lorentz force change  in terms of the magnetic field change
  . Equations (6) combines changes in the magnetic pressure and tension forces, whereas Equation (7) includes only contributions from the magnetic tension force. We will use the structure of Equations (6) and (7) to explain the patterns of Lorentz force change in the flaring regions in Sections 4–6 and Appendices A–F.
3.2. Magnetic Shear Parameters
The magnetic shear S of an observed field B = (Br, −Bθ, Bϕ) in spherical coordinates (r, θ, ϕ) is the angular displacement between this field and the reference potential vector field  weighted by the field strength
  ,
,

where  (Hagyard et al. 1984; Wang 1992; Gosain & Venkatakrishnan 2010; Petrie 2012). Defining Bh = (−Bθ, Bϕ),
  ,
,  , and
, and  , the absolute value of the horizontal shear Sh,

is the angular displacement between observed horizontal field and the horizontal components of the reference potential vector field, weighted by the horizontal field strength Bh =  h∣. The handedness or "chirality" of a vector field is a fundamental aspect of its departure from its lowest-energy, potential field state, and so we are also interested in the sign of the shear. For example, the relationship between Lorentz force changes and magnetic shear or twist changes during flares likely has a dependence on the handedness of the field. However, Equations (11) and (12) for the shear do not preserve the sign of the angular displacement (Hagyard et al. 1984; Tiwari et al. 2009). However, defining the shear with a cross product instead of a dot product,

gives us the handedness of the shear.
The vertical tilt angle of the field is

if we define the relative tilt angle γ − γp where

(Gosain & Venkatakrishnan 2010), then a signed vertical "shear," analogous to Equation (13), can be defined as

the relative tilt angle weighted by the field strength B.
3.3. Approximations for the Case ∣δBr∣ ≪ ∣δ Bh∣
In many cases of flare-related photospheric magnetic field change the horizontal field components are observed to change to a greater degree and in a more organized fashion than the vertical component. This is because the vertical magnetic flux distribution is difficult to change on the timescale of a flare. Whereas the horizontal components can be changed by vertical forces, e.g., the collapse or expansion of a loop structure, or horizontal forces, e.g., the twisting or untwisting of a sunspot, vertical flux change requires the lateral movement, emergence or removal of magnetic flux threading through the photosphere, which is physically more difficult to achieve within the timescale of a flare and is observed more rarely. We are therefore interested in simplifications to the expressions in Sections 3.1 and 3.2 arising in the case  .
.
The expressions for δFr and  in Equations (6) and (7) also simplify for the case
  :
:

and

Hence, a downward/upward Lorentz force change is expected if Bh increases/decreases in strength. Furthermore,  points parallel/antiparallel to
  for positive/negative Br. This implies, for example, that wherever a sheared field Bh increases in strength along a neutral line, a downward vertical Lorentz force change and horizontal Lorentz force changes pointing in opposite directions parallel and antiparallel to Bh are expected, consistent with an increase of magnetic pressure and a release of magnetic tension, respectively. We will see this occur in many but not all cases in Sections 4–6. In Sections 4–6 and Appendices A–F we will calculate the force changes using the exact expression in Equations (6) and (7), but we will use the approximations Equations (17) and (18) to aid our physical interpretation of the exact calculations.
For shear angles between ±90° the sin−1 function in Equation (13) is monotonic and for small arguments of sin−1 is approximately equal to its argument, and so from Equation (13),

Hence, the sign of the shear is well determined by the simple expression  . If
. If  , then
  because
  is determined by Br and so

This approximation should be valid in the case of  with small arguments but, as we will see, often gives the correct sign for larger arguments between ±90° because the sin−1 function in Equation (13) is monotonic. In Sections 4–6 and Appendices A–F we will calculate the shear changes using the exact expression in Equation (13), but we will discuss these shear changes using the approximations Equations (19) and (20) to develop an intuitive sense of the causes of the changes.
Because tan−1 is approximately equal to its argument, the vertical shear Sv in Equation (16) is approximated by

and, for  ,
,

It should be no surprise that in the case  the vertical shear change is determined by the change in Bh. In Sections 4–6 and Appendices A–F we will use the exact expression in Equation (16), but Equation (22) will help to guide our discussion of the exact calculation.
We see from Equations (20) and (22) that a signed change in the direction of Bh will usually produce a change δSh of the same sign, and an increase/decrease in strength of Bh will usually increase/decrease ∣Sh∣. The vertical shear Sv is expected to increase/decrease if Bh increases/decreases, and ∣Sv∣ is expected to increase/decrease if Bh moves toward/away from  .
.
These simple relationships will guide us in interpreting some of the complex magnetic changes that generally occur during flares, which are difficult to understand in an intuitive manner without such intuitive understanding of simple cases. We will present the 15 flares not in chronological order but according to common features and properties of the flaring active region, such as the presence of a sheared neutral line or TS and the degree of complexity of the region. It is a coincidence that cycle 24 began with one of the most magnetically organized flares, the X2.2 flare in NOAA AR 11158 on 2011 February 15, and ended with one of the most complex, the X9.3 flare in NOAA AR 12673 on 2017 September 6. Both simple and complex flares occurred throughout cycle 24, including one of the simplest in the middle of the cycle, on 2014 September 10. We discuss the 15 flares in an order best suited to reveal their similarities and differences in behavior, beginning with flares centered on monolithic neutral-line fields between TS pairs observed early in the cycle.
4. A Flare Involving a Sheared Neutral Line and Twisted Sunspots
In this section we focus on the first X-class flare that occurred during Cycle 24: the X2.2 flare at 01:44 UT on 2011 February 15 in NOAA AR 11158. In this case the flare was closely associated with a long, strong, sheared neutral line with a TS on each side. Two further flares that occurred in an active region with a strong, sheared neutral line bracketed by two opposite-polarity TSs will be described in Appendix
Petrie (2013) found that in the case of the 2011 February 15 X2.2 flare in NOAA AR 11158, abrupt untwisting forces occurred in two prominent sunspots located at opposite ends of the main neutral line, while the sheared field crossing the neutral line underwent a dominant downward Lorentz force change and an increase in the parallel field component parallel to the neutral line, bringing the field tilt closer to that of the reference potential field (Petrie 2012). The pattern is therefore consistent with a collapsing and untwisting flux rope, with reduced Maxwell stress at both the sunspots and the neutral line. Wang et al. (2014b) found that the shear flows at the neutral line and circular motions at the two neighboring sunspots underwent sudden changes during this flare, consistent with the Lorentz force changes calculated from the vector magnetograms. Ruan et al. (2014) reported that circular sunspot motions may have energized the 2011 September 6 X2.1 flare in NOAA AR 11283 and that the horizontal field component near the main neutral line steadily decreased in strength several hours before this flare. Liu et al. (2014) concluded from nonlinear force-free modeling that a tilted magnetic flux, rooted in the rotating sunspot, crossed the main neutral line and collapsed during this X2.1 flare and the X1.8 flare that occurred the following day.
The principal features of NOAA AR 11158 on 2011 February 15, shown in Figure 1, were a strong, sheared magnetic neutral line and, neighboring it, two TSs. The neutral line had positive flux to the south and negative flux to the north. Near the neutral line, the horizontal field component Bh (represented by black arrows in the top left panel of Figure 1) was directed eastward almost parallel to the neutral line. The photospheric field near the neutral line was therefore highly sheared. The horizontal shear Sh of the neutral-line field had sinistral chirality (i.e., was left-handed) because the potential field's horizontal component  pointed northward across the neutral line from the positive to the negative side, Bh pointed eastward, and so
  .
.
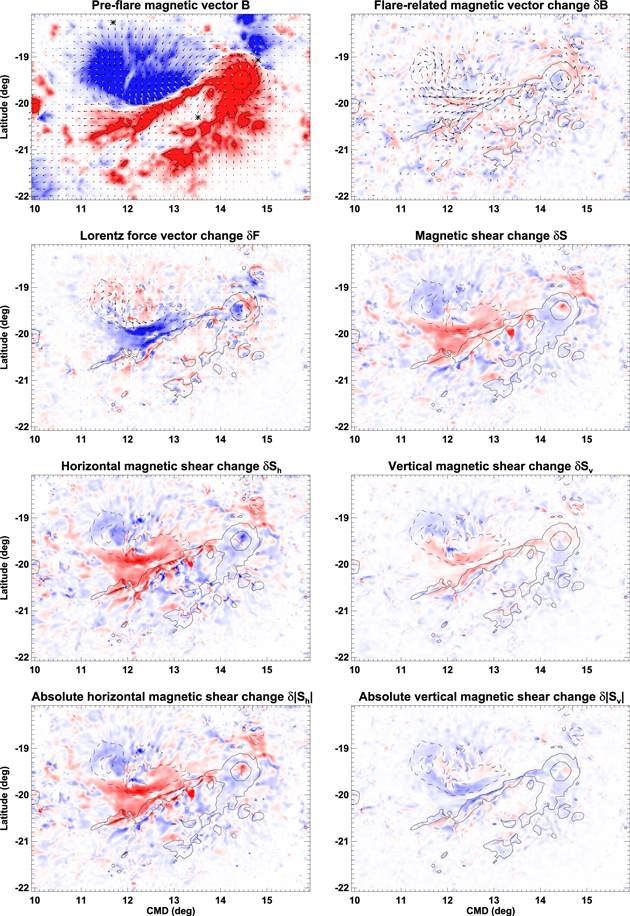
Figure 1. X2.2 flare on 2011 February 15 at 01:44: pre-flare photospheric vector field B (top left), flare-related photospheric vector field change  (top right), Lorentz force vector change
  (second row, left), magnetic shear change δS (second row, right), horizontal magnetic shear change δSh (third row, left), vertical magnetic shear change δSv (third row, right), absolute horizontal shear change δ∣Sh∣ (bottom left), and absolute vertical shear change δ∣Sv∣ (bottom right). Red/blue coloring represents positive/negative value. All quantities saturate at ±1000 G, except the Lorentz force change
  , which saturates at ±104 dyn cm−2. Black arrows represent horizontal vector components; white arrows in the B plot represent the potential field Bp. The black solid/dashed contours show locations of positive/negative vertical magnetic flux density ±1 and ±2 kG.
Download figure:
Standard image High-resolution imageIn the positive sunspot at the west end of the neutral line, the horizontal field Bh had an anticlockwise circulation. Since the potential field's horizontal component  (represented by white arrows in the top left panel of Figure 1) pointed outward from the center of this positive-polarity spot,
  , and so this spot, like the neutral line, had magnetic field of sinistral chirality. The negative-polarity sunspot to the northeast of the neutral line had clockwise-circulating Bh, which, because this negative-polarity sunspot's
  must point toward the center of the spot, again implies
  and sinistral chirality. Thus, we have a strong neutral line and two neighboring sunspots all with sinistral handedness.
The change  in the photospheric vector field associated with the X2.2 flare is shown in Figure 1 (top right). The horizontal field changes
  appear more organized and coherent than the vertical field changes
  r, especially near the main neutral line and in the two neighboring sunspots. Near the neutral line
  pointed eastward, strengthening Bh there, whereas in the positive and negative sunspots
  had clockwise and anticlockwise circulation, respectively, weakening Bh in both spots.
This contrast of horizontal field change  near the neutral line and in the two neighboring sunspots can be traced through the Lorentz force changes
  and the shear changes associated with the flare, shown in the other panels of Figure 1. Wherever the horizontal field change was significantly larger than the vertical field change,
  , the vertical Lorentz force change simplifies to Equation (17), so the vertical Lorentz force change was directed downward/upward wherever Bh became stronger/weaker during the flare. In particular, an extended region of the photosphere near the neutral line was subjected to a large downward Lorentz force change directly associated with the strengthening of Bh there, unaccompanied by a comparable change in Br. The umbra of the positive sunspot appears to have undergone a reduction of Br during the flare, complicating this physical picture, but the outer penumbrae of both spots experienced upward Lorentz force changes associated with reduced
  .
.
These vertical force changes were accompanied by horizontal force changes  that were clockwise in both sunspots, as shown in Figure 1, consistent with a release of magnetic tension associated with untwisting of the field, and have counterstreaming parallel and antiparallel directions on the positive and negative sides of the neutral line, consistent with release of magnetic tension associated with collapsing sheared loop structure across the neutral line.
Figure 1 also shows that the magnetic shear changes appear to have been highly spatially correlated with the Lorentz force changes. The full magnetic shear change δS is generally anticorrelated with the vertical Lorentz force change δFr. Later we will see that this behavior generalizes over many flares. Intuitively one can expect that whenever  and
and  is strengthened/weakened, δFr, if Equation (17) is applicable, should point downward/upward and the magnetic shear should increase/decrease. To see how this happens in detail, we study separately the horizontal and vertical components of magnetic shear change δSh and δSv defined above in Equations (13) and (16). We study changes in both the signed and absolute shear.
Figure 1 shows that the effect of  on δSh was different in the vicinity of the main neutral line as opposed to the two neighboring sunspots. On each side of the neutral line, where Bh was strengthened during the flare, the signed and absolute horizontal shear both increased. In both sunspots Bh became weaker during the flare and the signed and absolute horizontal shear decreased.
The vertical shear shows slightly different behavior in Figure 1. The signed vertical shear change was mostly positive near the neutral line and negative in the two sunspots, consistent with an increase in magnetic tilt near the neutral line and a decrease in tilt of most of the field in the two sunspots. However, there was a general decrease in the absolute vertical magnetic shear, i.e., in the size of the tilt angle with respect to the reference potential field over the region as a whole: over the neutral line and the two sunspots. This relaxation of vertical shear over most of the active region seems to have come together with some horizontal shear increase at the neutral line. This may be explained by, e.g., the simultaneous untwisting and collapse of a flux rope connecting the two sunspots across the neutral line.
Figure 2 shows the temporal variations of the magnetic parameters over a 12 hr period centered on the start time of this X2.2 flare in NOAA AR 11158. This figure demonstrates that the organized magnetic changes occurring during this flare rose significantly above the background level. The background changes are caused by both photospheric dynamics and uncertainties in the measurements and processing steps that contribute to producing the vector field data. The background changes generally vary only slightly around a steady value except during the flare, where the magnetic changes can briefly become much larger than the background value and form a spike in a plot of magnetic change against time. The departure of the changes at flare time from the background changes at other times supports our attribution of these larger changes to the flare.
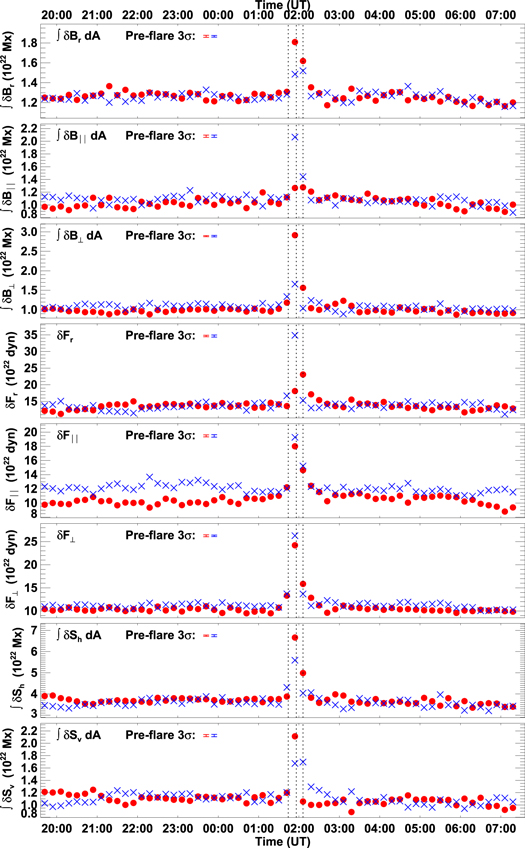
Figure 2. X2.2 flare on 2011 February 15 at 01:44: positive (red circles) and negative (blue crosses) vertical magnetic flux changes, parallel and perpendicular horizontal integrated field changes, vertical and horizontal parallel and perpendicular Lorentz force changes, and horizontal and vertical integrated magnetic shear changes, plotted against time over a 12 hr window centered on the published GOES start time of the flare. Also shown in each plot for comparison are 3σ error bars for the positive (red) and negative (blue) pre-flare variations.
Download figure:
Standard image High-resolution imageFigure 2 also shows that the changes in the horizontal field components were larger than the change in the vertical component during the flare, but all three components underwent changes well above the background value. There was a strong negative bias in the parallel flare-time change, mostly due to the sunspot penumbral field's horizontal component becoming weaker. A smaller but still strong positive perpendicular flare-time change was due to the sunspot fields becoming less twisted. The larger negative perpendicular flare-time change was due to the field near the neutral line acquiring a strengthened component in the direction parallel to the neutral line (compare with Petrie 2016, where the neutral-line and sunspot fields are analyzed individually and the meanings of parallel and perpendicular are different).
Most of the dominant negative (downward) vertical Lorentz force change shown in Figure 2 came from the vicinity of the main neutral line, and most of the smaller positive spike came from the two sunspots. The parallel horizontal force changes, the positive and negative spikes in δF∥, were evenly balanced. The perpendicular force changes were also evenly balanced in sign. The two signs of δF⊥ mostly represent the force changes parallel and antiparallel to the axial field near the neutral line. These force changes had approximately equal magnitude. There were also contributions of opposite sign from the two sunspots; though the untwisting motions in both sunspots were associated with clockwise force changes, these had opposite signs in δF⊥ because of the opposite magnetic polarities and therefore the opposite directions of  in the two spots. Hence, the contributions to δF⊥ from near the neutral line and from the two sunspots were evenly balanced in sign. The negative vertical force change was larger and was not close to being evenly balanced by a positive change. This force change must therefore have been balanced by an equal and opposite force change from the interior (Fisher et al. 2012).
Recalling that Bh near the neutral line and in the sunspots was sinistral ( ), a perpendicular horizontal field change
  implies an increase/decrease in horizontal shear. The signed horizontal shear change had a large positive peak mostly from the vicinity of the neutral line and a smaller but still significant negative peak mostly from the sunspots. The vertical shear had a large positive peak mostly from the neutral-line region and a smaller negative peak mostly from the sunspots. Figure 1 shows that the horizontal and vertical shear changes were quite differently distributed in space, yet these separations into contrasting behavior near the main neutral line and in the sunspots are clear in both quantities.
As anticipated in Section 1, NOAA AR 11158 exhibited evidence of magnetic implosion near the neutral line and of magnetic twist removal in the neighboring sunspots. Furthermore, most of the flare-related magnetic field change occurred in the horizontal component. The vertical field changes, being smaller and much less organized, had less effect. It turns out that most of the flaring regions in this study, despite their diverse morphologies and different magnetic handedness and symmetry properties and neutral line/sunspot structure, conform to the same patterns of behavior in their main neutral lines and sunspots. We relate these common traits back to their various magnetic structures in Appendices A–F. In Sections 5 and 6 we present exceptions to these rules before summarizing the flare-related magnetic changes during all 15 flares in Section 7.
5. A Flare with Magnetic Changes Concentrated in a Single Twisted Sunspot
The X1.6 flare in NOAA AR 12158 on 2014 September 10 is distinguished in our sample in having occurred in a unipolar sunspot, with no strong neutral line in the region. Bi et al. (2016) reported an abrupt reversal in the direction of rotation of a TS during this flare that they attributed to a Lorentz torque brought about by an abrupt change of twist in the coronal field due to the flare. The authors indicated that the extrapolated model coronal field lines generally became shorter after the flare and that the horizontal field component increased, hinting that the flare-related changes during this flare may be contrary to the twist-removal scenario discussed in Section 1 and found in the flares described in Section 4 and in Appendices A–F. Here we study in detail the changes in the Lorentz force and shear in the vertical and horizontal directions due to the flare.
Figure 3 shows photospheric magnetic changes associated with this flare. These changes were concentrated in the single TS. The sunspot had positive polarity, and its horizontal field Bh had clockwise circulation. Since  must point outward from the center of the spot, this gives
  and dextral chirality. In this relatively isolated spot, unlike in sunspots in the other flaring active regions,
  had the same clockwise direction of circulation as Bh, and so Bh was strengthened in this sunspot during this flare. Curiously, δBr was net-negative in the sunspot umbra, implying a small reduction of magnetic flux, balanced by a net increase in flux in the surrounding regions, as the top panel of Figure 4 shows.
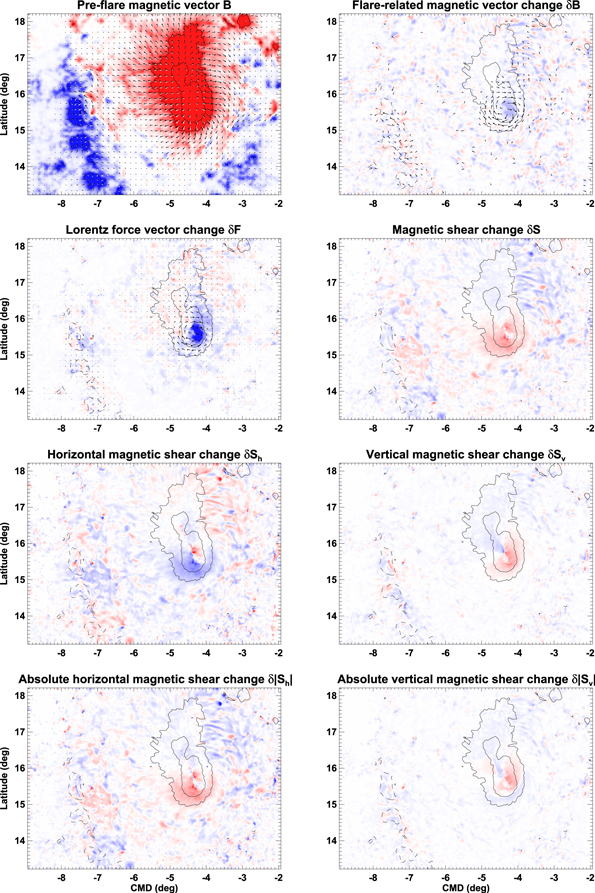
Figure 3. X1.6 flare on 2014 September 10 at 17:21 UT: pre-flare photospheric vector field B (top left), flare-related photospheric vector field change  (top right), Lorentz force vector change
  (second row, left), magnetic shear change δS (second row, right), horizontal magnetic shear change δSh (third row, left), vertical magnetic shear change δSv (third row, right), absolute horizontal shear change δ∣Sh∣ (bottom left), and absolute vertical shear change δ∣Sv∣ (bottom right). Red/blue coloring represents positive/negative value. All quantities saturate at ±1000 G, except the Lorentz force change
  , which saturates at ±104 dyn cm−2. Black arrows represent horizontal vector components; white arrows in the B plot represent the potential field Bp. The black solid/dashed contours show locations of positive/negative vertical magnetic flux density ±1 and ±2 kG.
Download figure:
Standard image High-resolution image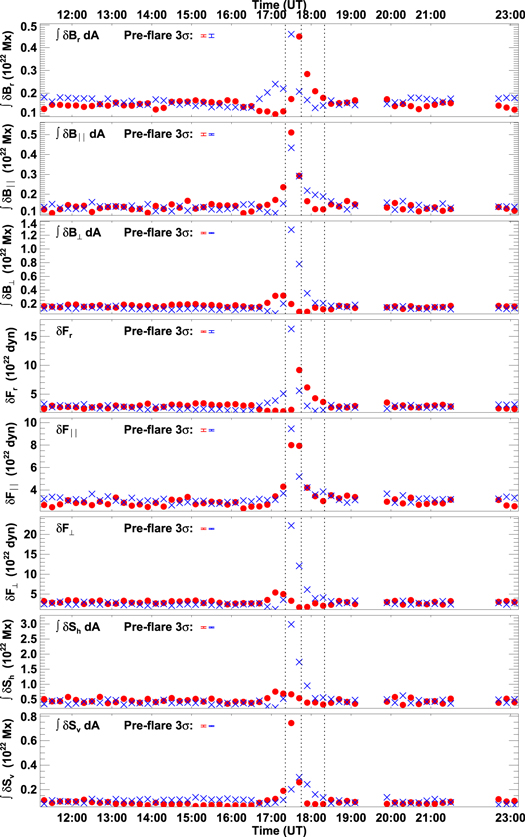
Figure 4. X1.6 flare on 2014 September 10 at 17:21 UT: positive (red circles) and negative (blue crosses) vertical magnetic flux changes, parallel and perpendicular horizontal integrated field changes, vertical and horizontal parallel and perpendicular Lorentz force changes, and horizontal and vertical integrated magnetic shear changes, plotted against time over a 12 hr window centered on the published GOES start time of the flare. Also shown in each plot for comparison are 3σ error bars for the positive (red) and negative (blue) pre-flare variations.
Download figure:
Standard image High-resolution imageThe map of  in Figure 3 shows a clockwise-circulating
  , consistent with the clockwise-circulating
  and Equation (17), and a strong downward δFr in the spot with a faint positive δFr halo to the north. During the flare, the TS field appears to have collapsed abruptly downward, increasing the twist of the field. The magnetic shear changes support this picture. The total shear and the unsigned horizontal shear both increased, with faint halos of decrease to the north. Being dextral, the spot's shear increase was a negative signed horizontal shear change. The signed and absolute vertical shear changes were both positive, with weaker, negative changes to the north. These patterns are contrary to the patterns found in sunspots during the other flares and suggest a distinctly different type of magnetic restructuring in isolated sunspots as opposed to sunspots neighboring strong magnetic neutral lines.
According to Figure 4, the largest magnetic field component change was a negative spike in δB⊥ as this dextral field's azimuthal component was significantly strengthened. Much smaller but still significantly above the background variations were positive and negative spikes in δB∥ of approximately equal size, where  pointed inward and outward from the center of the spot at different locations, and positive and negative spikes in δBr of approximately equal size, with the negative δBr mostly occurring at the center of the spot.
Also evident in Figure 4 is a large downward Lorentz force change, a negative δFr, at the center of the spot where, according to Figure 3, Bh was strengthened, with a smaller positive δFr mostly in the northern and outer parts of the spot. Larger than δFr was a positive spike in δF⊥ associated with the twist and downward motion of the spot's azimuthal field. There were also smaller positive and negative spikes in δF∥ of approximately equal size to each other, where  pointed outward and inward from the center of the spot at different locations.
Figure 4 shows that the horizontal shear change was almost all negative, dominated by the mostly azimuthal strengthening of the dextral handedness of the sunspot field, and the vertical shear change was mostly positive because the increase of the sunspot field's inclination during the flare dwarfed the decrease in inclination in the northern outer parts of the spot.
The flare-related magnetic changes in this sunspot stand out from those in Section 4 and Appendices A–F in featuring a dominant strengthening of the horizontal perpendicular field component B⊥, a downward (negative) vertical Lorentz force change δFr, and increases in the overall magnetic shear S and in the absolute horizontal and vertical shear ∣Sh∣ and ∣Sv∣. These changes are clearly not consistent with removal of magnetic twist during the flare as in the sunspots described in Section 4 and Appendices A–F. The difference may be due to the absence of a major, strong neutral line in this region. Here the sunspot umbra, instead of a strong neutral line as in the example in Section 4 and those in Appendices A–F, appears to have been the focus of the flare-related photospheric magnetic changes. This may be why the changes in this umbra more closely resemble the changes at the main neutral lines and not those at the sunspots in the examples in Section 4 and Appendices A–F.
6. The Most Active Active Region of Cycle 24
NOAA AR 12673 produced the largest flare, in terms of GOES class based on peak 1–8 Å flux, of cycle 24. The region produced four X-class flares, including the X9.3 and X2.2 flares on September 6 and the X1.3 flare on September 7, all studied here, and an X8.2 limb event on September 10.
In early 2017 September NOAA AR 12673 transformed from a decaying active region, via very fast emergence of highly twisted flux (Sun & Norton 2017), to the most flare-productive region of cycle 24. Strong shear flows along the main neutral line pushed the negative-polarity flux toward the positive part of the delta sunspot to the north. The newly emerged flux's movement toward and rotation with respect to the preexisting sunspot were closely associated with the subsequent flare activity according to several studies (Yang et al. 2017; Verma 2018; Yan et al. 2018). Yang et al. (2017), seeking an explanation for NOAA AR 12673's flare productivity, concluded that the swift movement of newly emerged, twisted flux toward the preexisting sunspot distorted the new bipoles and that the resulting shearing and interaction with the older flux created a highly energized and topologically complex magnetic structure. In particular, a negative flux patch rotated near the neutral line and increased the shear in its field, leading to the X9.3 flare. Romano et al. (2018) described strong shearing flows and a significant displacement of the negative umbra of the delta spot before the flares.
Wang et al. (2018a) reported that there were very strong > 5 kG transverse fields in GST NIRIS Stokes profiles taken a few hours after the X9.3 flare. These were located along two sections of the main neutral line of NOAA AR 12673 corresponding to light bridges in GST NFI images: one on the main north–south section of the neutral line, and one at the end of the northern hook-shaped structure of the neutral line that was previously created by the newly emerged magnetic flux.
Using a 7 hr time series of HMI continuum intensity images, line-of-sight and vector magnetograms, and AIA 1600 Å, Verma (2018) found that the visible continuum emission differed for the X2.2 and X9.3 flares, the former showing localized flare kernels and the latter a much more spatially extended two-ribbon structure. The excess UV emission was similar during the two flares but also had more spatial extent during the X9.3 flare. The high level of continuum emission was also described by Romano et al. (2018). Goryaev et al. (2018) reported brightening and darkening of the extreme-ultraviolet corona associated with the X9.3 flare, as well as the X8.2 limb flare 4 days later.
Figure 5 shows the photospheric magnetic changes during the X2.2 flare in NOAA AR 12673 at 08:57 UT on 2017 September 6, according to the HMI vector magnetograms. In Figures 5–7 the black rectangles represent subfields of view that will be discussed in more detail in Section 8 and plotted in Figures 11–13. This was a complex active region whose bipole structure featured a very strong, curved, and sheared neutral line. Over most of its length the neutral line was oriented north–south, with positive flux to the west and negative flux to the east. The horizontal field Bh near the neutral line pointed northward along it, and so, with  pointing eastward across the neutral line,
  and the neutral-line field had dextral chirality. At the north end of the neutral line it took a hook-like eastward turn around a twisted negative flux structure, a complex structure created by the interaction of newly emerged and preexisting flux described above. The horizontal field Bh of this twisted structure had anticlockwise circulation, which with inward-pointing
  implies
  and dextral handedness.
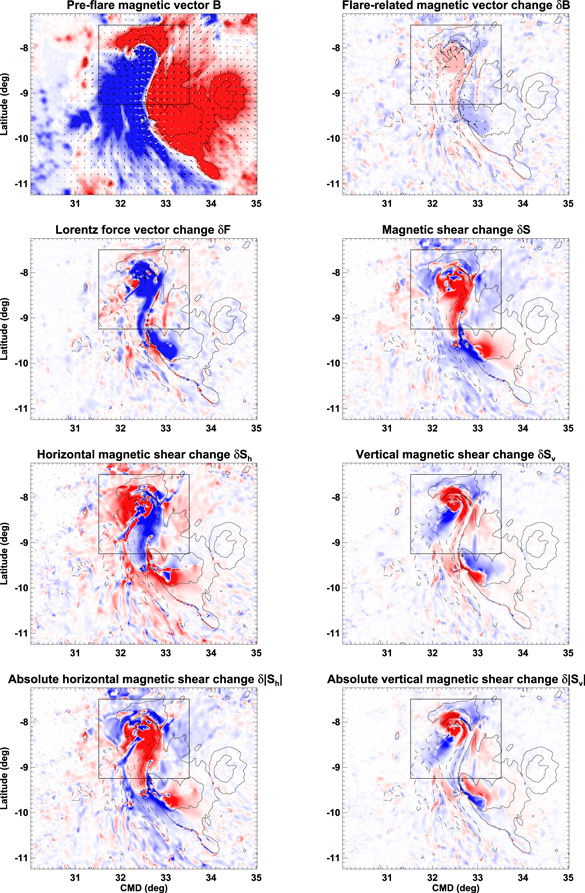
Figure 5. X2.2 flare on 2017 September 6 at 08:57 UT: pre-flare photospheric vector field B (top left), flare-related photospheric vector field change  (top right), Lorentz force vector change
  (second row, left), magnetic shear change δS (second row, right), horizontal magnetic shear change δSh (third row, left), vertical magnetic shear change δSv (third row, right), absolute horizontal shear change δ∣Sh∣ (bottom left), and absolute vertical shear change δ∣Sv∣ (bottom right). Red/blue coloring represents positive/negative value. All quantities saturate at ±1000 G, except the Lorentz force change
  , which saturates at ±104 dyn cm−2. Black arrows represent horizontal vector components; white arrows in the B plot represent the potential field Bp. The black solid/dashed contours show locations of positive/negative vertical magnetic flux density ±1 and ±2 kG. The black square shows the subarea plotted in Figure 11.
Download figure:
Standard image High-resolution image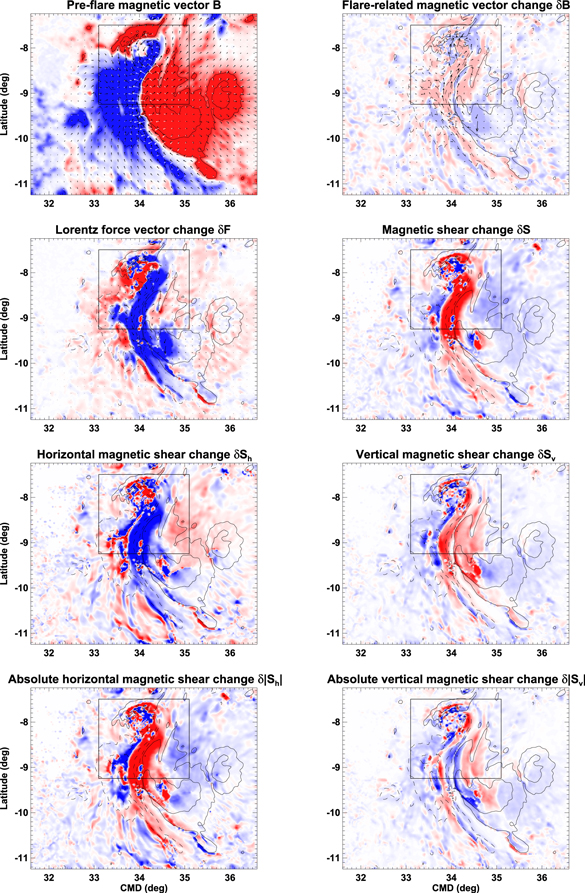
Figure 6. X9.3 flare on 2017 September 6 at 11:53 UT: pre-flare photospheric vector field B (top left), flare-related photospheric vector field change  (top right), Lorentz force vector change
  (second row, left), magnetic shear change δS (second row, right), horizontal magnetic shear change δSh (third row, left), vertical magnetic shear change δSv (third row, right), absolute horizontal shear change δ∣Sh∣ (bottom left), and absolute vertical shear change δ∣Sv∣ (bottom right). Red/blue coloring represents positive/negative value. All quantities saturate at ±1000 G, except the Lorentz force change
  , which saturates at ±104 dyn cm−2. Black arrows represent horizontal vector components; white arrows in the B plot represent the potential field Bp. The black solid/dashed contours show locations of positive/negative vertical magnetic flux density ±1 and ±2 kG. The black square shows the subarea plotted in Figure 12.
Download figure:
Standard image High-resolution image
Figure 7. X1.3 flare on 2017 September 7 at 14:20 UT: pre-flare photospheric vector field B (top left), flare-related photospheric vector field change  (top right), Lorentz force vector change
  (second row, left), magnetic shear change δS (second row, right), horizontal magnetic shear change δSh (third row, left), vertical magnetic shear change δSv (third row, right), absolute horizontal shear change δ∣Sh∣ (bottom left), and absolute vertical shear change δ∣Sv∣ (bottom right). Red/blue coloring represents positive/negative value. All quantities saturate at ±1000 G, except the Lorentz force change
  , which saturates at ±104 dyn cm−2. Black arrows represent horizontal vector components; white arrows in the B plot represent the potential field Bp. The black solid/dashed contours show locations of positive/negative vertical magnetic flux density ±1 and ±2 kG. The black square shows the subarea plotted in Figure 13.
Download figure:
Standard image High-resolution imageThe map for  in Figure 5 shows an unusually prominent pattern of vertical field change: δBr was generally positive/negative where Br was negative/positive, implying that a significant reduction of magnetic flux occurred during the flare. This is one of the few examples where δBr was comparable in size to
  , as we will discuss in more detail below. On the other hand,
  was approximately parallel to Bh along the neutral line and also in the negative twisted flux structure near the north end of the neutral line. We therefore find both a weakening of Br and a strengthening of Bh as a result of this flare.
Bearing Equation (6) in mind, it is therefore not surprising that δFr was large and negative along and near the neutral line, including the northern twisted negative flux structure, as shown in Figure 5. The peripheral regions (PRs) showed a mixture of weakly positive and negative δFr, and, in a departure from previous neutral-line flares,  was relatively weak even near the neutral line. The simple relations of Equations (17) and (18) do not generally apply in this case because
  was not dominant over δBr. Hence, the
  patterns were more complex than in previous cases. On the other hand, the δFr pattern happens to be simple here because the strengthening of Bh and the weakening of Br both tend toward a negative δFr in Equation (6).
The map of shear change in Figure 5 also shows patterns more complex than we have encountered so far. It is broadly true that the total shear and absolute horizontal shear generally increased near the neutral line during this flare, and the signed shear, already negative, became stronger. The total and absolute horizontal shear of the negative northern twisted structure also increased, but the signed horizontal shear change was positive there also because of the positive δBr reducing the vertical flux. The unusually strong δBr during this flare complicates interpretation of the signed horizontal shear change distribution, as well as the signed and absolute vertical shear change distributions. Near the neutral line and in the negative northern twisted flux structure, the signed vertical shear increased. However, the absolute vertical shear change was more complicated: it decreased along the neutral line but increased in the northern twisted flux structure.
The X9.3 flare at 11:53 UT on 2017 September 6 occurred following some fast evolution of NOAA AR 12673 following the X2.2 flare at 08:57 UT. The pre-flare field and flare-related magnetic changes are shown in Figure 6. Most of this evolution occurred in the vicinity of the hook-shaped part of the neutral line at its north end, where the flux distribution had been complicated by highly structured flux emergence and by fast (by photospheric standards) motions further tightening the hook-like turn of the neutral line. The  map for the X9.3 flare shows a much more prominent
  signal than for the previous flare, as well as a strong and complex δBr. The
  component pointed northward along the neutral line, strengthening Bh there, and had clockwise circulation in a part of the twisted negative flux structure at the north end of the neutral line, weakening Bh there. These
  patterns more closely resemble those of the other neutral line flares in this study than did those of the X2.2 flare. The δBr patterns, however, more closely resemble those of the previous X2.2 flare: negative/positive δBr in regions of positive/negative Br, consistent with a significant reduction in vertical magnetic flux.
The  profile for this flare in Figure 6 is also more consistent with the other flares involving neutral lines and sunspots in having strong downward δFr over a late area near the neutral line, surrounded by an extensive halo of weaker positive δFr, with the notable exception of a strong positive δFr signal at the northern twisted negative flux structure. Also
  pointed approximately parallel/antiparallel to the horizontal field along the positive/negative side of the neutral line and anticlockwise in the northern twisted negative flux structure. Much more so than for the X2.2 flare, the shear changes also conformed to the patterns for other flares in this study at least in the main north–south section of the neutral line. The total shear change and the absolute horizontal shear change, shown in Figure 6, were strong and positive along this part of the neutral line, but there were strong negative changes in the northern twisted negative flux structure besides weak halos of negative change in the PRs. There changes were mostly driven by signed horizontal shear changes, negative near the neutral line and positive in the northern twisted negative flux structure. The signed vertical shear change was positive near the neutral line and negative in the periphery, which is in line with changes during other neutral-line flares. However, in this case the absolute vertical shear change was highly structured: it decreased along most of the neutral line and over most of the PRs, but there were strips of absolute vertical shear increase on each side of the neutral line, and the change around the northern hook of the neutral lines was very complex and net-positive.
Figure 7 shows the magnetic changes for the X1.3 flare in NOAA AR 12673 on 2017 September 7. By this time the active region had weakened a little and the neutral line, still oriented north–south, curved and sheared, had weakened significantly at the north end, where much of the X9.3 flare-related change was concentrated. The strong northward axial field was still present along the neutral line. The plot for  shows a dominant horizontal field change much more confined to the vicinity of the neutral line than for the X9.3 and X2.2 flares. The horizontal field change
  pointed northward along most of the neutral line, strengthening Bh there. The south end of the neutral line behaved differently:
  pointed southeast there, weakening Bh.
The force-change map in Figure 7 is therefore dominated by a large downward δFr along most of the neutral line, except the south end, where δFr was positive. There was some weaker parallel/antiparallel  component on the positive/negative side of the neutral line. The force-change patterns, at least for the middle and northern sections of the main neutral line, indicate the usual patterns of increased magnetic pressure and released magnetic tension across the neutral line, described by Equations (6) and (7). There was a faint halo of positive δFr in the PRs, except in the positive flux to the southeast, where, as in the other two X-class flares in this region, δFr was negative.
Figure 7 shows that the total shear change and the absolute horizontal shear change were strong and positive along the neutral line, except at the south end, where they were negative, mostly because of a negative change in the signed horizontal shear over most of the neutral line and a positive change in the south. The vertical shear changes were concentrated along the neutral line, except for the south end. Along the middle and northern sections of the main neutral line, the signed vertical shear change was positive and flanked by negative changes, and the absolute vertical shear change was negative and flanked by positive changes.
The field changes observed in NOAA AR 12673 differ from others in this study in having been about as large and as organized in the vertical direction as in the horizontal directions. Figures 8–10 show that during each of the X2.2, X9.3, and X1.3 flares there were positive and negative spikes in δBr of approximately equal size to each other and as large as those in δB∥ and δB⊥. These δBr spikes were largest for the X9.3 flare and smallest during the X1.3 flare, which in several ways conformed to the behavior of the other neutral-line flares in this study.

Figure 8. X2.2 flare on 2017 September 6 at 08:57 UT: positive (red circles) and negative (blue crosses) vertical magnetic flux changes, parallel and perpendicular horizontal integrated field changes, vertical and horizontal parallel and perpendicular Lorentz force changes, and horizontal and vertical integrated magnetic shear changes, plotted against time over a 12 hr window centered on the published GOES start time of the flare. Also shown in each plot for comparison are 3σ error bars for the positive (red) and negative (blue) pre-flare variations.
Download figure:
Standard image High-resolution image
Figure 9. X9.3 flare on 2017 September 6 at 11:53 UT: positive (red circles) and negative (blue crosses) vertical magnetic flux changes, parallel and perpendicular horizontal integrated field changes, vertical and horizontal parallel and perpendicular Lorentz force changes, and horizontal and vertical integrated magnetic shear changes, plotted against time over a 12 hr window centered on the published GOES start time of the flare. Also shown in each plot for comparison are 3σ error bars for the positive (red) and negative (blue) pre-flare variations.
Download figure:
Standard image High-resolution image
Figure 10. X1.3 flare on 2017 September 7 at 14:20 UT: positive (red circles) and negative (blue crosses) vertical magnetic flux changes, parallel and perpendicular horizontal integrated field changes, vertical and horizontal parallel and perpendicular Lorentz force changes, and horizontal and vertical integrated magnetic shear changes, plotted against time over a 12 hr window centered on the published GOES start time of the flare. Also shown in each plot for comparison are 3σ error bars for the positive (red) and negative (blue) pre-flare variations.
Download figure:
Standard image High-resolution imageBecause of an eclipse, there were only a few HMI vector images immediately preceding the X2.2 flare, but Figure 8 includes a few hours of data from before the data gap. All three field component changes were significantly larger during the X2.2 flare than for the pre-flare data. However, though the changes in Br became small again between the X2.2 and X9.3 flares, the changes in B∥ and B⊥ were generally larger during this time than before the X2.2 flare but significantly smaller than they became during the X9.3 flare, as Figure 9 shows.
According to Figure 9, during the X9.3 flare there was a much larger negative than positive δB∥ spike mostly occurring at the northern hook of the neutral line. There was also a positive spike in δB⊥ mostly coming from this northern hook and also the south end of the neutral line, accompanied by a slightly larger negative spike in δB⊥ from the middle part of the neutral line.
Associated with each of the X2.2 and X9.3 flares was a dominant downward Lorentz force change δFr from the neutral line, as Figures 8 and 9 clearly show, accompanied by a smaller upward spike in δFr from the PRs and, particularly during the X9.3 flare, from the northern hook. There were smaller force changes in the two horizontal directions, evenly balanced in sign. Perpendicular Lorentz force changes δF⊥ at the neutral line (parallel/antiparallel to the sheared field vector on the positive/negative side of the neutral line) were less prominent during the X2.2 and X9.3 flares than during the other neutral-line flares in this study, including the X1.3 flare that occurred in the same active region the following day. Such force changes δF⊥ were only a little above the pre-flare level during the X2.2 flare. During the X2.2 and X9.3 flares, much of the horizontal force change  was confined, in a complex fashion, at the northern hook at the neutral line.
Figure 8 shows that during the X2.2 flare there was a negative horizontal shear change, mostly at the main northern part of the neutral line, and a slightly smaller positive spike from the northern hook, the south part of the neutral line and PRs. The vertical shear had a positive spike from the neutral line, including the northern hook, and a smaller negative spike from the PRs. Figure 9 shows that during the X9.3 flare there was a negative spike in the horizontal shear change, mostly from the main part of the neutral line, and a positive spike of approximately equal size from the northern hook and PRs. The vertical shear had a positive spike from the main neutral line and a negative spike of approximately equal size from PRs, accompanied by a complex mixture of changes at the northern hook.
Figure 10 shows that the X1.3 flare, distinct from the X2.2 and X9.3 flares, featured a negative spike in δB⊥ larger than in the other two field components (although the peak δBr value matches the peak δB⊥ value; the background changes in Br are higher, perhaps because of the larger contributions from Stokes Q and U at the position of this event relatively far from disk center). The δB∥ spikes barely rose above the background level. The large negative spike in δB⊥ represents most of the length of the neutral line, with a smaller positive spike in δB⊥ coming mostly from the south end of the neutral line.
Since the axial field along the neutral line initially pointed northward, this δB⊥ pattern produced a spatial split in the sign of δFr: a large negative spike in δFr from the main and northern parts of the neutral line and a smaller positive spike in δFr from the south end of the neutral line and the PRs. Unlike the previous two flares in this active region, but like most of the other neutral-line changes in this study, there was a clear signature in the δF⊥ spikes of parallel/antiparallel force change on the positive/negative side of the neutral line, representing a release of magnetic tension there, the changes on the negative side being slightly stronger. The δF∥ spikes were significantly smaller than the δF⊥ spikes, reflecting the relative simplicity of the magnetic changes during this flare compared to the X2.2 and X9.3 flares.
This simplicity also carries over to the shear changes shown in Figure 10. The horizontal shear changes had a large negative spike from the north part of the neutral line and a slightly smaller positive spike from the south part of the neutral line and the PRs. The vertical shear change had positive and negative spikes of approximately equal size, the former from the main part of the neutral line and the latter from the south part and the PRs. These spatial patterns were all much simpler than this during the two earlier X-class flares in this active region, the X2.2 and X9.3 flares on September 6.
7. Summary of the Magnetic Changes during the 15 X-class Flares
Table 2 summarizes the flare-related magnetic changes for all 15 flares, the five described in Sections 4–6 and the further 10 described in detail in Appendices A–F. For main neutral lines, TSs, and PRs the sign of the vertical Lorentz force change δFr, the overall shear change δS, and the changes in the signed and absolute horizontal and vertical shears are summarized. The vertical Lorentz force change δFr as a rule, with one exception, was directed downward near the main neutral line, if one existed in the region. The exception is the X2.2 flare on 2017 September 6 at 08:57 UT discussed in Section 6, where the δFr was directed approximately equally downward and upward near the main neutral line. In the PRs δFr was usually directed upward, except during the X2.2 flare on 2017 September 6 at 08:57 UT and the X1.5 flare on 2011 March 9 at 23:13 UT, where δFr was directed approximately equally in both directions. Table 2 clearly indicates that the behavior of  in sunspots appears to depend on whether or not a major neutral line was present. In sunspots neighboring a major neutral line, where δFr was generally directed downward, δFr was, in contrast, predominantly directed upward. In our single example of a major flare in a sunspot with no major neutral line present, the X1.6 flare on 2014 September 10 at 17:21 UT described in Section 5, δFr always was generally directed downward in that sunspot.
Table 2. Summary of Flare-related Magnetic Changes
| Flare Date | δFr | δS | Sh | δSh | δSv | δ∣Sh∣ | δ∣Sv∣ |
|---|---|---|---|---|---|---|---|
| and Peak Time | NL/TS/PR | NL/TS/PR | NL/TS/PR | NL/TS/PR | NL/TS/PR | NL/TS/PR | NL/TS/PR |
| 2011 Feb 15T01:56 | −/±/+ | +/−/− | +/+/+ | +/−/− | +/±/− | +/−/− | −/−/− |
| 2011 Mar 9T23:23 | −/ /± | +/−/± | +/ /± | +/−/± | −/ /− | +/ /± | −/ /− |
| 2011 Sep 6T22:16 | −/+/+ | +/−/− | +/+/+ | +/−/− | +/−/− | +/−/− | ±/−/− |
| 2011 Sep 7T22:38 | −/+/+ | +/−/− | +/+/+ | +/−/− | +/−/− | +/−/− | −/−/− |
| 2012 Mar 7T00:24 | −/ /+ | +/ /− | −/ /− | −/ /+ | +/ /− | +/ /− | −/ /− |
| 2013 Nov 5T22:12 | −/ /+ | +/ /− | +/ /+ | +/ /− | +/ /− | +/ /− | −/ /− |
| 2013 Nov 8T04:26 | −/+/+ | +/−/− | +/+/+ | +/−/− | +/−/− | +/−/− | ±/−/− |
| 2014 Mar 29T17:48 | −/ /+ | +/ /− | +/ /+ | +/ /− | +/ /− | +/ /− | −/ /− |
| 2014 Sep 10T17:45 | /−/+ | /+/− | /−/− | /−/+ | /+/− | /+/− | /+/− |
| 2014 Nov 7T17:26 | −/ /+ | +/ /− | +/ /+ | +/ /− | +/ /− | +/ /− | −/ /− |
| 2014 Dec 20T00:28 | −/ /+ | +/ /− | +/ /+ | +/ /− | +/ /− | +/ /− | −/ /− |
| 2015 Mar 11T16:22 | −/+/+ | +/−/− | +/+/+ | +/−/− | +/−/− | +/−/− | ±/−/− |
| 2017 Sep 6T09:10 | −/ /± | ±/ /− | −/−/− | ±/ /+ | ±/ /± | ±/ /± | ±/ /± |
| 2017 Sep 6T12:02 | −/ /+ | +/ /− | −/−/− | −/ /+ | +/ /− | +/ /± | ±/ /− |
| 2017 Sep 7T14:36 | −/ /± | +/ /− | −/ /− | −/ /+ | +/ /− | +/ /± | ±/ /− |
Note. The signs of the flare-related changes in the vertical Lorentz force δFr, the overall shear δS, and the changes in the signed and absolute horizontal and vertical shears are given separately for main neutral lines (NL), twisted sunspots (TS), and peripheral regions (PR) of each flaring region, where applicable.
Download table as: ASCIITypeset image
If a region had a main neutral line, then the shear change δS was positive, again with the single exception of the X2.2 flare on 2017 September 6, which had shear increases and decreases in similar quantities. Wherever a sunspot neighbored a major flaring neutral line, δS was mostly negative in that sunspot. However, in the X1.6 flare on 2014 September 10, the case of a sunspot with no major neutral line present, δS was positive in the penumbral region and negative in the periphery. In the PRs of all flares except the X1.5 flare on 2011 March 9, δS was mostly negative. For this X1.5 flare δS had no clear sign preference.
The patterns of the change δSh in the horizontal shear Sh, a signed quantity, followed the patterns of the change δS in the overall shear S, an unsigned quantity, for sinistral fields Sh > 0 and were of opposite sign for dextral fields Sh < 0, indicating the dominance of the horizontal shear in the overall shear. In contrast, the change δSv in the vertical shear Sv, also a signed quantity, had no apparent dependence on the handedness of the field. At all major flaring neutral lines, with the usual exception of the X2.2 flare on 2017 September 6, δSv was positive, consistent with a more horizontal post- than pre-flare field. The δSv profile near the neutral line for the X2.2 flare on 2017 September 6 was of mixed sign. For the X1.6 flare on 2014 September 10, the case of a sunspot with no major neutral line present, δSv was also positive in that sunspot. In all sunspots neighboring major neutral lines, δSv was predominantly negative. In all PRs δSv was negative except for the X2.2 flare on 2017 September 6, whose δSv was of mixed sign.
The above pattern, of positive δSh at the center of the flaring region, whether the main flaring neutral line or, absent such a feature, the lone sunspot, and negative δSh in the sunspots neighboring the main neutral line (if present) and the PRs, seems to be very general. It seems to indicate that the downward collapse of closed magnetic structure, associated with the loss of free magnetic energy by Hudson (2000) and Hudson et al. (2008), generally plays a prominent role in flares. The other general pattern, of horizontal shear increasing in magnitude at the center of regions but decreasing in PRs, indicates that this downward collapse of closed magnetic structure increases the magnetic stress in the photospheric field at the center of the action, whereupon the PRs can relax in response.
The change δ∣Sh∣ in the unsigned horizontal shear ∣Sh∣ was mostly positive near major neutral lines, with the usual exception of the X2.2 flare on 2017 September 6, which had shear increases and decreases in similar quantities. Wherever a sunspot neighbored a major flaring neutral line, δ∣Sh∣ was mostly negative in that sunspot. However, in the X1.6 flare on 2014 September 10, with the lone sunspot with no major neutral line present, δ∣Sh∣ was positive in the penumbral region and negative in the periphery. In the PRs of most of the flares δS was mostly negative, the exceptions being the X1.5 flare on 2011 March 9 and all three flares occurring in NOAA AR 12673 during 2017 September, whose δ∣Sh∣ were of mixed sign.
The change δ∣Sv∣ in the unsigned vertical shear ∣Sv∣ was negative near most of the major neutral lines studies but had mixed sign for a significant minority of them: the X2.1 flare on 2011 September 6, the X1.1 flare on 2013 November 8, the X2.1 flare on 2015 March 11, and all three flares occurring in NOAA AR 12673 during 2017 September, whose δ∣Sv∣ were of mixed sign. The δ∣Sv∣ of sunspots neighboring major neutral lines also were negative, whereas the δ∣Sv∣ in the lone sunspot of the X1.6 flare on 2014 September 10 had mostly positive δ∣Sv∣. This behavior of δ∣Sv∣ in sunspots, neighboring major neutral lines or not, therefore contrasts with the behavior of the other shear parameter changes in these sunspots, whose changes generally had opposite sign to the changes in neighboring neutral lines or had sign agreeing with neutral-line changes if no major neutral line is present. The behavior of δ∣Sv∣ in PRs was much simpler: δ∣Sv∣ was negative except for the X2.2 flare on 2017 September 6, whose peripheral δ∣Sv∣ had mixed sign.
The fact that the entries in the δ∣Sv∣ column of Table 2 are mostly negative, with some of mixed sign but no positive contribution, indicates that we have a mixture of flares whose vertical shear was systematically reduced and flares whose vertical shear was merely rearranged. The results for δ∣Sv∣ contrast with the results for δ∣Sh∣ in that the mixture of sign is much greater in the δ∣Sh∣ whereas the δ∣Sv∣ results in most cases have a pronounced negative bias. There patterns suggest that (1) vertical shear is generally easier to remove than horizontal shear and (2) it is not possible in every case to reduce the vertical shear everywhere.
There is no obvious link between a region's failure to remove magnetic shear, horizontal or vertical, during a flare and the region's flare productiveness. However, it is notable that NOAA AR 12673 was both the most flare-productive active region of the cycle and one of the least successful in removing magnetic shear during flares according to Table 2. Unlike the other regions in this study, however, this failure seems to be connected to the significant reduction of vertical magnetic flux during the three X-class flares. We explore this topic further in the next section.
From conservation of momentum a link between the eruptiveness of flares and their associated vertical Lorentz force changes may have been expected. Harra et al. (2016) found only one feature consistently associated with eruptive flares: coronal dimming in spectral bands representing the 1–2 MK temperature range of the quiescent corona. Of the flares studied here, they analyzed 10 and found those in NOAA AR 11158, 11283, 11429 and 12158 to be eruptive and those in NOAA AR 11166, 11890, 12017, and 12205 to be noneruptive. The eruptive flares in our sample tend to have larger downward vertical Lorentz force changes, but there is significant overlap between the eruptive and noneruptive flares in this regard. The sizes of the active regions vary greatly. Furthermore, the patterns of force density change do not distinguish the eruptive from the noneruptive flares.
8. Bald Patches in NOAA AR 12673
For significant removal of photospheric magnetic flux to occur during a flare, flux initially crossing the photospheric surface must abruptly cease to do so. Flux must either reconnect with flux of opposite polarity, with the resulting Ω- and U-shaped loops subjected and ejected away from the photosphere, or move out of the surface layer. The former is difficult to achieve during a flare in the quantities observed during the X-class flares in NOAA AR 12673, but the latter is possible if the photospheric field has a specific topological structure.
NOAA AR 12673 was unique among the active regions studied here, though not unique among the active regions of cycle 24 (Jiang et al. 2017), in featuring significant "bald patches," topological features of the field where the field lines cross the neutral line from negative to positive polarity instead of the usual crossing from positive to negative. A bald patch must therefore form a U shape at the neutral line, grazing the photosphere at the neutral line. Because the field is approximately line tied at the photosphere, a bald-patch field line is topologically distinguished in being anchored not only at its usual footpoints but also at the bald patch. The bald-patch field lines therefore collectively form a separatrix surface across which the field-line linkage is discontinuous. Only bald patches can define magnetic separatrices without coronal magnetic null points. At bald-patch separatrix surfaces, current sheets tend to form from photospheric shearing motions or flux emergence, and thus significant reconnection can occur.
The mathematical condition on B = (Br, Bθ, Bϕ) for a bald patch is (Titov et al. 1993)

so that the direction of increasing vertical field value Br across the neutral line, from negative to positive, must match the direction of the horizontal field.
Figures 11–13 show the photospheric locations of bald patches of NOAA AR 12673, where each pre-flare field B satisfies Equation (23) at the main neutral line, for the three X-class flares discussed in Section 6. The fields of view covered by Figures 11–13 are represented by the black rectangles in Figures 5–7. In Figures 11–13 the bald-patch locations are overplotted on maps of the same quantities shown in Figures 5–7, zoomed in to a smaller field of view. During the first two flares, there were two main locations of bald-patch magnetic topology: a very complex structure at the apex of the hook-shaped part of the neutral line at its north end around (32 5, −8°) in Figure 11 and around (34°, −8°) in Figure 12, and a more elongated structure along the main neutral line around (327, −85) in Figure 11 for the X2.2 flare and around (3425, −84) in Figure 12 for the X9.3 flare. A small bald patch was also found far to the south of the heart of the active region, south of −11° latitude, but this bald patch did not seem to participate significantly in either flare. In Figure 13 for the X1.3 flare the bald-patch structure extends along the main neutral line from (484, −825) to (482, −89), but the field vector only satisfies Equation (23) at some but not all locations within this section of the main neutral line.
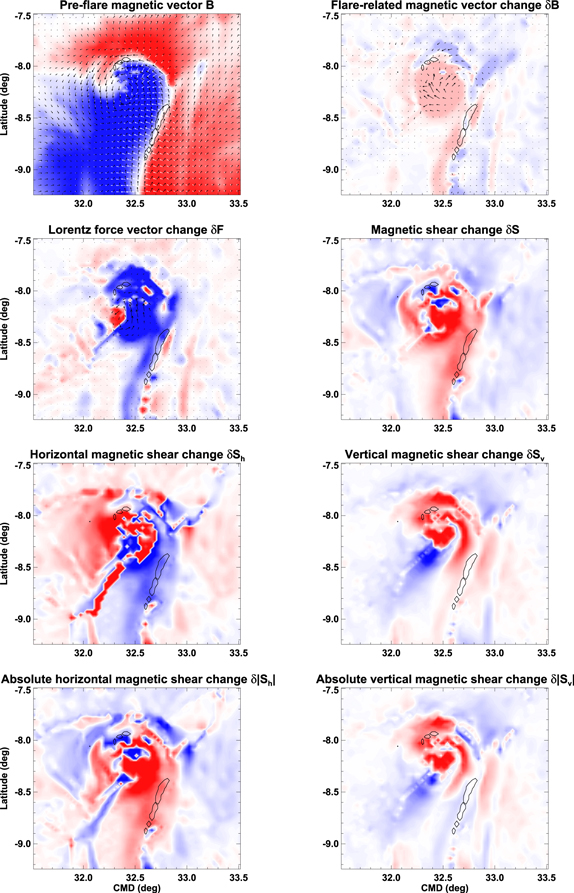
Figure 11. X2.2 flare on 2017 September 6 at 08:57 UT: pre-flare photospheric vector field B (top left), flare-related photospheric vector field change  (top right), Lorentz force vector change
  (second row, left), magnetic shear change δS (second row, right), horizontal magnetic shear change δSh (third row, left), vertical magnetic shear change δSv (third row, right), absolute horizontal shear change δ∣Sh∣ (bottom left), and absolute vertical shear change δ∣Sv∣ (bottom right). Red/blue coloring represents positive/negative value. All quantities saturate at ±2000 G, except the Lorentz force change
  , which saturates at ±2 × 10⁴ dyn cm−2. Black arrows represent horizontal vector components; white arrows in the B plot represent the potential field Bp. Black closed solid curves indicate the locations of bald-patch structure on the neutral line.
Download figure:
Standard image High-resolution image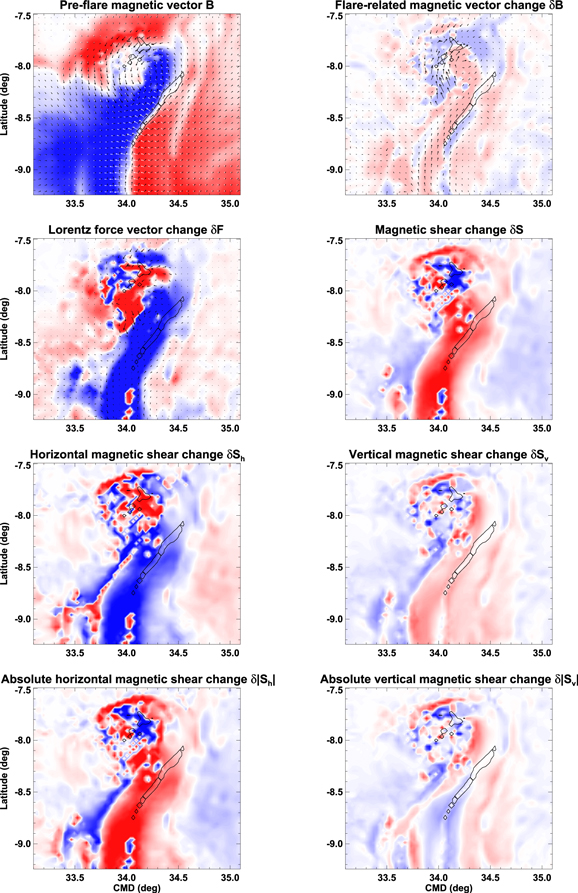
Figure 12. X9.3 flare on 2017 September 6 at 11:53 UT: pre-flare photospheric vector field B (top left), flare-related photospheric vector field change  (top right), Lorentz force vector change
  (second row, left), magnetic shear change δS (second row, right), horizontal magnetic shear change δSh (third row, left), vertical magnetic shear change δSv (third row, right), absolute horizontal shear change δ∣Sh∣ (bottom left), and absolute vertical shear change δ∣Sv∣ (bottom right). Red/blue coloring represents positive/negative value. All quantities saturate at ±2000 G, except the Lorentz force change
  , which saturates at ±2 × 10⁴ dyn cm−2. Black arrows represent horizontal vector components; white arrows in the B plot represent the potential field Bp. Black closed solid curves indicate the locations of bald-patch structure on the neutral line.
Download figure:
Standard image High-resolution image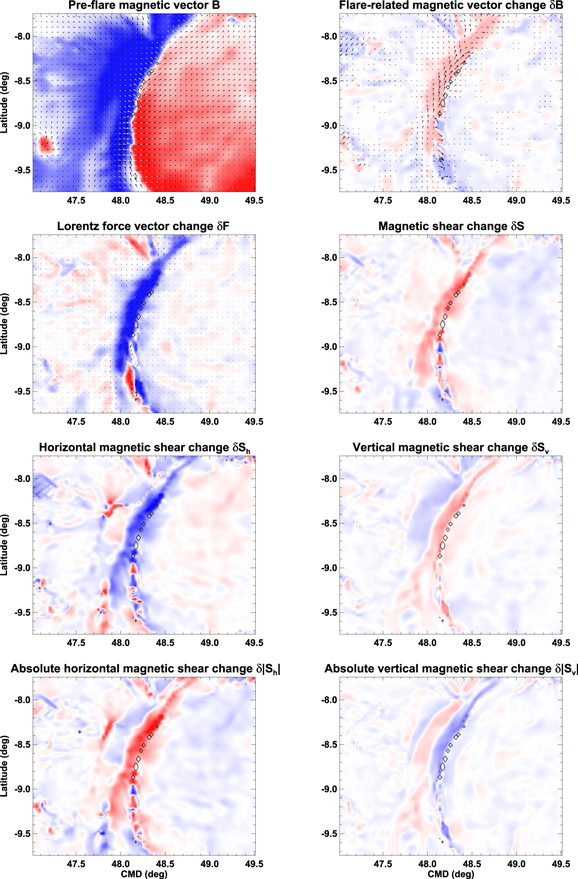
Figure 13. X1.3 flare on 2017 September 7 at 14:20 UT: pre-flare photospheric vector field B (top left), flare-related photospheric vector field change  (top right), Lorentz force vector change
  (second row, left), magnetic shear change δS (second row, right), horizontal magnetic shear change δSh (third row, left), vertical magnetic shear change δSv (third row, right), absolute horizontal shear change δ∣Sh∣ (bottom left), and absolute vertical shear change δ∣Sv∣ (bottom right). Red/blue coloring represents positive/negative value. All quantities saturate at ±2000 G, except the Lorentz force change
  , which saturates at ±2 × 10⁴ dyn cm−2. Black arrows represent horizontal vector components; white arrows in the B plot represent the potential field Bp. Black closed solid curves indicate the locations of bald-patch structure on the neutral line.
Download figure:
Standard image High-resolution imageThe magnetic changes near the bald patches shown in Figure 11 have in common a general weakening of the vertical field component and only small changes in the horizontal component. At the northern bald patch, around (325, −8°), the vertical force change δFr was negative on both sides of the neutral line and the shear change δS was negative. This negative shear change covered an area including the bald patch, one of several areas of negative δS near this hook-like northern part of the neutral line within an extended region of positive δS around the neutral line. Because of the weakening of Br near this bald patch, with little change in Bh, δSv and δ∣Sv∣ were both positive. Independent of the weakening of Br, δSh was positive and δ∣Sh∣ negative because δBh, while small, still relieved some of the shear of Bh.
Meanwhile at the southern bald patch in Figure 11, around (327, −85), the vertical force change δFr was negative on the negative east side of the neutral line and positive on the positive west side. Unlike at the northern bald patch, in the southern bald patch the shear S increased (δS > 0) during the flare, on both sides of the neutral line, and the negative horizontal shear increased in strength (δSh < 0) during the flare. There was a weak increase δ∣Sv∣ in vertical shear but a decrease δ∣Sv∣ in absolute vertical shear: the tilt of B with respect to Bp increased, resulting in a tilt of B closer to that of Bp.
Compared to the magnetic changes near the bald patches shown in Figure 11, the changes near the bald patches in Figure 12 again show a pattern of general weakening in the vertical field component, but this time the horizontal component changed significantly. At the north bald patch near (34°, −8°) the horizontal field change  pointed in the direction opposite to Bh and weakened the horizontal field there. At the southern bald patch near (3425, −84)
  pointed in the same direction as Bh, strengthening the horizontal field there. According to Equation (17), these horizontal field changes produced a positive (upward) Lorentz force change δFr at the northern bald patch and a negative (downward) δFr at the southern bald patch. The horizontal field changes also produced a negative shear change δS at the northern bald patch and a positive δS at the southern bald patch. These shear changes were driven by the horizontal shear changes δSh, which, according to Equation (20), decreased in size at the northern bald patch and increased in size at the southern bald patch. The vertical shear changes δSv were much smaller. The vertical shear change δSv was negative at the northern bald patch and positive at the southern bald patch, consistent with the increased/decreased tilt at the southern/northern bald patch. The absolute vertical shear change δ∣Sv∣ followed this pattern except that the southern half of the southern bald patch had a negative δ∣Sv∣ because of the reduction of
  on both sides of the neutral line there and consequent change in the tilt γp of Bp.
The magnetic changes shown in Figure 13 for the X1.3 flare on September 7 are much simpler than those for the other two flares because the active region had simplified greatly by this time. Nevertheless, significant bald-patch structure was still present. The magnetic changes in the bald-patch region of the neutral line were the same as the neighboring changes: the vertical component was weakened on both sides of the neutral line but more so on the negative east side, and the downward Lorentz force change was much stronger on this negative east side of the neutral line. The shear changes were also slightly larger on the east side. This asymmetry suggests that the topological divide created by the bald patch may have influenced the magnetic changes during the flare.
A key difference between the flare-related magnetic changes in NOAA AR 12673 and those in the other flaring regions in this study is that the changes to Br seem to have been much more significant in NOAA AR 12673 than in the other regions. A change in the radial magnetic flux of a region during a flare seems to be more likely to occur near a bald patch than elsewhere because of the possibility of a magnetic structure that grazes the photospheric layer before the flare ceasing to do so as a result of the flare, producing a significant, detectable change in the magnetic flux distribution through the layer. That the vertical field changes near the bald patches during all three flares took the form of a general weakening of the vertical field component only supports this idea.
Table 3 summarizes the flare-related magnetic changes near the bald patches in NOAA AR 12673 during each of the three X-class flares occurring in that region. What sets the X9.3 flare apart from the others is the reduction in magnetic shear, in both horizontal and vertical directions, near the northern bald patch during that flare. We do not see a reduction in both ∣Sh∣ and ∣Sv∣ in any other significant structure of this flaring region or any other region in this study. The shear reduction is accompanied by an upward Lorentz force and a reduction of  .
.
Table 3. Summary of Flare-related Magnetic Changes near Bald Patches of NOAA AR 12673
| Flare Date and Bald Patch | δ∣Br∣ | δFr | δS | δSh | δSv | δ∣Sh∣ | δ∣Sv∣ |
|---|---|---|---|---|---|---|---|
| 2017 Sep 6T09:10 NBP | − | − | − | + | + | − | + |
| 2017 Sep 6T09:10 SBP | ± | ± | + | − | + | + | − |
| 2017 Sep 6T12:02 NBP | − | + | − | + | − | − | − |
| 2017 Sep 6T12:02 SBP | ± | − | + | − | + | + | ± |
| 2017 Sep 7T14:36 BP | − | − | + | − | + | + | − |
Note. Signs of the flare-related magnetic changes near the bald patches of NOAA AR 12673 during the three X-class flares on 2017 September 6–7: the unsigned vertical field strength δ∣Br∣, the vertical Lorentz force δFr, the overall shear δS, and the changes in the signed and absolute horizontal and vertical shears. For the flares on September 6, "NBP" and "SBP" signify the northern and southern bald patches discussed in the text and shown in Figures 11 and 12, and for the September 7 flare "BP" refers to the remaining bald patch shown in Figure 13.
Download table as: ASCIITypeset image
Comparing Figures 11 and 12, during the earlier X2.2 flare at 08:57 UT the northern bald patch had magnetic structure clearly resembling its structure during the later X9.3 flare, but crucially the horizontal field component Bh appears to have changed much less there during this flare than during the later one. Therefore, though the vertical component underwent a significant reduction in strength during both flares, during the earlier one this reduction was dominant in producing both a downward Lorentz force change, created by the weakening of the U-shaped bald-patch field's upward magnetic tension force, and a reduction in overall magnetic shear. The earlier flare produced a decrease of horizontal shear and an increase of vertical shear, a reversal of the usual pattern found near the neutral lines studied in this paper, whereas the more powerful X9.3 flare released shear in both the horizontal and vertical directions near this bald patch. This later flare's weakening of the horizontal field was also associated with a positive change in the vertical Lorentz force that overcame the weakening of upward magnetic tension to produce a net-upward Lorentz force change.
The southern bald patch underwent magnetic changes during the X9.3 flare (Figure 12) that were much more characteristic of the other neutral lines studied in this paper: a downward Lorentz force change and an increase in ∣Sh∣, though the increase in Sv only produced the usual decrease in ∣Sv∣ at the south part of this bald patch, where Br decreased on both sides of the neutral line. In the northern part of this southern bald patch where the change of  was asymmetric across the neutral line, a weakening to the east and a strengthening to the west, both Sh and ∣Sh∣ increased. The magnetic changes at the southern bald patch during the X2.2 flare were yet more similar to the other neutral lines studied in this paper: a downward Lorentz force change and an increase in ∣Sh∣, including an increase in ∣Sh∣, and the usual increase in Sv and decrease in ∣Sv∣.
Figure 13 shows that by the time of the X1.3 flare on September 7 the northern bald patch had disappeared and the magnetic changes at the remaining bald patch conformed to the usual pattern for neutral line flares: a downward Lorentz force change and an increase in S dominated by an increase in ∣Sh∣, and an increase in Sv that represents a relaxation of vertical shear and a decrease in its modulus ∣Sv∣.
The most powerful flare in NOAA AR 12673 (and this paper) therefore featured the only example of a structure where both the horizontal and vertical shears were relaxed: the northern bald patch.
9. Conclusion
This overview of magnetic changes during 15 cycle 24 X-class flares demonstrates common patterns of behavior among diverse magnetic structures. Most of these flares occurred near strong, highly sheared magnetic neutral lines, i.e., neutral lines where the vertical field component was strong on each side and the horizontal component was strong and sheared. The neutral lines varied greatly in complexity: some were straight, some curved, and some had switchback or peninsular structure. Furthermore, one flare of the sample did not feature a strong neutral line but was centered instead on the twisted field of a unipolar sunspot.
Among this diversity of magnetic structure there was remarkable similarity in the responses of the fields to the flares. We anticipated in Section 1 evidence of magnetic implosion near major neutral lines and of magnetic twist removal in sunspots. The picture that emerged was different. It turns out that the flaring regions in this study, despite their diverse morphologies and different magnetic handedness and symmetry properties and neutral line/sunspot structure, do indeed conform to common patterns of behavior. In every case the central structure, whether a neutral line or a sunspot, underwent an abrupt downward Lorentz force change and an increase in magnetic shear during the flare, usually accompanied by a weaker upward Lorentz force and a smaller decrease in magnetic shear in neighboring or PRs. The central shear increase was generally dominated by a strengthening of the horizontal shear. In most cases the vertical shear decreased over most of the active region, consistent with magnetic relaxation in that dimension.
These patterns suggest that vertical photospheric shear is often relaxed during major flares, whereas horizontal photospheric shear is often increased by a collapse of structure at the heart of the flaring region. These patterns of change in magnetic shear tended to be associated with changes in the horizontal component of the magnetic field rather than the vertical component. During most of the flares, changes in the vertical field component were smaller, less organized, and less significant to the region overall. The notable exceptions to this rule occurred in NOAA AR 12673, host of the most powerful flare of cycle 24, whose photospheric magnetic changes were analyzed in detail here. During the three X-class flares in NOAA AR 12673 studied, the changes in the vertical field component were significant in size and well organized over large areas.
The key difference between NOAA AR 12673 and the other flaring regions in this study appears to have been the presence of magnetic bald patches in NOAA AR 12673, locations at neutral lines where the horizontal component points from the negative to the positive side, such that the field lines must graze the photosphere in a U-shaped configuration. This particular field structure appears especially capable of producing significant changes in the vertical flux distribution: its flux is susceptible to being removed from the photospheric surface layer from which the observations derive. The fact that NOAA AR 12673 was the only region of this sample of 11 flaring regions to feature significant bald-patch structure, and was also the only one of the sample to undergo an abrupt, widespread weakening of magnetic flux near its main neutral line during flares, suggests that the bald-patch field structure may have been central to its magnetic restructuring during these flares.
The nature of the magnetic changes at the bald patches themselves also appears to suggest why this region produced such powerful flares. The free magnetic energy [B2 − (Bp)2]/(8π) of the coronal magnetic field B is believed to be the reservoir of energy that powers major flares. During most flares, this energy release seems to involve the simplification and collapse of a coronal loop system toward the photosphere, producing a stronger horizontal photospheric field and enhanced magnetic shear near the neutral line, accompanied by a downward Lorentz force change. Departing from the usual pattern of downward Lorentz force change and increasing shear, during each of the two September 6 X-class flares the northern bald patch of NOAA AR 12673 underwent a reduction in magnetic shear, and during the X9.3 flare on that day both the horizontal and vertical shears were reduced, accompanied by an upward Lorentz force change. This pattern of behavior, especially during the X9.3 flare, indicates a degree of magnetic relaxation unique in this study and may indicate a much greater reduction in free magnetic energy at this bald patch than at the other structures studied in this paper.
A possible explanation is that the presence of a bald patch may allow fields line tied to the photosphere to break their connection to the photosphere there. An active region with bald-patch structure where fields may become disconnected from the photosphere during a flare has more scope for magnetic reconfiguration than a flaring region whose fields remain line tied to the photosphere. These greater possibilities for magnetic reconfiguration may allow access to significantly more free magnetic energy to power the flare. The bald-patch structure of NOAA AR 12673 may therefore lead to an explanation of the energy source of this most powerful flare of cycle 24. We have only one observation of this form of magnetic restructuring in this sample, and more observations of flare-related field changes at bald patches during powerful flares are needed to confirm the link between this particular type of abrupt magnetic change and great energy release during a flare.
I thank the referee for constructive comments. This work was supported by NASA grant NNX14AE05G to the National Solar Observatory. SDO is a mission for NASA's Living with a Star program. SDO data are courtesy of NASA/SDO and the HMI science teams.
Facility: SDO (HMI). - Solar Dynamics Observatory
Appendix A: Two More Flares Involving Sheared Neutral Lines and Twisted Sunspots
Figures 14 and 15 show the pre-flare photospheric magnetic vector field, magnetic vector field change, Lorentz force vector field change, and magnetic shear changes in NOAA AR 11283 during the X2.1 flare on 2011 September 6 and the X1.8 flare on 2011 September 7. Similar to NOAA AR 11158 discussed in Section 4, NOAA AR 11283 had a strong, sheared neutral line bracketed by two sunspots. In NOAA AR 11283 the neutral line oriented along the east–west direction, as in NOAA AR 11158, but in NOAA AR 11283 the positive magnetic flux was to the north and the negative flux to the south. There were other key differences. Near the neutral line of NOAA AR 11283, the horizontal field Bh also pointed parallel to the neutral line, but westward rather than eastward. In NOAA AR 11283 the southern negative sunspot was significantly larger than the northern positive sunspot, and the magnetic twist was more obvious in the northern spot than in the southern spot, whereas the two sunspots of NOAA AR 11158 were approximately evenly sized and twisted.

Figure 14. X2.1 flare on 2011 September 6 at 22:12 UT: pre-flare photospheric vector field B (top left), flare-related photospheric vector field change  (top right), Lorentz force vector change
  (second row, left), magnetic shear change δS (second row, right), horizontal magnetic shear change δSh (third row, left), vertical magnetic shear change δSv (third row, right), absolute horizontal shear change δ∣Sh∣ (bottom left), and absolute vertical shear change δ∣Sv∣ (bottom right). Red/blue coloring represents positive/negative value. All quantities saturate at ±1000 G, except the Lorentz force change
  , which saturates at ±104 dyn cm−2. Black arrows represent horizontal vector components; white arrows in the B plot represent the potential field Bp. The black solid/dashed contours show locations of positive/negative vertical magnetic flux density ±1 and ±2 kG.
Download figure:
Standard image High-resolution image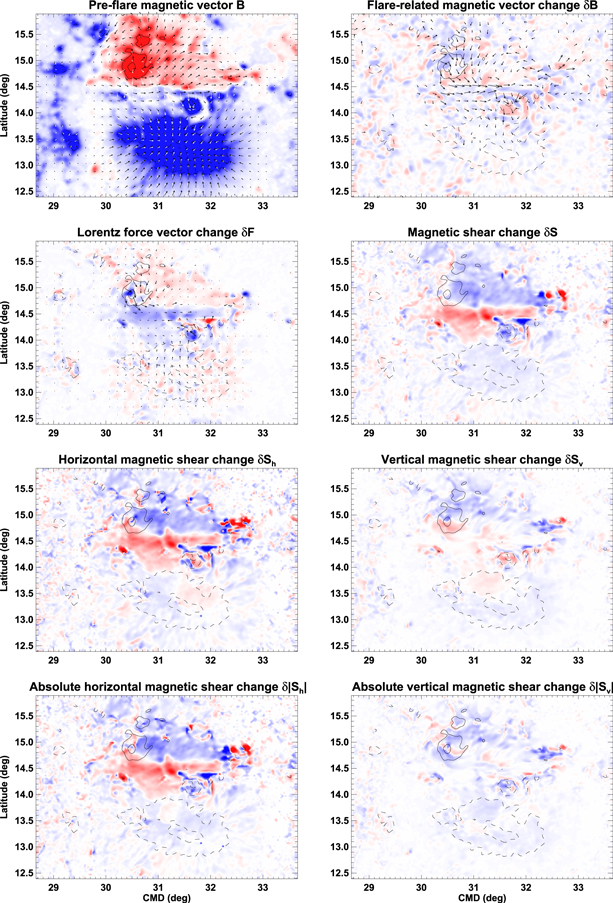
Figure 15. X1.8 flare on 2011 September 7 at 22:32 UT: pre-flare photospheric vector field B (top left), flare-related photospheric vector field change  (top right), Lorentz force vector change
  (second row, left), magnetic shear change δS (second row, right), horizontal magnetic shear change δSh (third row, left), vertical magnetic shear change δSv (third row, right), absolute horizontal shear change δ∣Sh∣ (bottom left), and absolute vertical shear change δ∣Sv∣ (bottom right). Red/blue coloring represents positive/negative value. All quantities saturate at ±1000 G, except the Lorentz force change
  , which saturates at ±104 dyn cm−2. Black arrows represent horizontal vector components; white arrows in the B plot represent the potential field Bp. The black solid/dashed contours show locations of positive/negative vertical magnetic flux density ±1 and ±2 kG.
Download figure:
Standard image High-resolution imageOn the other hand, there are further key similarities between NOAA AR 11283 and NOAA AR 11158. Near the neutral line, Bh pointed westward and  pointed from the positive to the negative side, i.e., southward, and so the neutral-line field of NOAA AR 11283, like that of NOAA AR 11158, had sinistral chirality, though the two regions' neutral-line fields had approximately opposite directions. In the positive sunspot of NOAA AR 11283 at the northeast end of the neutral line, the horizontal field component Bh had anticlockwise circulation, and so the spot also had a field of sinistral chirality. Likewise, the negative sunspot had a Bh with clockwise, albeit weak, circulation, and since
  must point toward the center of the sunspot, we again have sinistral chirality, so that the neutral line and the two neighboring sunspots all had sinistral chirality in NOAA AR 11283 as in NOAA AR 11158.
The overall patterns of change in the magnetic field, Lorentz force, and magnetic shear in NOAA AR 11283 were therefore similar to those seen in NOAA AR 11158. The horizontal magnetic field change  was stronger in the horizontal than in the vertical component during both flares in NOAA AR 11283. The direction of
  was generally parallel to Bh near the neutral line and antiparallel to Bh in the two sunspots (this behavior is clearer in the northern spot than the southern spot). These changes in NOAA AR 11283, as in NOAA AR 11158, corresponded to downward vertical Lorentz force changes δFr near the neutral line and upward δFr in the two sunspots. They were also accompanied by clockwise horizontal Lorentz force changes
  in the two sunspots and parallel/antiparallel
  on the positive/negative side of the neutral line, again as in NOAA AR 11158.
Still following the pattern of NOAA AR 11158, these magnetic field and Lorentz force changes in NOAA AR 11283 were associated during each flare with an increase in magnetic shear near the neutral line and a decrease of magnetic shear in the two neighboring sunspots (see also Romano et al. 2015). This active region also had a field of sinistral chirality, and so the signed and absolute horizontal shear changes were both positive near the neutral line and predominantly negative in the two sunspots. The signed vertical shear change was also positive near the neutral line and mostly negative in the two sunspots, whereas the unsigned vertical shear change was mostly negative over the region, including the neutral line and both sunspots. Thus, apart from the opposite directions of the magnetic fields in NOAA AR 11158 and 11283, their patterns of magnetic behavior during their respective X-class flares were very consistent. The two regions were located in opposite hemispheres, NOAA AR 11158 in the southern hemisphere and NOAA AR 11283 in the northern hemisphere. They nevertheless shared the same sinistral chirality, contrary to the well-known hemispheric helicity rule, though their magnetic fields were distributed with opposite leading/trailing polarities according to Hale's law: NOAA AR 11158 had positive leading polarity, and NOAA AR 11283 had negative leading polarity. The Lorentz force and shear changes were independent of these differences.
As in NOAA AR 11158, Figures 16 and 17 show that the horizontal field changes in NOAA AR 11283 were larger than vertical field changes during both the X2.1 flare on September 6 and the X1.8 flare on September 7. The vertical field changes were approximately balanced in sign, but the horizontal parallel changes had a positive bias during both flares, especially during the X1.8 flare. This seems to have been mostly due to  pointing mostly southward near the east end of the main neutral line, with some contribution from the east side of the northern positive sunspot. During the X2.1 flare, the west side of this sunspot contributed a negative parallel field change. The largest field component change during each of the two flares was in the perpendicular component, as in the case of the X2.2 flare in NOAA AR 11158. There was a large positive δB⊥ near the neutral line strengthening the sinistral handedness of the field there, and a smaller negative δB⊥ in the two sunspots, weakening their sinistral handedness.
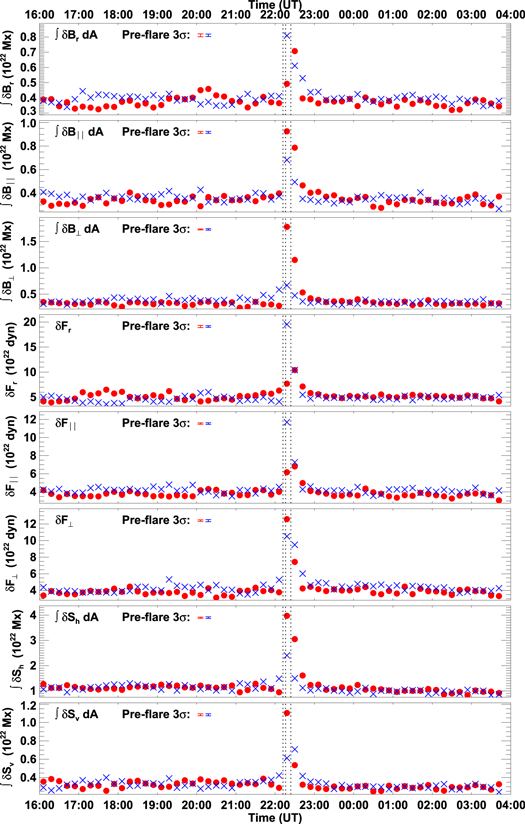
Figure 16. X2.1 flare on 2011 September 6 at 22:12 UT: positive (red circles) and negative (blue crosses) vertical magnetic flux changes, parallel and perpendicular horizontal integrated field changes, vertical and horizontal parallel and perpendicular Lorentz force changes, and horizontal and vertical integrated magnetic shear changes, plotted against time over a 12 hr window centered on the published GOES start time of the flare. Also shown in each plot for comparison are 3σ error bars for the positive (red) and negative (blue) pre-flare variations.
Download figure:
Standard image High-resolution image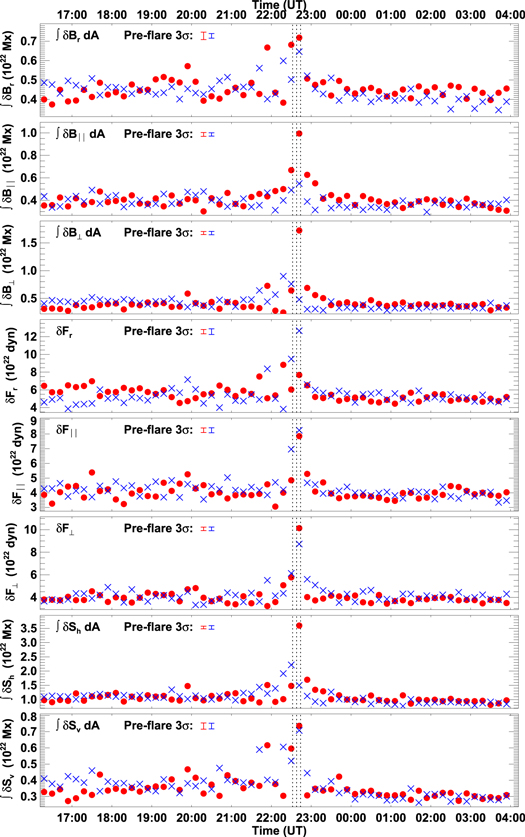
Figure 17. X1.8 flare on 2011 September 7 at 22:32 UT: positive (red circles) and negative (blue crosses) vertical magnetic flux changes, parallel and perpendicular horizontal integrated field changes, vertical and horizontal parallel and perpendicular Lorentz force changes, and horizontal and vertical integrated magnetic shear changes, plotted against time over a 12 hr window centered on the published GOES start time of the flare. Also shown in each plot for comparison are 3σ error bars for the positive (red) and negative (blue) pre-flare variations.
Download figure:
Standard image High-resolution imageThe largest Lorentz force change during each of these two flares was in the vertical direction, in both cases a dominant downward δFr near the neutral line accompanied by a smaller positive δFr in the sunspots. Again this matches the patterns in NOAA AR 11158 during the X2.2 flare. In NOAA AR 11283, unlike NOAA AR 11158, the parallel and perpendicular Lorentz force changes were of approximately equal size, but δF∥ had a marked negative (near the main neutral line, northward) bias, associated with the north–south asymmetry of the region's flux distribution about this neutral line. (This is the positive sign bias of δF⊥ for the X2.1 flare in Figure 6 of Petrie 2016, the main qualitative difference between the magnetic changes during this flare and those during the X2.2 flare in NOAA AR 11158. Note that the meanings of parallel and perpendicular differ between Petrie (2016) and this study.) The effect of this asymmetry is not so clear in the data for the X1.8 flare. The perpendicular force change δF⊥ was balanced in sign during both the X2.1 flare and the X1.8 flare in NOAA AR 11283, as in NOAA AR 11158 during its X2.2 flare. Likewise, the parallel/antiparallel horizontal force changes near the neutral line and the untwisting force changes in the two sunspots were approximately equal in the two polarities.
During both the X2.1 and X1.8 flares in NOAA AR 11283, the horizontal shear change had a dominant positive spike from near the neutral line and a smaller negative spike, still well above the background level, from the sunspots. The vertical shear change was similar to the horizontal for the X2.1 flare, whereas for the X1.8 flare the vertical shear change had smaller, noisier positive and negative changes of approximately equal sizes from the neutral line and the sunspots, respectively.
Appendix B: An Example with Dextral Chirality
Figure 18 shows an example of magnetic changes of more complex structure during an X5.4 neutral-line flare at 00:02 UT on 2012 March 6. As did Wang et al. (2014a), we found that the subsequent X-class flare in this region, an X1.3 flare at 01:05 UT, did not produce significant photospheric vector field changes as found in this X5.4 flare (Petrie 2012); hence, we focus here on the X5.4 flare. This active region, NOAA AR 11429, featured a very long, strong, well-defined magnetic neutral line along which most of the flare-related magnetic changes took place. However, the neutral line had much more complex field structure on each side than the main neutral lines of NOAA AR 11158 and 11283. Nevertheless, as in these previous examples, in this example the magnetic vector field near the neutral line was very sheared and was directed eastward and almost parallel to the neutral line, particularly the section pointing northeast along which most of the organized magnetic changes took place. The flux to the north of the neutral line was positive; hence,  must point southward across it, and so, unlike those of NOAA AR 11158 and 11283, the neutral-line field of this region had dextral chirality. The negative TS to the northeast of the plot also showed simple structure. There Bh had clear anticlockwise circulation, and since
  must point toward the center of the spot, this spot's twisted field, unlike those of NOAA AR 11158 and 11283, but like the neutral-line field of this region, also had dextral chirality. This relatively isolated negative TS was the only one with well-defined circulation. The horizontal fields of the other flux concentrations on both sides of the main neutral line seem to have been dominated by the shear patterns associated with the neutral line. The effects of the magnetic changes in this region were similar to those in the sinistral active regions already described. Near the neutral line
  was almost parallel to Bh, whereas in the sunspot
  was almost antiparallel to Bh, and δBr was not as strong and showed little organization.

Figure 18. X5.4 flare on 2012 March 7 at 00:02 UT: pre-flare photospheric vector field B (top left), flare-related photospheric vector field change  (top right), Lorentz force vector change
  (second row, left), magnetic shear change δS (second row, right), horizontal magnetic shear change δSh (third row, left), vertical magnetic shear change δSv (third row, right), absolute horizontal shear change δ∣Sh∣ (bottom left), and absolute vertical shear change δ∣Sv∣ (bottom right). Red/blue coloring represents positive/negative value. All quantities saturate at ±1000 G, except the Lorentz force change
  , which saturates at ±104 dyn cm−2. Black arrows represent horizontal vector components; white arrows in the B plot represent the potential field Bp. The black solid/dashed contours show locations of positive/negative vertical magnetic flux density ±1 and ±2 kG.
Download figure:
Standard image High-resolution imageThe pattern of  also follows that of the flares already discussed, with a large downward δFr near the neutral line, an upward δFr in the neighboring sunspot, and a parallel/antiparallel
  on the positive/negative side of the neutral line and a clockwise
  in the neighboring sunspot. The shear change patterns also follow suit with a sharp increase of shear near the neutral line and decreasing shear in the periphery, including the northeastern sunspot. The horizontal component of the shear, having negative sign (dextral chirality), had a negative signed change but a positive absolute change representing enhanced shear of dextral chirality near the neutral line, with positive signed change but a negative absolute change in the periphery. The signed vertical shear increased near the neutral line and decreased in the periphery, but the unsigned vertical shear decreased almost everywhere in the region. These patterns match those discussed above for NOAA AR 11158 and 11283, and they appear to be independent of the handedness of the region.
Figure 19 shows the magnetic changes in time for the X5.4 flare in NOAA AR 11429 on 2012 March 7. Like the flares previously discussed, this flare also had dominant flare-time magnetic field changes in the perpendicular component. Because this region has a field of dextral chirality ( ), the condition
  implies, from Equation (20), a decrease/increase in horizontal shear. Hence, a dominant negative δB⊥ near the neutral line strengthened the dextral handedness of the field there. A smaller positive δB⊥ spike coming from the PRs, and about half as large as the positive spike from the neutral line, was about the same size as the spikes in δBr and δB∥ that were approximately balanced in sign.
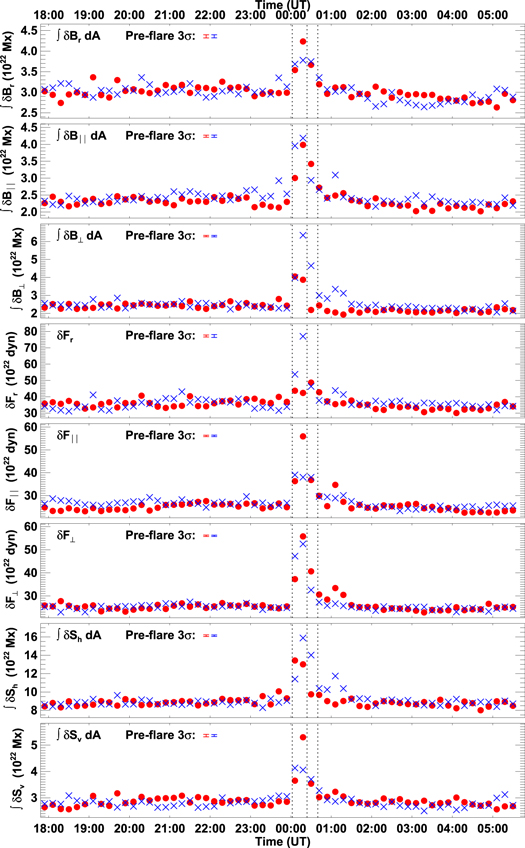
Figure 19. X5.4 flare on 2012 March 7 at 00:02 UT: positive (red circles) and negative (blue crosses) vertical magnetic flux changes, parallel and perpendicular horizontal integrated field changes, vertical and horizontal parallel and perpendicular Lorentz force changes, and horizontal and vertical integrated magnetic shear changes, plotted against time over a 12 hr window centered on the published GOES start time of the flare. Also shown in each plot for comparison are 3σ error bars for the positive (red) and negative (blue) pre-flare variations.
Download figure:
Standard image High-resolution imageThe dominant δB⊥ was accompanied by a dominant δFr in the form of a large negative spike coming from the neutral line. The δF∥ plot shows a southward bias in the force changes near the neutral line, but the force changes δF⊥ parallel/antiparallel to the neutral line were evenly balanced.
The negative horizontal shear change spike from the neutral line was about 50% larger than the positive spike from the PRs. The positive vertical shear change spike from the neutral line was about twice as large as the negative spike from the PRs. All of these spikes rose well above the background variations.
Appendix C: Organized Lorentz Force and Shear Changes with Complex Field Changes
Figures 20 and 21 show two more examples in the southern hemisphere, both with magnetic fields of sinistral chirality, from later in the cycle: one from 2014 December 20 and the other from 2015 March 11. Figure 21 shows that the neutral line of NOAA AR 12297 had a complex structure. The region featured a strong positive-polarity sunspot with a strong, curved neutral line to its north, and a thin, elongated island of positive flux to the north of and parallel to this neutral line. It will turn out that this complexity does not lead to equally complex Lorentz force and magnetic shear changes. The complexity of the neutral line of NOAA AR 12242 shown in Figure 20 also hosted simpler Lorentz force and magnetic shear changes, but for different reasons.
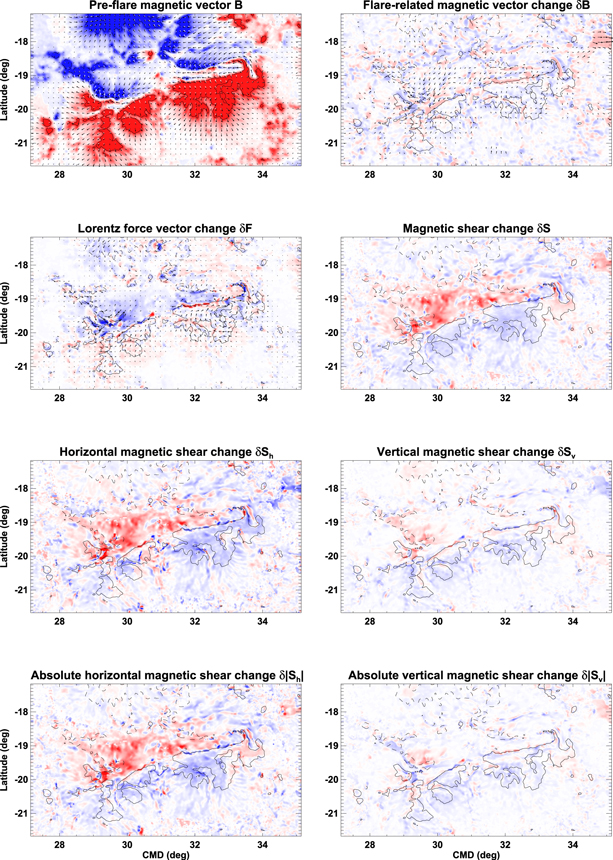
Figure 20. X1.8 flare on 2014 December 20 at 00:11 UT: pre-flare photospheric vector field B (top left), flare-related photospheric vector field change  (top right), Lorentz force vector change
  (second row, left), magnetic shear change δS (second row, right), horizontal magnetic shear change δSh (third row, left), vertical magnetic shear change δSv (third row, right), absolute horizontal shear change δ∣Sh∣ (bottom left), and absolute vertical shear change δ∣Sv∣ (bottom right). Red/blue coloring represents positive/negative value. All quantities saturate at ±1000 G, except the Lorentz force change
  , which saturates at ±104 dyn cm−2. Black arrows represent horizontal vector components; white arrows in the B plot represent the potential field Bp. The black solid/dashed contours show locations of positive/negative vertical magnetic flux density ±1 and ±2 kG.
Download figure:
Standard image High-resolution image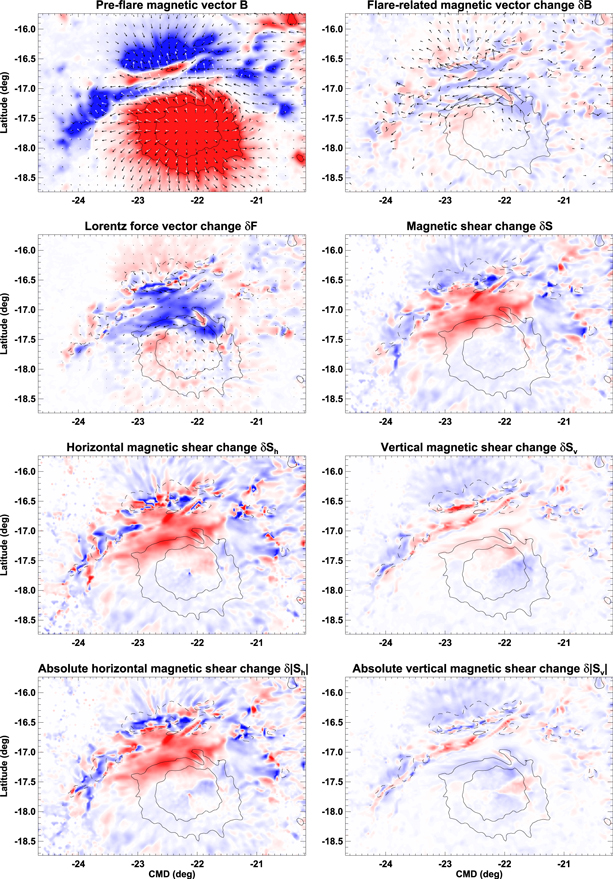
Figure 21. X2.1 flare on 2015 March 11 at 16:11 UT: pre-flare photospheric vector field B (top left), flare-related photospheric vector field change  (top right), Lorentz force vector change
  (second row, left), magnetic shear change δS (second row, right), horizontal magnetic shear change δSh (third row, left), vertical magnetic shear change δSv (third row, right), absolute horizontal shear change δ∣Sh∣ (bottom left), and absolute vertical shear change δ∣Sv∣ (bottom right). Red/blue coloring represents positive/negative value. All quantities saturate at ±1000 G, except the Lorentz force change
  , which saturates at ±104 dyn cm−2. Black arrows represent horizontal vector components; white arrows in the B plot represent the potential field Bp. The black solid/dashed contours show locations of positive/negative vertical magnetic flux density ±1 and ±2 kG.
Download figure:
Standard image High-resolution imageEach region featured a strong magnetic neutral line oriented east–west with negative magnetic flux to the north and positive to the south, and with horizontal field component Bh pointing eastward. With  pointing south in each case, we have sinistral neutral-line fields. In each case
  also pointed eastward, indicating an increase in strength of Bh, and, consistent with Equation (7) and its special case Equation (18), we again have a strong negative δFr near each neutral line and
  pointing parallel/antiparallel along the neutral line on the positive/negative side. In the regions surrounding the vicinities of these two neutral lines, the δFr pattern had a positive halo around the strong negative signals near the neutral lines, though these positive δFr are more difficult to trace back to the field changes. In parts of this PR one can see that
  was indeed almost antiparallel to Bh, e.g., in the north central portion of the frame, but in general the
  pattern is significantly clearer than the
  pattern.
Figures 20 and 21 also show that the shear change patterns also tend to be clearer than the  patterns. The total shear change and the signed and absolute horizontal shear changes were all clearly positive near the neutral line and generally negative in the PRs. The signed vertical shear change was also positive near the neutral line and negative in the periphery, whereas the unsigned vertical shear change was negative over most of the region. The Lorentz force and shear changes of these two flaring regions therefore conformed with those for the flares discussed earlier.
Figure 22 shows the temporal changes of the 2014 December 20 flare. This flare follows the theme of δB⊥ being larger than δBr and δB∥. The δBr spike was smaller than the spikes in the horizontal field components and was only just above the level of the background variations. The horizontal component changes showed a north–south asymmetry in the changes, with the northern negative polarity hosting the larger horizontal field changes. The larger negative spike in δB∥ was mostly from the northern side of the neutral line, where much of B∥ pointed south. The positive spike in δB⊥ was slightly larger than the negative spike and represents the strengthening of the sinistral handedness of the field near the neutral line. The negative δB⊥ spike shows that significant weakening of B⊥ also took place peripheral to the neutral-line region.
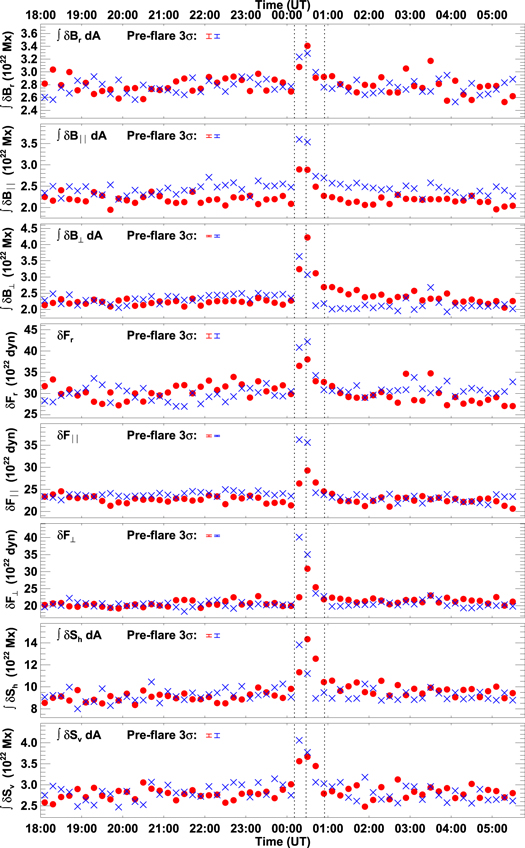
Figure 22. X1.8 flare on 2014 December 20 at 00:11 UT: positive (red circles) and negative (blue crosses) vertical magnetic flux changes, parallel and perpendicular horizontal integrated field changes, vertical and horizontal parallel and perpendicular Lorentz force changes, and horizontal and vertical integrated magnetic shear changes, plotted against time over a 12 hr window centered on the published GOES start time of the flare. Also shown in each plot for comparison are 3σ error bars for the positive (red) and negative (blue) pre-flare variations.
Download figure:
Standard image High-resolution imageThis is also borne out by the δFr plot of Figure 22, whose larger negative spike closely corresponds to the positive spike in δB⊥, and whose smaller spike corresponds via Equation (7) and its special case Equation (18) to the smaller negative δB⊥ spike. While the neutral line region underwent a large downward force change, the PRs experienced a significant upward force change. The horizontal force changes reflected the north–south asymmetry of this region's response to the flare: the negative δF⊥, like the positive δB⊥, was dominant and was located on the negative north side of the neutral line. The nearly straightforward sign-reversed correspondence between δF⊥ and δB⊥ is due to the dominance of the magnetic changes on the negative-polarity north side of the neutral line in Equation (7) and its special case Equation (18).
Figure 22 shows that the horizontal shear change was balanced in sign, whereas Figure 20 starkly shows the north–south asymmetry of the field changes during this flare: the horizontal shear was systematically strengthened on the north side and weakened on the south side of the neutral line. The vertical shear change was also positive in the north and negative in the south, but, in this parameter, Figure 22 shows that the southern changes were slightly stronger overall.
In the case of the changes during the 2015 March 11 flare, shown in Figure 21, the neutral line of NOAA AR 12297 had complex structure in the form of a strong positive-polarity sunspot with a strong, curved neutral line to its north and a thin, elongated island of positive flux to the north of and parallel to this neutral line. However, because the horizontal field component Bh and its flare-related change  both pointed east throughout this complex neutral line structure, the associated Lorentz force and magnetic shear changes there were much simpler overall and conformed to the usual pattern of negative δFr near the neutral line, surrounded by positive δFr in the neighboring regions, and strengthening overall and horizontal shear. The complexity of the field structure does show through in the form of a less organized horizontal Lorentz force-change pattern and small islands of positive δFr and weakening of shear near the neutral line, but the overall organization of the region's force and shear changes, despite the complexity of the neutral line, is clear.
Figure 23 shows that, during the 2015 March 11 flare, the perpendicular field change was, as in the case of the 2014 December 20 flare, stronger than the changes in the vertical and parallel components. While the change in the vertical component was balanced in sign, the change in the parallel component had a negative bias owing to the northward-pointing  north of the neutral line. The change in the perpendicular component was dominant, with the strengthening of the neutral-line field's perpendicular horizontal field component and its sinistral chirality being the main effects of this change.
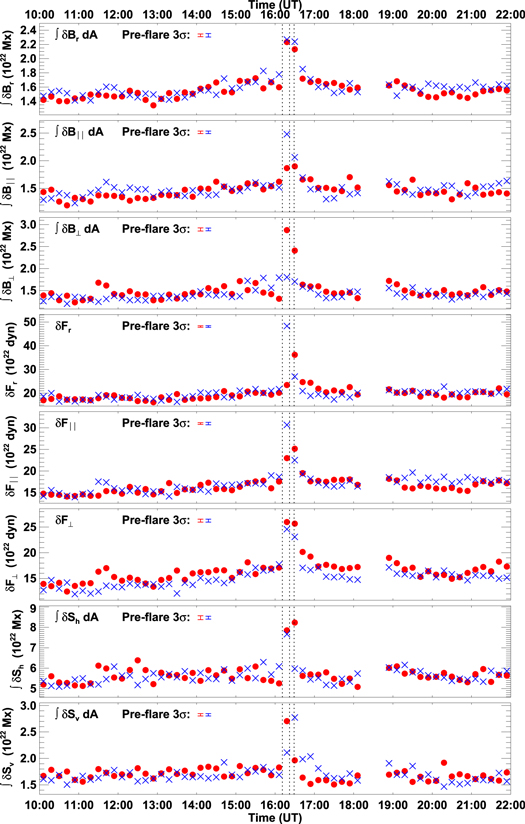
Figure 23. X2.1 flare on 2015 March 11 at 16:11 UT: positive (red circles) and negative (blue crosses) vertical magnetic flux changes, parallel and perpendicular horizontal integrated field changes, vertical and horizontal parallel and perpendicular Lorentz force changes, and horizontal and vertical integrated magnetic shear changes, plotted against time over a 12 hr window centered on the published GOES start time of the flare. Also shown in each plot for comparison are 3σ error bars for the positive (red) and negative (blue) pre-flare variations.
Download figure:
Standard image High-resolution imageThe vertical Lorentz force change had a large negative spike representing, as usual via Equation (17), the strengthening of Bh in the neutral-line region and a smaller positive spike representing the PRs. There was a large parallel force change δF∥ in the form of a southward-pointing  to the northeast of the neutral line accompanied by a contribution from the inward
  at the west side of the positive sunspot. The perpendicular force changes δF⊥ were approximately evenly balanced in opposite directions on the two sides of the neutral line. Unlike the X1.8 flare on 2014 December 20, during this flare the magnetic changes did not predominantly occur in a field of one or other polarity but were more evenly distributed on both sides of the neutral line; hence, the relationship between
  and
and  is not as simple in this case as for the previous flare.
The horizontal shear changes were also approximately balanced, with an increase near the neutral line and a decrease in surrounding regions. The vertical shear changes were weaker but were also positive in the neutral-line region and negative in PRs.
Comparison between the two flares demonstrates how much simpler the force and shear patterns become when the magnetic field changes occur predominantly in one magnetic polarity. However, one can still understand the changes in cases with magnetic changes in both polarities and find that these changes can be simpler than one would expect from the appearance of the magnetic field vector changes.
Appendix D: A More Diffuse Neutral Line
The X1 flare on 2014 March 29 was covered by the IBIS instrument at the Dunn Solar Telescope, and the chromospheric line-of-sight magnetic field changes were described in detail by Kleint (2017), together with the photospheric line-of-sight changes as observed by HMI. In Figure 24 we present the HMI vector field changes. As with many flaring active regions, this region featured a prominent magnetic neutral line oriented east–west, in this case with positive flux to the north and negative flux to the south. The field near the neutral line was highly sheared, with horizontal field component Bh pointing westward almost parallel to the neutral line, which, with southward-pointing  , implies a neutral-line field with sinistral chirality.
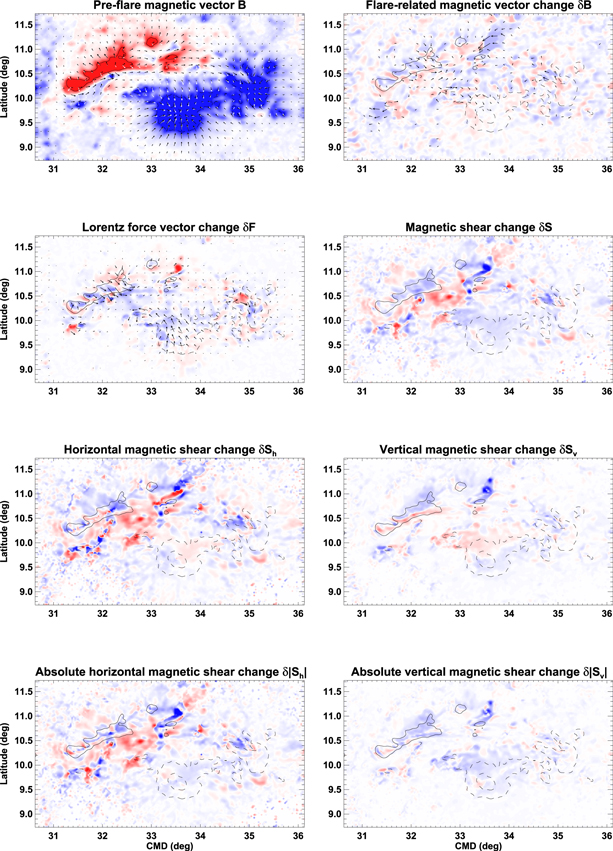
Figure 24. X1.0 flare on 2014 March 29 at 17:35 UT: pre-flare photospheric vector field B (top left), flare-related photospheric vector field change  (top right), Lorentz force vector change
  (second row, left), magnetic shear change δS (second row, right), horizontal magnetic shear change δSh (third row, left), vertical magnetic shear change δSv (third row, right), absolute horizontal shear change δ∣Sh∣ (bottom left), and absolute vertical shear change δ∣Sv∣ (bottom right). Red/blue coloring represents positive/negative value. All quantities saturate at ±1000 G, except the Lorentz force change
  , which saturates at ±104 dyn cm−2. Black arrows represent horizontal vector components; white arrows in the B plot represent the potential field Bp. The black solid/dashed contours show locations of positive/negative vertical magnetic flux density ±1 and ±2 kG.
Download figure:
Standard image High-resolution imageHowever, this neutral line was significantly more diffuse than in the cases described above, with hundreds of kilometers of weak flux separating the two strong flux concentrations on each side of the neutral line. The distribution of  therefore did not have such a strong pattern as in those other cases where a strong neutral line or sunspot tended to host the most organized flare-related magnetic changes. No such tightly organized flux system appears to be present here. One can nevertheless see a region of westward-pointing
  where the neutral line was strongest, around (325, 105), immediately south of the strongest positive flux concentration. The plot for
  shows that δFr had a significant negative change at the same location, with a faint halo of positive δFr surrounding it. There is also some evidence of
  pointing westward north of the neutral line and eastward south of the neutral line. This behavior is consistent with the neutral-line field changes described earlier where Equation (18) holds. The main difference in this case is the diffuseness of the neutral line, which causes the
  and
and  patterns to be more spatially separated for this flare than for the others.
The patterns of shear change for this flare also match those for the other sinistral flaring neutral-line fields described earlier. Near the neutral line the total shear and the signed and absolute horizontal shear all increased, and all decreased in the PRs. The signed vertical shear changes also conformed to this pattern, and the absolute vertical shear decreased over most of the active region. The changes in Lorentz force and magnetic shear associated with this flare therefore closely resemble those accompanying other neutral-line flares, despite the larger separation between the magnetic polarities introducing some visible differences between this and the other neutral-line flares.
Kleint (2017) noted that the stepwise photospheric field changes (identified by arctan function fits) found in the line-of-sight HMI data were generally located near loop footpoints, whereas those in the IBIS data, coming from the chromosphere, tended to be located closer to loop apexes. This may account for the complex results found by Kleint (2017), with qualitatively different changes of line-of-sight field detected in the two atmospheric layers. Here this flare is found to have conformed to the simple photospheric pattern of the other neutral-line flares in this study. The relationship between this pattern and the behavior in other atmospheric layers requires further investigation, based on further simultaneous observations of flares in both photospheric and chromospheric spectral lines.
Although this region showed signs of organized flare-related field change reminiscent of regions with less diffuse neutral lines, this flare stands out from the rest of this sample by its general weakness of field change, which, taken as a whole, does not strongly stand out from the background photospheric evolution, as Figure 25 shows. This is consistent with the fact that only a minority of pixels exhibit significant stepwise changes according to the study of line-of-sight HMI and IBIS data by Kleint (2017).
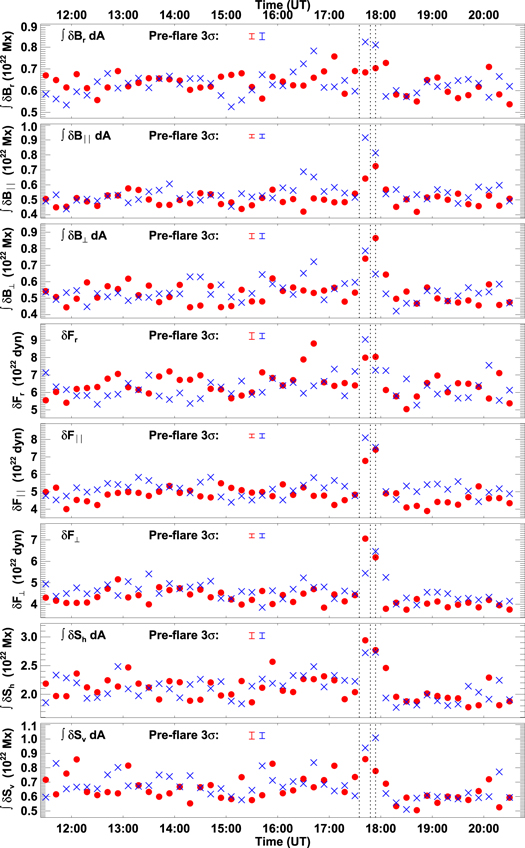
Figure 25. X1.0 flare on 2014 March 29 at 17:35 UT: positive (red circles) and negative (blue crosses) vertical magnetic flux changes, parallel and perpendicular horizontal integrated field changes, vertical and horizontal parallel and perpendicular Lorentz force changes, and horizontal and vertical integrated magnetic shear changes, plotted against time over a 12 hr window centered on the published GOES start time of the flare. Also shown in each plot for comparison are 3σ error bars for the positive (red) and negative (blue) pre-flare variations.
Download figure:
Standard image High-resolution imageThe most significant field changes were in the horizontal parallel direction, in which concentrated regions of negative change were detected, e.g., near (34°, 11°) and positive changes near (33°, 10°). In the perpendicular direction there was a signature, a positive and a negative spike at flare time, of both a strengthening and a weakening of the field component, again mostly due to the features of oppositely directed horizontal field change near (34°, 11°) and (33°, 10°), though the positive spike did not rise above the background level. There was no significant flare-related δBr signal.
Contrary to the usual behavior for a neutral-line flare, there was no significant spike in δFr for this flare. Though the spatial map for δFr shows the usual pattern of negative δFr near the neutral line, surrounded by positive δFr in the neighboring regions, these organized changes were not significantly stronger than the background non-flare-related changes. This behavior is unique to this flare in our sample. In contrast, δF∥ and δF⊥ had significant flare-time spikes evenly balanced in sign, indicating a significant release of magnetic tension unaccompanied by a significant organized change in magnetic pressure.
The horizontal and vertical shear changes produced small spikes at flare time, with positive representing the vicinity of the neutral line and negative representing the PRs (including concentrations of change), but they were not significantly larger than the background changes.
Appendix E: Two Flares at an Asymmetric Peninsula of Magnetic Flux
Figures 26 and 27 show the magnetic changes of NOAA AR 11890 during two X-class flares: one on 2013 November 5 and one on 2013 November 8. This region featured a patch of twisted positive magnetic flux surrounded by negative flux. The positive flux system had a strong, sheared magnetic neutral line at its western boundary, and a more diffuse neutral line delineated most of the remainder of its boundary.

Figure 26. X3.3 flare on 2013 November 5 at 22:07 UT: pre-flare photospheric vector field B (top left), flare-related photospheric vector field change  (top right), Lorentz force vector change
  (second row, left), magnetic shear change δS (second row, right), horizontal magnetic shear change δSh (third row, left), vertical magnetic shear change δSv (third row, right), absolute horizontal shear change δ∣Sh∣ (bottom left), and absolute vertical shear change δ∣Sv∣ (bottom right). Red/blue coloring represents positive/negative value. All quantities saturate at ±1000 G, except the Lorentz force change
  , which saturates at ±104 dyn cm−2. Black arrows represent horizontal vector components; white arrows in the B plot represent the potential field Bp. The black solid/dashed contours show locations of positive/negative vertical magnetic flux density ±1 and ±2 kG.
Download figure:
Standard image High-resolution image
Figure 27. X1.1 flare on 2013 November 8 at 04:20 UT: pre-flare photospheric vector field B (top left), flare-related photospheric vector field change  (top right), Lorentz force vector change
  (second row, left), magnetic shear change δS (second row, right), horizontal magnetic shear change δSh (third row, left), vertical magnetic shear change δSv (third row, right), absolute horizontal shear change δ∣Sh∣ (bottom left), and absolute vertical shear change δ∣Sv∣ (bottom right). Red/blue coloring represents positive/negative value. All quantities saturate at ±1000 G, except the Lorentz force change
  , which saturates at ±104 dyn cm−2. Black arrows represent horizontal vector components; white arrows in the B plot represent the potential field Bp. The black solid/dashed contours show locations of positive/negative vertical magnetic flux density ±1 and ±2 kG.
Download figure:
Standard image High-resolution imageThe main magnetic changes during the first flare were centered upon the strong western neutral line. This neutral line was, on November 5, oriented north–south, with Bh near this neutral line pointing northward almost parallel to it. With positive flux to the east and negative flux to the west,  pointed westward, and so the neutral-line field had sinistral chirality. Interestingly, on the positive side of the neutral line a highly sheared Bh pointed away from the neutral line, perhaps indicating the presence of the concave-upward structure of the bottom of a flux rope there.
The top right panel of Figure 27 shows that  pointed northward along the neutral line, strengthening Bh there, but east of the neutral line
  pointed toward the neutral line, weakening Bh there. To the west the pattern of
  is less clear, but the pattern of
  is clearer. We have the canonical pattern of a strong downward δFr near the neutral line and a weaker upward δFr on each flank. The horizontal force change also conformed with previous cases with a parallel/antiparallel
  on the positive/negative side of the neutral line. The total shear change and the signed and absolute horizontal shear changes were all positive near the neutral line and negative in the surrounding regions, particularly to the east. The vertical signed shear change showed the same pattern, except that the positive change at the neutral line was relatively weak and the negative change to the east was relatively strong. The absolute vertical shear change was negative over almost all of the region.
By 2013 November 8 this region had rotated and diffused so that the main magnetic neutral line survived but in a weaker state, oriented northeast–southwest, with a concentration of twisted positive flux at its south end. The horizontal field Bh pointed northeast along the neutral line and had clockwise circulation in the positive flux concentration. With  pointing northwest across the neutral line and outward from the center of the positive flux concentration, these structures, like the neutral line on November 5, have a field of sinistral chirality.
The horizontal field change  pointed northeast along the neutral line, strengthening Bh there, but anticlockwise in the positive flux concentration, weakening Bh there. The force changes
  showed the expected behavior according to Equations (17) and (18): strong negative δFr at the neutral line and counterstreaming parallel/antiparallel
  components on the positive/negative side of the neutral line, and positive δFr and clockwise
  in the positive flux concentration.
The shear changes for this flare had a bipolar distribution. The total shear change and the signed and absolute horizontal shear changes were positive along the neutral line and negative in and near the positive flux concentration. The signed vertical shear had a similar pattern, and the absolute vertical shear change, though mostly negative, was positive over a sizable area on the positive side of the neutral line, including part of the positive flux concentration. The shear changes for this flare had similar bipolar distributions to those of the previous flare in this region, though the association of negative shear changes with the twisted positive flux is clearer in this flare.
The vector field component changes during the 2013 November 5 flare all spiked at flare time, as shown by Figure 28. However, as is often the case, the δBr spikes were much less significant than the changes in the horizontal components. The larges spike was the positive change in δB⊥ representing the strengthening of the axial field along the neutral line during this flare. There was no significant negative spike in δB⊥ at flare time. The negative δB∥ spike included a contribution from the strengthening of the shear of the neutral-line field during the flare, as well as from the weakening of parallel field components in PRs. The smaller positive spike included contributions from the strengthening of the normally directed (parallel to  ) field components near the neutral line.

Figure 28. X3.3 flare on 2013 November 5 at 22:07 UT: positive (red circles) and negative (blue crosses) vertical magnetic flux changes, parallel and perpendicular horizontal integrated field changes, vertical and horizontal parallel and perpendicular Lorentz force changes, and horizontal and vertical integrated magnetic shear changes, plotted against time over a 12 hr window centered on the published GOES start time of the flare. Also shown in each plot for comparison are 3σ error bars for the positive (red) and negative (blue) pre-flare variations.
Download figure:
Standard image High-resolution imageThere were equally large negative and positive spikes in δFr representing the neutral line and the periphery, respectively. These were the largest force changes. The δF⊥ spikes were the next largest, representing the usual parallel/antiparallel magnetic tension release on the positive/negative side of the neutral line, accompanied by almost equal positive and negative spikes in δF∥ representing these releases of magnetic tension across the neutral line, described by Equation (18).
In this flare the horizontal shear change was dominated by a large positive spike from near the neutral line, accompanied by a much smaller positive spike from the periphery. In contrast, the vertical shear change was dominated by a negative spike from the periphery: the positive change at the neutral line was much smaller and barely rose above the background variations.
The field changes of this region spiked at the time of the 2013 November 8 flare in a similar manner to the 2013 November 5 flare as shown in Figure 29. The main difference was that by November 8 the highly sheared neutral line had dissipated, so that the negative spike in δB⊥ was much diminished for the November 8 flare compared to the November 5 flare. The dominant positive spikes in δB∥ and δB⊥ represent strengthening of the horizontal field near the neutral line with a weak negative spike in δB∥ coming from the PRs.

Figure 29. X1.1 flare on 2013 November 8 at 04:20 UT: positive (red circles) and negative (blue crosses) vertical magnetic flux changes, parallel and perpendicular horizontal integrated field changes, vertical and horizontal parallel and perpendicular Lorentz force changes, and horizontal and vertical integrated magnetic shear changes, plotted against time over a 12 hr window centered on the published GOES start time of the flare. Also shown in each plot for comparison are 3σ error bars for the positive (red) and negative (blue) pre-flare variations.
Download figure:
Standard image High-resolution imageAs for the November 5 flare, the November 8 flare had the largest Lorentz force change in the vertical direction, with equal-sized positive and negative δFr spikes from the neutral-line and PRs, respectively. The vertical force changes were accompanied as usual by equal and opposite δF⊥ spikes corresponding to the horizontal force changes parallel/antiparallel to the neutral line on its positive/negative side. Smaller positive and negative δF∥ spikes, of approximately equal size to each other, also occurred.
The horizontal shear changes were dominated by a positive spike from the neutral line dwarfing a negative spike from PRs. However, the largest vertical shear change was a negative spike from the south side of the flux concentration and the periphery. This spike was twice as large as the positive vertical shear change near the neutral line.
Appendix F: Two More Complex Flaring Active Regions
Vemareddy & Wiegelmann (2014) gave a nonlinear force-free model of field evolution associated with the X1.5 flare in NOAA AR 11166 on 2011 March 9. Their modeling indicated a single magnetic null point cospatial with the main hard X-ray source and, as did Petrie (2012), found an increase in the horizontal field component near the neutral line as a result of this flare, besides much reorganization of the coronal field during the flare. However, this flare produced the most complex pattern of photospheric magnetic change among the 15 flares in our sample. We study it here, together with another flare whose magnetic changes were concentrated along a complex neutral line, the X1.6 flare in NOAA AR 12205 on 2015 November 7.
Figure 30 shows the magnetic changes during the X1.6 flare on 2014 November 7. Here the changes were concentrated along a meandering but strong magnetic neutral line separating several positive flux concentrations to the north and a few positive flux concentrations to the south. Most of the flare-related changes occurred at a north–south-oriented section of the neutral line around (−40°, 17°), between a large negative concentration to the east and a large positive concentration to the west. The horizontal field Bh pointed southward along this section of the neutral line, and so, with eastward-pointing  , the neutral-line field had sinistral chirality.

Figure 30. X1.6 flare on 2014 November 7 at 16:53 UT: pre-flare photospheric vector field B (top left), flare-related photospheric vector field change  (top right), Lorentz force vector change
  (second row, left), magnetic shear change δS (second row, right), horizontal magnetic shear change δSh (third row, left), vertical magnetic shear change δSv (third row, right), absolute horizontal shear change δ∣Sh∣ (bottom left), and absolute vertical shear change δ∣Sv∣ (bottom right). Red/blue coloring represents positive/negative value. All quantities saturate at ±1000 G, except the Lorentz force change
  , which saturates at ±104 dyn cm−2. Black arrows represent horizontal vector components; white arrows in the B plot represent the potential field Bp. The black solid/dashed contours show locations of positive/negative vertical magnetic flux density ±1 and ±2 kG.
Download figure:
Standard image High-resolution imageThe plot for  in Figure 30 clearly shows that
  pointed southward along this section of the neutral line, strengthening Bh there. These changes appear stronger and more organized in the horizontal component than in the vertical component, and these horizontal changes seem to have been strongest and most organized in the vicinity of this central north–south part of the neutral line. Consistent with Equation (6) and its special case for dominant
  in Equation (17), the plot for
  shows a strong downward δFr at this part of the neutral line, accompanied by a significant downward δFr not only at this central part but also along most of the length of this meandering neutral line. Also evident is a positive δFr on each side of this long, meandering strip of negative δFr. This flare also exhibited the usual counterstreaming pattern of parallel/antiparallel
  on the positive/negative side of the north–south-oriented section of the neutral line around (−40°, 17°), where most of the magnetic field change
  took place, consistent with Equation (7) and its special case for dominant
  in Equation (18). These changes appear to have been as well organized as for the simpler neutral lines discussed earlier.
In Figure 30 the magnetic shear changes also appear significant along most of the length of this meandering neutral line. The total shear change and the signed and absolute horizontal shear changes were positive over almost all of this neutral line and negative in the two flanks. The signed vertical shear change showed a similar distribution, although it was weaker, with increases along the neutral line and decreases in the flanks. The absolute vertical shear change was negative over almost all of the region. This example demonstrates that the spatial structure of magnetic force and shear change can be simpler and more organized over larger areas of the region than the field-change maps alone would suggest.
For the 2014 November 7 flare Figure 31 shows that the largest change in the field vector occurred in the perpendicular component: δB⊥ had a large positive spike at flare time that strengthened the sinistral field at the neutral line. Next largest was a positive spike in δB∥ caused mostly by  pointing slightly eastward at the strongest, north–south part of the neutral line. There was also a smaller negative spike in δB⊥:
 pointed in both directions across the neutral line at different locations. There were also small positive and negative spikes in δBr at flare time.
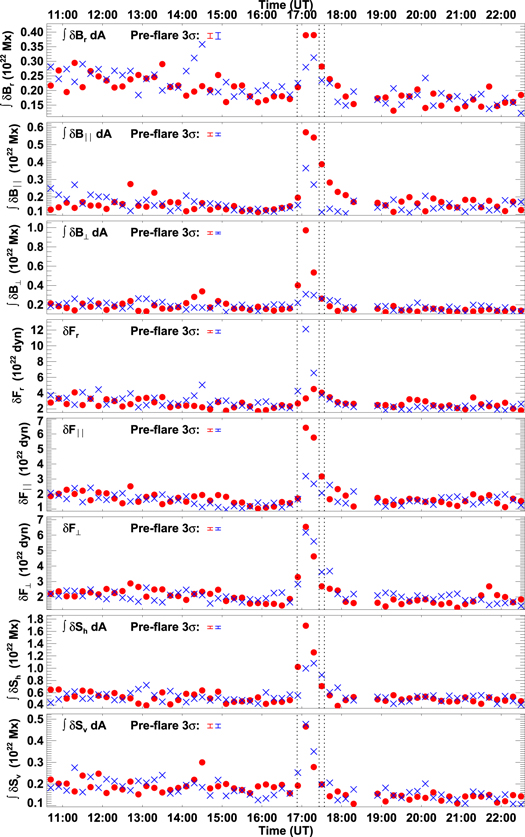
Figure 31. X1.6 flare on 2014 November 7 at 16:53 UT: positive (red circles) and negative (blue crosses) vertical magnetic flux changes, parallel and perpendicular horizontal integrated field changes, vertical and horizontal parallel and perpendicular Lorentz force changes, and horizontal and vertical integrated magnetic shear changes, plotted against time over a 12 hr window centered on the published GOES start time of the flare. Also shown in each plot for comparison are 3σ error bars for the positive (red) and negative (blue) pre-flare variations.
Download figure:
Standard image High-resolution imageThe force change  shown in Figure 31 was dominated by a large negative δFr spike, a downward force change, at the main neutral line, particularly the central strongest north–south part. There were equally large positive and negative spikes in δF⊥ caused mostly by force changes parallel/antiparallel to the neutral line on its positive/negative side. The δF∥ plot resembles the δB∥ plot in having a large positive and small negative spike, caused likewise by a slightly eastward-pointing
  at the strongest part of the neutral line.
The horizontal shear change shown in Figure 31 had a large positive spike from the neutral-line region and a smaller negative spike from the periphery. The vertical shear change had positive and negative spikes of approximately equal size from the neutral-line and PRs, respectively.
Figure 32 shows the magnetic changes for a flare with complex magnetic field structure of a different kind, the X1.5 flare in NOAA AR 11166 on 2011 March 9. Here a peninsula of positive-polarity flux was almost entirely surrounded by negative flux, and whereas the flares described in Section E had magnetic changes localized at one part of the neutral line on one side of the peninsula, here we see sizable magnetic changes at almost every point of the neutral line surrounding the peninsula with little obvious organization. The horizontal field Bh pointed westward along both the northern and southern neutral lines. Since  must point northward across the northern part of the neutral line and southward across the southern part, this region had magnetic field of mixed handedness:
  at the north/south neutral line, and hence the field there had dextral/sinistral chirality.
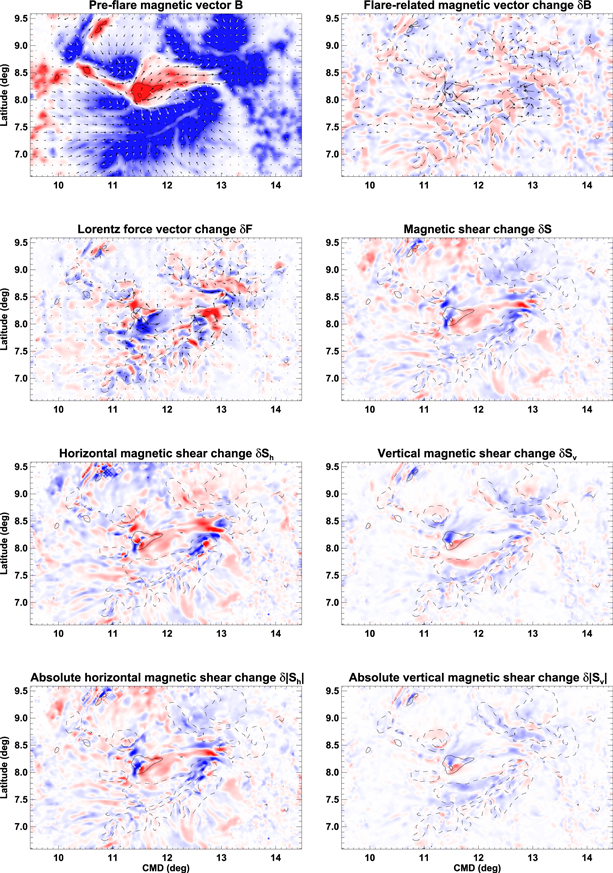
Figure 32. X1.5 flare on 2011 March 9 at 23:13 UT: pre-flare photospheric vector field B (top left), flare-related photospheric vector field change  (top right), Lorentz force vector change
  (second row, left), magnetic shear change δS (second row, right), horizontal magnetic shear change δSh (third row, left), vertical magnetic shear change δSv (third row, right), absolute horizontal shear change δ∣Sh∣ (bottom left), and absolute vertical shear change δ∣Sv∣ (bottom right). Red/blue coloring represents positive/negative value. All quantities saturate at ±1000 G, except the Lorentz force change
  , which saturates at ±104 dyn cm−2. Black arrows represent horizontal vector components; white arrows in the B plot represent the potential field Bp. The black solid/dashed contours show locations of positive/negative vertical magnetic flux density ±1 and ±2 kG.
Download figure:
Standard image High-resolution imageAs Figure 32 shows, the most organized field changes  occurred at the southern side of the peninsula, near where the positive flux was strongest, around (12°, 8°). The
  map showed little organized structure in either δBr or Bh, except that Bh pointed westward over the area around the southern section of the neutral line near (12°, 8°), which strengthened the horizontal field significantly there.
This island of organized field change is reflected in the  map in Figure 32, where a large negative vertical force change δFr, consistent with Equation (17), is clearly evident near (12°, 8°), surrounded by more complex δFr structure. The behavior of
  near (12°, 8°) also resembles the usual behavior of flaring neutral lines with parallel/antiparallel
  on the positive/negative side of the neutral line, consistent with Equation (18), again surrounded by significant but much less organized force changes.
The region around (12°, 8°) in Figure 32 also underwent significant positive total shear and signed and absolute shear changes, surrounded by complex changes of mixed sign. The signed vertical shear change was weakly positive near (12°, 8°), surrounded by mostly negative changes, and the absolute vertical shear change was negative over most of the region. The Lorentz force and magnetic shear changes therefore conformed closely to the usual pattern for neutral-line flares, even with the great magnetic complexity surrounding this neutral line.
Though the field changes during the 2011 March 9 flare were complex, Figure 33 shows that this flare nevertheless did conform to the pattern of simpler neutral-line flares as far as having dominant field vector change at flare time in the perpendicular direction: δB⊥ had a large positive spike coming mostly from the southern neutral line, unaccompanied by a negative spike in δB⊥. Also present were smaller positive and negative spikes in δB∥. There was also a negative spike in δBr, but it was weak, and there was no positive spike in δBr.

Figure 33. X1.5 flare on 2011 March 9 at 23:13 UT: positive (red circles) and negative (blue crosses) vertical magnetic flux changes, parallel and perpendicular horizontal integrated field changes, vertical and horizontal parallel and perpendicular Lorentz force changes, and horizontal and vertical integrated magnetic shear changes, plotted against time over a 12 hr window centered on the published GOES start time of the flare. Also shown in each plot for comparison are 3σ error bars for the positive (red) and negative (blue) pre-flare variations.
Download figure:
Standard image High-resolution image
The force changes shown in Figure 33 featured a dominant negative spike in δFr, again conforming to the usual neutral-line pattern and associated with the dominant positive spike in δB⊥ at the southern neutral line. There was a smaller positive spike in δF⊥ and a negative spike in δF∥, with no significant spikes of opposite sign in either of these components. The horizontal force changes at the northern neutral line pointed predominantly southward and at the southern neutral line predominantly westward and slightly northward.
The horizontal shear change shown in Figure 33 had a significant positive spike, mostly from the southern neutral line, and no significant negative spike. The vertical shear change had a significant positive spike, mostly from the southern neutral line, and a smaller negative spike, mostly from a halo surrounding the positive flux peninsula. Despite the obvious complexity of these changes in Figure 32, they resolve quite neatly into simpler patterns of change in the vertical and parallel and perpendicular horizontal directions.