


Abstract
The oscillator strengths and integral cross sections of the valence-shell excitations of acetylene have significant applications in the studies of interstellar gases. In the present work, the generalized oscillator strengths (GOSs) of the valence-shell excitations of acetylene have been determined by the fast-electron-scattering technique at an incident electron energy of 1500 eV and an energy resolution of 70 meV. The optical oscillator strengths (OOSs) of the valence-shell excitations of acetylene have been obtained by extrapolating the GOSs to the limit of the squared momentum transfer K2 → 0. The present OOSs give an independent cross-check to the previous experimental and theoretical results, and the discrepancies between the present OOSs and the photoabsorption ones are analyzed in detail for the R30–R33 excitations. The integral cross sections of the valence-shell excitations of acetylene have been obtained systematically from the threshold to 5000 eV for the first time with the aid of the newly developed BE-scaling method. The present OOSs and integral cross sections of the valence-shell excitations of acetylene are the basic data for the astrophysical study and are conducive to deepening our understanding of the atmospheres of Jupiter and Saturn, and other outer planets and satellites.
Export citation and abstract BibTeX RIS
1. Introduction
As an important astrophysical molecule, acetylene is abundant in the interstellar medium (Prasad & Huntress 1980), carbon stars (Ridgway et al. 1976; Jorgensen & Johnson 1991), and planetary atmospheres (Mitchell et al. 1981; Shemansky et al. 2005). It is well known that spectrum observation is effective for the identification and determination of abundances of hydrocarbon species in space, and spectrum observation is one of the most important missions for many spacecraft, such as Voyager and the Cassini Ultraviolet Imaging Spectrograph (Broadfoot et al. 1981; Sandel et al. 1982; Smith et al. 2007; Shemansky & Liu 2012; Koskinen et al. 2013; Vervack & Moses 2015). Coincidentally, acetylene is one of the strongest absorbers in the vacuum ultraviolet (VUV) region for astronomical observations and is thus a key diagnostic in investigations of giant planets (Wagener et al. 1985). For example, the distinctive features of the VUV spectrum of acetylene were first detected in Saturn with the International Ultraviolet Explorer (IUE) by Moos & Clarke (1979), then, from IUE observations of Saturn (Chen et al. 1991) it was clearly confirmed that acetylene is the dominant absorber. In addition to serving as an important research object, Titan was investigated by many spacecraft, such asVoyager 1 and 2 in the 1980s (Broadfoot et al. 1981; Sandel et al. 1982; Vervack & Moses 2015) and Cassini more recently(Smith et al. 2007; Shemansky & Liu 2012; Koskinen et al. 2013). During the Titan flyby on 2004 December 13, the absorption spectra of Titan's atmosphere were recorded by Cassini; these are the basic and key data for determining the compositions of Titan's atmosphere (Shemansky et al. 2005). In order to explain these complex spectra, the optical oscillator strengths (OOSs) and integral cross sections (ICSs) of the acetylene molecule are the basic input parameters for the theoretical models (Cheng et al. 2011). Moreover, according to a series of photochemical models (Campbell et al. 2012; Campbell & Brunger 2013), with the aid of the OOSs and ICSs of acetylene and other hydrocarbon molecules, the abundance of atmospheric constituents, the atmospheric motions, and seasonal variations of Titan's atmosphere with the variation of the external environment (Campbell & Brunger 2013) can be obtained. Additionally, the OOSs of acetylene have been employed widely in the models of the atmospheres of Jupiter, Saturn, Uranus, Neptune, and Triton (Wu et al. 2001). So quantitative dynamic parameters for the valence-shell excitations of acetylene are needed to understand many astrophysical and photochemical processes.
With such high importance and various applications, the OOSs of the valence-shell excitations of acetylene have received much attention. Since the original observation of the discrete VUV photoabsorption spectrum of acetylene by Price (1935), the acetylene molecule has been investigated extensively both experimentally and theoretically. Herzberg (1966) and Robin (1985) summarized and reviewed the works reported before 1985, but a quantitative measurement of the photoabsorption cross sections of acetylene was reported only once (Nakayama & Watanabe 1964). Since then, the OOSs of the valence-shell excitations of acetylene were measured by Suto & Lee (1984) with an energy resolution of 0.04 nm, by Smith et al. (1991) with an energy resolution of better than 0.005 nm, by Wu et al. (2001) with an energy resolution of 0.007 nm, and by Cheng et al. (2011) with an energy resolution of 0.02 nm via the photoabsorption method. In principle, the photoabsorption measurements provide a direct determination of the OOSs of atoms and molecules; however, the insufficient instrumental resolution may result in the line-saturation effect and complicate the analysis of strong absorption lines. This line-saturation effect is particularly likely to occur when making photoabsorption measurements on intense, narrow, discrete excitations using the Beer–Lambert law. When the electron-scattering technique is operated at a negligibly small momentum transfer, it can be used to simulate the photoabsorption process and determine the OOSs of atoms and molecules; this is called the dipole (e, e) method. Compared with the photoabsorption method, the dipole (e, e) method has the remarkable advantage of being free from the line-saturation effect, due to its nonresonant excitation character, though its typical energy resolution of tens of meV is much lower than that of the photoabsorption method. Using the dipole (e, e) method, Cooper et al. (1995) reported the OOSs of the valence-shell excitations of acetylene. Although the OOSs of the valence-shell excitations of acetylene have been reported widely using the photoabsorption method and the dipole (e, e)method, significant discrepancies and arguments persist for these previous results (Cooper et al. 1995; Cheng et al. 2011). Under these circumstances, it is very important to investigate the OOSs of the valence-shell excitations of acetylene with a further experiment that can provide an independent cross-check on the previous results.
The ICSs of the valence-shell excitations of acetylene have not been reported until now, to the best of our knowledge. It is well known that ICSs can be determined by integrating the corresponding differential cross sections (DCSs) of the atoms and molecules from 0° to 180° measured by the electron-scattering. However, only some electron-energy-loss spectra were obtained in previous works (Lassettre et al. 1968; Stradling 1977; Wilden et al. 1980; Brunger et al. 1990), and no absolute DCSs for the valence-shell excitations of acetylene were reported.
Following the discussion above, it is very significant and important to investigate the OOSs and ICSs of the valence-shell excitations of acetylene with additional experiments that can provide an independent cross-check on the previous OOSs, and provide the systematic ICSs of the valence-shell excitations of acetylene. In the present work, the generalized oscillator strengths (GOSs) of the valence-shell excitations of acetylene have been determined by the high-energy electron-scattering technique at an incident electron energy of 1500 eV and an energy resolution of 70 meV. Additionally, the OOSs of acetylene have been obtained by extrapolating the GOSs to the limit of the squared momentum transfer K2 → 0, and the ICSs of the valence-shell excitations of acetylene have been obtained systematically from the threshold to 5000 eV for the first time with the aid of the BE-scaling method. For clarity, the vibronic states are represented by their term names and principal and vibrational quantum numbers such that  ; they are written as
  in this paper.
2. Experimental Method
In this work, the GOSs of the valence-shell excitations of acetylene have been determined by a high-resolution fast-electron-energy-loss spectrometer, which is described in detail in our previous works (Wu et al. 1995; Xu et al. 1996; Liu et al. 2001). Briefly, the spectrometer consists of an electron gun, a hemispherical electrostatic monochromator made of aluminum, a rotatable energy analyzer of the same type, an interaction chamber, a number of cylindrical electrostatic optics lens, and a position sensitive detector based on the microchannel plates for detecting the scattered electrons. All of these components are enclosed in three separate stainless steel chambers. For this experiment, the spectrometer was operated at an incident electron energy of 1500 eV and an energy resolution of about 70 meV.
In order to simplify the normalization process and improve the accuracy of the experimental results, the standard relative flow technique (Khakoo & Trajmar 1986; Nickel et al. 1989; Liu et al. 2017; Ni et al. 2017) was used in this experiment. First, mixed gases of helium and acetylene with respectively controlled flowed rates flowed into the interaction chamber simultaneously and continuously. Then, the intensity ratios of the excited states of the sample acetylene to the referenced standard transition (here the 1s21S0 → 1s2p1P1 of helium) were determined from the measured energy-loss spectra. Finally, with these ratios we could determine the GOSs of acetylene by normalizing them to the GOS of the 1s21S0 → 1s2p1P1 transition of helium (Xu et al. 1996; Cann & Thakkar 2002; Han & Li 2006), which has been measured and calculated with a high accuracy. The normalization processes can be found in detail in Liu et al. (2017) and Ni et al. (2017).
According to the Bethe theory (Bethe 1930, 1932; Inokuti1971; Bransden & Joachain 2003), the DCS for a definite excitation in the high-energy electron-scattering can be factorized into two factors: one dealing with the incident electron only, the other, referred to as the GOS, dealing with the target only. The GOS is defined as:
Here f(K, En) and dσn/dΩ stand for GOS and DCS, while Ψ0 and Ψn are the N-electron wavefunctions for the initial and final states, respectively. En and  are the excitation energy and momentum transfer, while p0 and pa are the incident and scattered electron momenta, respectively.
  is the position vector of the jth electron.
In the measurement procedures, the background pressure in the vacuum chamber was 5 × 10⁻⁵ Pa, and the flows of helium and acetylene were set as 0.5 sccm and 0.3 sccm, respectively, and were controlled by the CS200 mass flow meters produced by the Beijing Sevenstar Electronic Co. Ltd with a declared accuracy of better than 2%. The true zero angle was calibrated by the symmetry of the angular distribution of the inelastic scattering signals of the 1s21S0 → 1s2p1P1 peak of helium around the geometry nominal 0°. To exclude the influence of the pressure effect from the multiple-scattering (Zhong et al. 1997), the electron-energy-loss spectra were recorded with different flows at some angles. The GOSs of the valence-shell excitations of acetylene at different pressures are in coincidence within the experimental uncertainties, which indicates that the present work is free from the pressure effect.
The typical electron-energy-loss spectrum of acetylene at a scattering angle of 3° is shown in Figure 1(a), and a 2D map for the GOS densities (GOSDs) of the valence-shell excitations of molecular acetylene versus the energy-loss and squared momentum transfer measured is shown in Figure 1(b), in which the 2D of the valence-shell excitations of acetylene was obtained by transferring the measured electron-energy-loss spectra to the GOSD scale at every scattering angle. In Figure 1(a), the assignments for the valence-shell excitations of acetylene were taken from Suto & Lee (1984). In the 8.0–8.9 eV region, the intensities for the individual transitions of R30–R33 were obtained by numerically integrating the spectra under the peak in the ranges of 8.00–8.28 eV, 8.28–8.51 eV, 8.51–8.74 eV, and 8.74–8.90 eV, respectively, and a similar treatment has been used to determine the OOSs of the R30–R33 transitions by Cooper et al. (1995). In the 8.9–10.0 eV region, the least-squares fitting method was used to fit the experimental spectra by the Gaussian curve in order to determine the intensities of the valence-shell excitations. Note that the present energy resolution of 70 meV is insufficient for separating the excitations from the curve-fitting procedures, so the GOSs for the sum of the excitations, i.e.,  +
+ +
+  + R'30 + R‴30,
  +
+  +
+  + R'31 + R‴31, R'32 + R‴32, and R40 + R''40, are given.
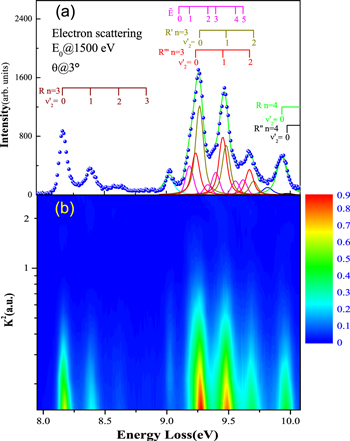
Figure 1. (a): A typical electron-energy-loss spectrum of the valence-shell excitations of acetylene at an incident electron energy of 1500 eV and a scattering angle of 3°. The solid lines are the fitted curves. (b): 2D map of the GOSDs of molecular acetylene vs. the energy-loss and squared momentum transfer measured by the present high-energy electron-scattering.
Download figure:
Standard image High-resolution imageUnlike the Rydberg series of acetylene, the virtual valence  state is not linear and has the v4 and v5 vibrations, which are the trans and cis bending vibrational modes, respectively. The vibronic transitions of the
  state located at 9.102, 9.187, 9.335, 9.398, 9.558, and 9.619 eV, as used by Cooper et al. (1995), are written as
  in the present work for clarification. According to the assignment of Suto & Lee (1984), the transitions of the
  ,
,  ,
,  , and
, and  each only include one vibronic transition, while the transitions of
  and
and  each include two vibronic transitions due to the narrow energy interval (about 30 meV) between them.
The present GOSs of the valence-shell excitations of acetylene are shown in the corresponding figures and Table 1. The experimental errors of the GOSs in the present work are from the definite angular resolution, the statistical counts, the fitting procedure, and the normalizing procedure, which are also shown in the corresponding figures and Table 1.
Table 1. The Present GOSs of the Valence-shell Excitations of Acetylene
| K2 (au) | R30 | R31 | R32 | R33 |
 + +  + + 
|
 + +  + + 
|
R'32 + R‴32 | R40 + R''40 |
|---|---|---|---|---|---|---|---|---|
| +R'30 + R‴30 | +R'31 + R‴31 | |||||||
| 0.14 | 55.30(3.34) | 31.30(3.43) | 11.02(2.65) | 5.81(1.25) | 109.88(6.00) | 124.02(7.46) | 34.07(2.34) | 44.97(2.73) |
| 0.21 | 36.19(2.30) | 21.10(1.82) | 8.36(0.58) | 5.06(1.46) | 87.43(4.76) | 94.39(5.85) | 24.25(1.98) | 30.86(1.95) |
| 0.31 | 20.78(1.69) | 13.51(3.80) | 5.61(2.67) | 3.21(1.31) | 68.34(4.38) | 67.57(4.30) | 16.88(1.35) | 19.26(1.29) |
| 0.41 | 11.99(1.11) | 7.68(2.55) | 3.62(1.73) | 2.09(0.92) | 49.14(3.43) | 48.01(3.35) | 11.90(1.11) | 12.13(0.82) |
| 0.54 | 5.81(0.72) | 3.93(2.08) | 2.25(1.49) | 1.40(0.39) | 34.26(2.33) | 32.93(2.30) | 8.22(0.83) | 7.43(0.55) |
| 0.66 | 3.52(0.41) | 2.54(0.22) | 1.46(0.17) | 0.98(0.46) | 26.54(1.74) | 24.37(1.67) | 5.93(0.60) | 5.26(0.42) |
| 0.81 | 1.62(0.89) | 1.16(0.54) | 0.78(0.27) | 0.56(0.37) | 16.66(1.12) | 14.78(1.08) | 3.89(0.45) | 2.98(0.30) |
| 0.98 | 1.15(0.34) | 0.99(0.13) | 0.65(0.09) | 0.49(0.22) | 11.16(0.83) | 10.32(0.85) | 2.42(0.34) | 2.23(0.23) |
| 1.19 | 1.39(0.44) | 1.17(0.15) | 0.70(0.12) | 0.37(0.23) | 7.07(0.61) | 6.63(0.63) | 1.45(0.31) | 1.86(0.26) |
| 1.39 | 1.74(0.36) | 1.35(0.14) | 0.72(0.10) | 0.34(0.22) | 5.40(0.44) | 4.70(0.44) | 1.23(0.23) | 1.71(0.23) |
| 1.64 | 2.28(0.36) | 1.78(0.13) | 0.93(0.10) | 0.49(0.16) | 4.51(0.78) | 4.33(0.69) | 0.80(0.36) | 2.23(0.41) |
| 2.18 | 2.29(0.31) | 1.97(0.13) | 1.12(0.09) | 0.48(0.17) | 3.95(0.54) | 3.53(0.72) | 0.74(0.43) | 2.02(0.16) |
| 2.76 | 2.11(0.57) | 1.75(0.20) | 0.96(0.12) | 0.53(0.22) | 4.10(0.41) | 3.30(0.95) | 0.79(0.64) | 1.80(0.21) |
Note. The listed data are amplified by a factor of  . The data in parentheses represent the corresponding experimental uncertainties.
Download table as: ASCIITypeset image
3. Results and Discussion
According to Lassettre (1965) and Tanaka et al. (2016), the GOSs of the valence-shell excitations of atoms and molecules can be fitted by the formula

Here, x = K2/α2 with ![$\alpha ={(2I)}^{1/2}+{[2(I-{E}_{n})]}^{1/2}$](https://content.cld.iop.org/journals/0067-0049/234/1/10/revision1/apjsaa9cefieqn27.gif) , and I is the ionization energy. l and l' are the orbital angular momenta of the initial and final states of the excited electron, while M is an integer that is relevant to the transition multipolarity, and fm are the fitting parameters. Since the ionization energy I of an electron in a molecule is defined only in the context of a simply independent particle model by Lassettre (1965), it is better to simply take α2 as a fitting parameter along with fm, as proposed by Kim (2007).
, and I is the ionization energy. l and l' are the orbital angular momenta of the initial and final states of the excited electron, while M is an integer that is relevant to the transition multipolarity, and fm are the fitting parameters. Since the ionization energy I of an electron in a molecule is defined only in the context of a simply independent particle model by Lassettre (1965), it is better to simply take α2 as a fitting parameter along with fm, as proposed by Kim (2007).
The present GOSs of the R30, R31, R32, and R33 excitations of acetylene are shown in Figure 2. It is clear from Figure 2 that the GOSs from the intense R30 excitation to the weak R33 excitation have similar tendencies, and the positions of the minima of the GOSs are at about 1.0 au. Meanwhile, the present GOSs of the  +
+  +
+  + R'30 + R‴30,
  +
+  +
+  + R'31 + R‴31, R'32 + R‴32, and R40+ R''40 excitations of the acetylene molecule, and their fitted curves, have been obtained and are shown in Figure 3. There are no other theoretical calculations and experimental measurements available for comparison, to the best of our knowledge.
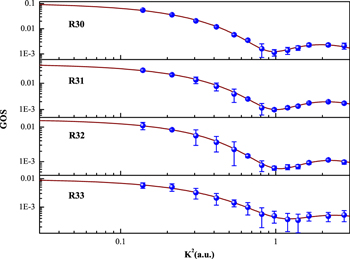
Figure 2. Present GOSs of the R30, R31, R32, and R33 excitations of the acetylene molecule. The dots are the present results, and the solid lines are their fitted curves.
Download figure:
Standard image High-resolution image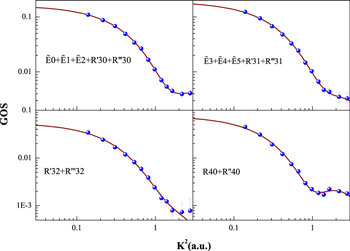
Figure 3. Present GOSs of the  +
+  +
+  + R'30 + R‴30,
  +
+  +
+  + R'31 + R‴31, R'32 + R‴32, and R40 + R''40 excitations of the acetylene molecule. The dots are the present results, and the solid lines are their fitted curves.
Download figure:
Standard image High-resolution imageAccording to Equation (2), the OOSs f0 of the dipole-allowed transitions of acetylene molecule can be obtained by extrapolating the GOSs to the limit of the squared momentum transfer K2 → 0. The present OOSs of the R30, R31, R32, and R33 excitations of acetylene are shown in Figure 4 and Table 2 along with the previously available ones from the dipole (e, e) measurement method (Cooper et al. 1995; see Figure 4(a)), the photoabsorption measurements (Moe & Duncan 1952; Gedanken & Schnepp 1976; Suto & Lee 1984; Smith et al. 1991; Wu et al. 2001; Cheng et al. 2011) (see Figure 4(b)), and the theoretical calculations (Demoulin & Jungen 1974; Jensen et al. 1990) (see Figure 4(c)). As shown in Figure 4(a), the present OOSs of the R30, R31, and R32 transitions match the dipole (e, e) ones of Cooper et al. (1995) very well. As for the weakest R33 transition, the difference between the present result and the dipole (e, e) result of Cooper et al. (1995) may be from the extrapolating process or the influence of the strong transitions.

Figure 4. Present OOSs of the R30, R31, R32, and R33 excitations of acetylene along with the previously available ones from top to bottom.
Download figure:
Standard image High-resolution imageTable 2. The OOSs of the Valence-shell Excitations of Acetylene
| R30 | R31 | R32 | R33 |
 + +  + + 
|
 + +  + + 
|
R'32 + R‴32 | R40 + R''40 | |
|---|---|---|---|---|---|---|---|---|
| +R'30 + R‴30 | +R'31 + R 
|
|||||||
| Present OOSs | 106.2(7.7) | 55.1(3.0) | 16.9(1.8) | 9.8(2.0) | 161.7(8.2) | 189.7(10.6) | 54.7(5.5) | 76.4(6.9) |
| Electron impact | ||||||||
| Cooper et al. (1995) | 105.2(10.5) | 53.3(5.3) | 16.4(1.6) | 6.1(0.5) | 161.0(16.1) | 185.5(18.6) | 53.4(5.3) | 76.0(7.6) |
| Photoabsorption | ||||||||
| Smith et al. (1991) | 101.0(10.1) | 41.0(4.1) | 8.0(0.8) | ⋯ | ⋯ | ⋯ | ⋯ | ⋯ |
| Wu et al. (2001) | 85.9(8.6) | 42.5(4.3) | 8.7(0.9) | 3.4(0.4) | ⋯ | ⋯ | ⋯ | ⋯ |
| Cheng et al. (2011) | 85.0(8.5) | 41.4(4.1) | 8.5(1.0) | 3.3(0.4) | ⋯ | ⋯ | ⋯ | ⋯ |
| Suto & Lee (1984) | 78.5 | 33.3 | 9.2 | 2.9 | ⋯ | ⋯ | 38.2 | 51.2 |
| Gedanken & Schnepp (1976) | 74.3 | 30.6 | 4.6 | ⋯ | ⋯ | ⋯ | ⋯ | ⋯ |
| Moe & Duncan (1952) | 61.6 | ⋯ | ⋯ | ⋯ | ⋯ | ⋯ | ⋯ | 22.9 |
| Theoretical calculation | ||||||||
| Jensen et al. (1990) | 104.6 | 40.8 | 9.4 | 1.7 | ⋯ | ⋯ | ⋯ | ⋯ |
| Demoulin & Jungen (1974) | 72.0 | ⋯ | ⋯ | ⋯ | ⋯ | ⋯ | ⋯ | ⋯ |
Note. The listed data are amplified by a factor of 103. The data in parentheses represent the corresponding experimental uncertainties.
Download table as: ASCIITypeset image
The previous OOSs of the R30, R31, R32, and R33 excitations of acetylene measured by the photoabsorption method (Moe & Duncan 1952; Gedanken & Schnepp 1976; Suto & Lee 1984; Smith et al. 1991; Wu et al. 2001; Cheng et al. 2011) are also shown in Figure 4(b). It can be seen that the early photoabsorption results of Gedanken & Schnepp (1976) and Moe & Duncan (1952) are obviously lower than the present OOSs, which may be due to the limitations of the technique at that time. Additionally, it is also clear from Figure 4(b) that the present OOS of the R30 transition is consistent with that of Smith et al. (1991) at an energy resolution of better than 0.005 nm, and is only slightly higher than the photoabsorption results of Wu et al. (2001) at the energy resolution of 0.007 nm, and the results of Cheng et al. (2011) at the energy resolution of 0.02 nm and Suto & Lee (1984) at the energy resolution of 0.04 nm. To our surprise, the discrepancies between the present OOSs and the photoabsorption ones of Wu et al. (2001), Cheng et al. (2011), Suto & Lee (1984), and Smith et al. (1991) gradually become larger and larger from the intense R30 transition to the weak R33 transition. This phenomenon for the R30–R33 excitations is distinctly different from the typical behavior of the line-saturation effect in which the discrepancies between the OOSs measured by the photoabsorption method and the true OOSs are larger and larger for the stronger and stronger transitions, such as the behavior of nitrogen (Liu et al. 2016). The rotational lines of the acetylene molecule seriously broaden and overlap due to the fast dissociation, causing the rotational structures of the R30–R33 transitions to disappear (Hu et al. 2008). Therefore, it is not likely that the more narrow widths of the higher vibronic states result in lower values of the OOSs measured by the photoabsorption method. Additionally, with the increasing of the  mode of the R30–R33 transitions, the continuum oscillator strength underlying the R30–R33 transitions becomes more significant, i.e., more comparable to the OOSs of the R30–R33 transitions for the present OOSs and the dipole (e, e) ones (Cooper et al. 1995). However, the contributions of the continuum oscillator strength underlying the R30–R33 transitions for the OOSs by the photoabsorption method are lower than those for the present OOSs and the dipole (e, e) ones (Cooper et al. 1995). So it is likely that the large differences between the OOSs of the R30–R33 transitions at high
  are caused by the differences in the measurement methods and/or analysis of this continuum oscillator strength.
As for the theoretical calculation, it is clear from Figure 4(c) that for the R30 transition the present OOSs matches the calculated value from Jensen et al. (1990), but are higher than the calculations of Demoulin & Jungen (1974), while for the R31, R32, and R33 transitions, the present OOSs are higher than the calculations of Jensen et al. (1990).
In addition, the OOSs of the  +
+  +
+  + R'30 + R‴30,
  +
+  +
+  5 + R'31 + R‴31, R'32 + R‴32, and R40 + R''40 excitations of the acetylene molecule are also determined according to Equation (2), and are shown in Figure 5 and Table 2. It is clear from Figure 5 that the present OOSs of these excitations match the dipole (e, e) ones of Cooper et al. (1995) well. Meanwhile, the present results are higher than the early photoabsorption results of Suto & Lee (1984) and Moe & Duncan (1952) for the R'32 + R‴32 and R40 + R''40 excitations, which may be due to the limitations of the technique at that time.
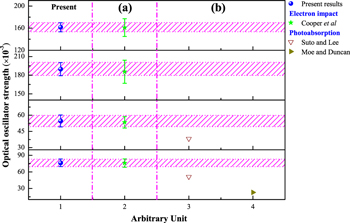
Figure 5. Present OOSs of the  +
+  +
+  + R'30 + R‴30,
  +
+  +
+  + R'31 + R‴31, R'32 + R‴32, and R40 + R''40 excitations of acetylene along with the previously available ones from top to bottom.
Download figure:
Standard image High-resolution imageRecently, Kim (2001, 2007) developed the BE-scaling method to calculate the ICSs of the dipole-allowed excitations of atoms and molecules based on the scaled plane-wave Born models, and reliable ICSs for many atoms and molecules (Tanaka et al. 2016) have been determined by the BE-scaling method, such as He, H2 and CO. As pointed out by Tanaka et al. (2016), the BE-scaling method has the advantage of producing reliable ICSs at low impact energies and bridges the large gap between low-energy and high-energy electron-scattering. The BE-scaled ICSs  can be written as

Here, B is the binding energy.  stands for the Born cross section at an incident electron energy of E0:

 and
and  represent the maximum and minimum squared momentum transfers, respectively.
Then, based on the present GOSs, the ICSs of the valence-shell excitations of acetylene are obtained from the threshold to 5000 eV with the aid of the BE-scaling method according to Equations (1)–(4), which are shown in Figures 6 and 7 and and Table 3. Moreover, the ICSs of the valence-shell excitations of acetylene are obtained systematically for the first time. Unfortunately, there are no other theoretical calculations and experimental measurements for comparison, to the best of our knowledge, so further research on the ICSs of the valence-shell excitations of acetylene is greatly recommended.
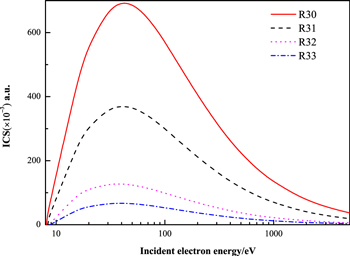
Figure 6. Present ICSs of the R30, R31, R32, and R33 excitations of acetylene at different electron impact energies.
Download figure:
Standard image High-resolution image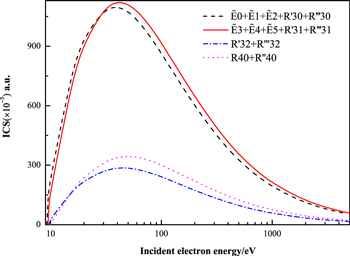
Figure 7. Present ICSs of the  +
+  +
+  + R'30 + R‴30,
  +
+  +
+  + R'31 + R‴31, R'32 + R‴32, and R40 + R''40 excitations of acetylene at different electron impact energies.
Download figure:
Standard image High-resolution image
Table 3. Present ICSs of Valence-shell Excitations of Acetylene from the BE-Scaling Method (in Atomic Units) at Different Electron Impact Energies
| E0 (eV) | R30 | R31 | R32 | R33 |
 + +  + + 
|
 + +  + + 
|
R'32 + R‴32 | R40 + R''40 |
|---|---|---|---|---|---|---|---|---|
| +R'30 + R‴30 | +R'31 + R‴31 | |||||||
| 15 | 420.5 | 231.8 | 86.7 | 43.6 | 727.5 | 674.3 | 156.8 | 157.4 |
| 17.5 | 500.7 | 274.8 | 101.1 | 51.3 | 853.2 | 811.4 | 193.0 | 204.3 |
| 20 | 559.1 | 305.3 | 110.8 | 56.7 | 939.8 | 909.2 | 219.6 | 239.9 |
| 30 | 671.5 | 361.5 | 126.7 | 65.9 | 1087.2 | 1091.3 | 272.8 | 316.0 |
| 40 | 695.7 | 371.5 | 127.7 | 67.1 | 1102.5 | 1127.3 | 286.7 | 340.7 |
| 50 | 688.1 | 365.6 | 124.1 | 65.5 | 1075.5 | 1112.3 | 286.0 | 345.0 |
| 60 | 668.3 | 353.8 | 119.0 | 63.1 | 1034.2 | 1078.3 | 279.3 | 340.5 |
| 70 | 644.0 | 340.0 | 113.6 | 60.5 | 989.4 | 1037.7 | 270.3 | 331.9 |
| 80 | 618.8 | 326.0 | 108.4 | 57.8 | 945.1 | 995.8 | 260.5 | 321.8 |
| 90 | 594.0 | 312.4 | 103.4 | 55.3 | 903.0 | 955.0 | 250.7 | 311.1 |
| 100 | 570.4 | 299.6 | 98.8 | 52.9 | 863.6 | 916.2 | 241.2 | 300.5 |
| 150 | 473.3 | 247.4 | 80.6 | 43.5 | 707.2 | 757.9 | 201.4 | 254.1 |
| 200 | 404.7 | 211.0 | 68.3 | 36.9 | 599.9 | 646.7 | 172.8 | 219.5 |
| 300 | 316.1 | 164.3 | 52.7 | 28.6 | 464.2 | 503.8 | 135.5 | 173.5 |
| 400 | 261.4 | 135.6 | 43.3 | 23.6 | 381.6 | 415.9 | 112.3 | 144.4 |
| 500 | 224.0 | 116.0 | 36.9 | 20.1 | 325.7 | 355.9 | 96.3 | 124.3 |
| 600 | 196.7 | 101.8 | 32.3 | 17.6 | 285.2 | 312.2 | 84.7 | 109.5 |
| 700 | 175.8 | 90.9 | 28.8 | 15.7 | 254.3 | 278.9 | 75.7 | 98.1 |
| 800 | 159.3 | 82.3 | 26.0 | 14.2 | 229.9 | 252.5 | 68.6 | 89.1 |
| 900 | 145.8 | 75.3 | 23.8 | 13.0 | 210.1 | 231.0 | 62.9 | 81.7 |
| 1000 | 134.7 | 69.5 | 21.9 | 12.0 | 193.7 | 213.2 | 58.1 | 75.5 |
| 1500 | 98.4 | 50.7 | 15.9 | 8.7 | 140.9 | 155.5 | 42.5 | 55.4 |
| 2000 | 78.3 | 40.3 | 12.6 | 6.9 | 111.8 | 123.6 | 33.8 | 44.3 |
| 2500 | 65.5 | 33.7 | 10.5 | 5.8 | 93.2 | 103.2 | 28.3 | 37.1 |
| 3000 | 56.5 | 29.0 | 9.1 | 5.0 | 80.2 | 89.0 | 24.4 | 32.0 |
| 4000 | 44.6 | 22.9 | 7.1 | 3.9 | 63.2 | 70.2 | 19.3 | 25.3 |
| 5000 | 37.0 | 19.0 | 5.9 | 3.3 | 52.4 | 58.3 | 16.0 | 21.1 |
Note. The listed data are amplified by a factor of 103.
Download table as: ASCIITypeset image
4. Summary and Conclusions
In the present work, the GOSs of the valence-shell excitations of R30–R33,  +
+  +
+  + R'30 + R‴30,
  +
+  +
+  + R'31 + R‴31, R'32 + R‴32, and R40 +R''40 of acetylene have been determined by the high-energy electron-scattering technique. Based on the present GOSs, the OOSs of the valence-shell excitations of acetylene have been obtained by extrapolating the GOSs to the limit of the squared momentum transfer K2 → 0. It is found that the OOSs for the R30–R33 excitations measured by the photoabsorption method violate the typical behavior of the line-saturation effect, possibly because of fast dissociation of acetylene and the effect of the continuum oscillator strength underlying the R30–R33 transitions. The present OOSs provide an independent cross-check on previous experimental and theoretical results, and can serve as benchmark data. Moreover, the ICSs of the valence-shell excitations of acetylene have been obtained systematically from the threshold to 5000 eV for the first time with the aid of the newly developed BE-scaling method. The present OOSs and ICSs of the valence-shell excitations of acetylene serve an important role in modeling the abundance of acetylene in the upper atmospheres of Jupiter, Saturn, Titan, Uranus, Neptune, and Pluto, and are crucial for improving these atmospheric models.
This work is supported by the National Natural Science Foundation of China (No. U1332204, 11504361, U1732133, and 11320101003) and the National Key Research and Development Program of China (No. 2017YFA0402300 and 2017YFA0303500).