


Abstract
We have discovered a presolar olivine from ALH 77307 with the highest 25Mg isotopic composition measured in a silicate to date (δ25Mg = 3025.1‰ ± 38.3‰). Its isotopic compositions challenge current stellar models, with modeling of magnesium, silicon, and oxygen showing a closest match to formation in a supernova (SN) where hydrogen ingestion occurred in the pre-SN phase. Presolar grains within primitive astromaterials retain records of processes and environmental changes throughout stellar evolution. However, accessing these records has proved challenging due to the average grain size (∼150 nm) of presolar silicates, their sensitivity to extraction agents, and instrumental restrictions, limiting the range of isotopic and chemical signatures which can be studied per grain volume. Here, we present the first known detailed geochemical study of a presolar silicate from a hydrogen-burning SN, studied in 3D without contributions to the analysis volume and at unprecedented spatial resolutions (<1 nm), essential for constraining physical and chemical processes occurring within this recently proposed stellar environment. From our results, we infer either (i) condensation within an environment depleted of heavy elements compatible with the olivine lattice under the pressure and temperature conditions during condensation, or (ii) during periods of limited mixing either near the end of the pre-SN phase or from a collapse so rapid localized pockets of different gas compositions formed.
Export citation and abstract BibTeX RIS

Original content from this work may be used under the terms of the Creative Commons Attribution 4.0 licence. Any further distribution of this work must maintain attribution to the author(s) and the title of the work, journal citation and DOI.
1. Introduction
Presolar grains are records of a single moment in stellar evolution, providing important clues for refining our understanding of physical and chemical processing, and environmental conditions in external stellar systems and early solar system environments. Oxygen-rich presolar silicate grains are the most mineralogically and chemically diverse type of presolar grains, preserving a wealth of evolutionary knowledge retained within their isotopic and chemical signatures. For example, these signatures can trace the chemical evolution of our Galaxy and retain records of nucleosynthesis, stellar evolution, the physical properties of stellar atmospheres, mixing from the inner core to outer envelopes, ionization processes in the interstellar medium (ISM), and parent-body processing. However, requirements for presolar silicates to be identified in situ due to their sensitivity to extraction agents, their average grain size ∼150 nm (rarely exceeding 500 nm), and instrumental restrictions have limited the range of isotopic and chemical signatures that can be studied per grain volume (Nguyen & Zinner 2004; Zinner 2014).
Isotopic imaging via nanoscale secondary ion mass spectrometry (NanoSIMS) provides a rapid and efficient approach for locating and constraining isotopic signatures in presolar grains, which led to the discovery of presolar silicates (Nguyen & Zinner 2004). Through comparisons with oxygen (O) and magnesium (Mg) isotopic imaging, astronomical observations, and dust-production models, presolar silicates are categorized into four groups based on their 17O/16O and 18O/16O isotopic ratios. Recently, Group 1 and Group 2 presolar silicates were further subcategorized based on their Mg isotopes relative to solar: (1) normal, (2) 25Mg-rich, (3) 26Mg-rich, and (4) 25Mg-poor (Nittler et al. 2008; Zinner 2014; Hoppe et al. 2021). While not exact, these categories provide the framework for discriminating the stellar source of each grain, e.g., asymptotic giant branch (AGB), red giant branch (RGB), intermediate-mass AGB stars with supersolar metallicity, super-AGB stars, nova, and supernova (SN). Proposed Mg subcategories were constrained using data from 106 presolar grains collected on a Hyperion II radio-frequency (RF) plasma O primary ion source, which improved upon the limitations associated with previous NanoSIMS ion sources, e.g., the impact of isotopic dilution from matrix effects (Hoppe et al. 2021). Using this ion source, the highest Mg isotopic signatures were recorded in presolar silicates thus far, e.g., δ25Mg = ∼1360‰, which highlights the value in applying continually improving technical advancements to the study of presolar grains (Leitner & Hoppe 2019; Hoppe et al. 2021).
Atom probe tomography (APT) has the highest spatial resolution of any microanalysis technique. In contrast to NanoSIMS, APT is a 3D analysis method which requires no preselection of elements and measures all ions on the periodic table (except for noble gases) at 10 appm or 0.001 at% detection limits within the same analysis volume to a spatial resolution that far exceeds other established techniques (Reddy et al. 2020). Application of APT to presolar grains expands the range of isotopic signatures and elemental abundances that can be measured in each presolar silicate, without contributions to the analysis volume from surrounding materials (i.e., matrix effects). Laser-assisted field evaporation in APT improves the detection efficiency over sputtering or ion ablation techniques, eliminates problems associated with isotopic mass fractionation and incomplete ionization, and permits an unbiased detection of ions irrespective of elemental species, charge state, or atomic weight (Reddy et al. 2020). Considering the mineralogical and chemical diversity and average grain size (∼100 ≤ 700 nm) of presolar silicate grains, the wealth of information gained from the addition of APT to the analysis workflow could provide important clues on stellar evolution and unique information that has not been previously accessible.
Here, we report the discovery and detailed categorization of a presolar silicate (forsterite) grain from a hydrogen-burning core-collapse supernova (CCSN) with the highest δ25Mg value measured in a silicate grain thus far. This presolar grain forms part of a larger correlative study of presolar oxides and silicates via APT, NanoSIMS, and scanning electron microscopy (SEM).
2. Methods
Our experimental procedure was as follows (Nevill 2022). Approximately 1–2 cm thin sections were polished with 1 mm diamond paste and coated in a ∼2.5 nm thick evaporative carbon coat. Optical mosaics of thin sections were then acquired using the Zeiss Axioskop 2 Plus microscope with a 20× (0.75 N.A.) apochromat objective lens. Mosaics established a reference for spatially correlating reflected-light and secondary-electron (SE) NanoSIMS images of isotopically mapped regions and photomicrographs from SEM analysis for identifying target presolar grains for APT extraction (Nevill 2022).
2.1. Sample
The ALH 77307 carbonaceous chondrite was collected by the ANtarctic Search for METeorites (ANSMET) Program from the Allan Hills of Antarctica and curated at NASA's Johnson Space Centre (JSC; Allen et al. 2011; Righter et al. 2014). This meteorite is considered among the most pristine and primitive meteorites ever discovered and has an average matrix-normalized presolar silicate grain abundance of 119–190 ppm. Its matrix is comprised of fine-grained (∼100–500 nm) primarily anhydrous phases, enriched in silicates, Fe-Ni sulfides, organics, and amorphous material (Brearley 1993). Consequently, presolar silicates have largely escaped the effects of thermal and aqueous alteration on their parent asteroid.
2.2. NanoSIMS
Characteristic O isotopic signatures consistent with external stellar systems were identified using NanoSIMS ion imaging with the Compagnie des Applications Mécaniques et Electroniques au Cinéma et á l'Atomistique (CAMECA) NanoSIMS 50L ion probe at the Centre for Microscopy, Characterisation, and Analysis (CMCA), University of Western Australia. Ion imaging throughout this project was conducted by rastering a 1.6–2 pA, <200 nm focused 16 keV Cs+ primary ion beam over a 20 μm square field of view. Initially negative secondary ions of 16O, 17O, 18O, 28Si, 29Si, 30Si, and 32S were measured using electron multipliers in multi-detection mode. Grains were considered presolar (formed in an external stellar system) when O isotopes exceeded 3σ from solar values (or "normal" grains in the same image; Zinner et al. 2003; Nguyen et al. 2007). The image run consisted of two frames over 1 hr. Isotopic delta values and O isotopic ratios across all techniques in this study were calculated using standard practices (Barnes et al. 1975; Lodders 2003). Chemical ion imaging was collected using NanoSIMS for improved accuracy when locating presolar grains within complex mineral matrices. Ion imaging focused on collection of 16O, 17O, 18O, 24Mg 16O, 27Al 16O, 56Fe 16O, 48Ti 16O, and SE imaging at 15 ms dwell times. The grain within this study was measured as part of a larger study representing the first measurement of O-rich presolar grains using APT (Nevill 2022). Consequently, to aid in locating each presolar grain within the matrix at higher precisions for focused ion beam (FIB) extraction, Mg, Fe, Al, and Ti elements were selected as they are representative of the most common major elements within presolar oxide and silicate grains. The data reduction used software developed by the team at NASA JSC. A detailed breakdown of this software and methods used for quasi-simultaneous arrival of secondary ions, electron multiplier dead times, and instrumental mass fractionation are discussed in Nguyen et al. (2022).
2.3. Scanning Electron Microscope
Initial chemical analysis and morphology of the target presolar grain and its mineralogical context with surrounding mineral matrices was determined using the Tescan Clara SEM at JdLC equipped with a high-sensitivity Ultim Max 170 SDD energy dispersive X-ray (EDX) detector. This EDX detector has a larger sensor than detectors used in previous studies of presolar grains, measuring at a higher sensitivity and accuracy when data are taken at the same beam energy as previous instruments. Point analysis and hyperspectral elemental maps were collected at 10 kV, with a beam current of 3 pA. Point analysis and hyperspectral elemental maps were processed using Aztec Oxford instruments software.
2.4. Site-specific Focus Ion Beam
The specimen was extracted and milled into a needle-like shape for APT analysis (Figure A1) using the Tescan Lyra3 GM FIB-SEM at the JdLC, Curtin University. The specimen needle was milled 50 nm in diameter at the apex, with a ∼5° half-shank angle (Nevill 2022). Backscattered electron images (BSE), SE images, and EDX data were collected in the Tescan Lyra3 for targeting and correlating target submicrometer grains for extraction. Hyperspectral elemental maps in the Tescan Lyra3 were collected at 15–20 kV using a beam current of 1 nA as required across target regions and an Oxford X-max 50 EDX detector. APT needles were prepared using established methods with a few adaptations (Miller & Russell 2007; McKenzie et al. 2010; Miller & Forbes 2014; Lee & Ahn 2016; Nevill 2022). (1) A platinum (Pt) "button" fiducial was electron-beam deposited on the surface of the sample for improved centering at the apex of the needle over the desired grain or region per the requirements of the sample (Miller & Russell 2007). This button was visible beneath the subsequently deposited protective Pt layer (5 × 2 μm; Rickard et al. 2020). (2) The outer edges of the Pt layer were milled away to form a wedge-like shape (2.5 × 3.8 × 3.8 μm) using a 30 kV Ga+ ion beam (Miller & Forbes 2014; Lee & Ahn 2016). The shape, apex, and shank angles of the needle tips are designed to optimize controlled evaporation of specimen ions during acquisition. Final polishing of the apex of the specimen used an ion-beam accelerating voltage of 2 kV to remove the damaged/gallium implanted layer. During this process, unwanted sample coatings like carbon, deposited Pt and Cs+ ions (consistent with the NanoSIMS ion beam) were milled away. This stage is conducted visually under SEM conditions, permitting a degree of human error regarding the removal of surface coatings and remnants of previous techniques. Residual contaminants had no impact on APT data processing or interpretation and were readily identified from spectral and spatial distribution relationships. For example, naturally occurring Ga+ exhibits two isotopes (69Ga+ and 70Ga+) unlike the pure 69Ga+ ion beam used within the FIB-SEM. Collection of BSE images throughout the preparation process enabled tracking of each stage of sample preparation and estimation of starting radii at the apex of each specimen as required for APT data processing.
2.5. Atom Probe Tomography
Elemental abundances, subnanometer spatial distributions of each atom in 3D, and Mg isotopic compositions were measured using the CAMECA Local Electrode Atom Probe, LEAP 4000X HR, within the Geoscience Atom Probe facility at the JdLC, Curtin University. Isotopic compositions were calculated using custom methods detailed in Section 2.7.1. APT uses an electric field coupled with a high-frequency pulsed laser to desorb ions from the surface, resulting in ionization yields close to 100%. These ions are measured using a position-sensitive detector, with a detection efficiency of 35%. See Reddy et al. (2020) for a recent review of this technique and its application to the geosciences.
Data reconstruction and processing used CAMECA Atom Probe (AP) Suite v6.0 processing software and Integrated Visualization and Analysis Software (IVAS) v3.8. Experimental conditions, acquisition parameters, and data-reconstruction parameters are detailed per recommendations by Blum et al. (2017) in Table A1. Preselection of elements and standards are not required, with background noise, mass peak overlaps, and detector saturation assessed within distinct regions of individual data sets. Any residual coating contaminants were readily identified and eliminated from data sets.
2.6. Atom Probe Tomography Data Quality Assessment
Data quality is assessed using background noise, spatial resolution, mass resolving power (MRP), and multiple detector (multi-hit) events (Kinno et al. 2012; Kirchhofer et al. 2013; Thuvander et al. 2013; Meisenkothen et al. 2016, 2020; Blum et al. 2017; Reddy et al. 2020). N-AL6 has a high MPR (918.78) and spatial resolution, with elevated background levels and peak tails primarily associated with one hump in the lower end of the spectrum, which degraded into background noise and had minimal impact on measured isotopes.
2.7. Atom Probe Tomography Data-processing Methods
2.7.1. Quantifying Atom Probe Tomography Isotopic Measurements
Data were extracted for isotopic peak calculations using the approach described by Meisenkothen et al. (2020), where the corrected time-of-flight data are extracted from the calibration and reconstruction wizard within the Cameca IVAS software. This involves selecting only the single-hit detection events before other filters or corrections (e.g., ion-feedback corrections) are applied to the data (Meisenkothen et al. 2020). This data selection (labeled "Singles (CRW) + Fitting" in Meisenkothen et al. 2020) was found to give accurate results when applied to several reference samples, without the application of any deadtime corrections.
Isotopic ratios were then calculated using the peak quantification and background approach illustrated in Figure A2. The peak and background range limits are positioned in identical locations with respect to each of the two peaks, which ensures that the same proportion of each peak is sampled when the counts are summed between these limits (also known as the constant-width method). The counts within each background range are then used to estimate the background level present under the following peak using a simple constant background model. Uncertainties in the peak counts and background counts are based on the usual counting statistics approximation and are propagated through the background corrections into the corrected peak ratio.
To test the robustness of this approach to the present data, the range width used to sum the peak counts was varied from 2.7 to 5.5 ns, with the peak ratio calculated for each case. Figure A3(a) shows the ratio varies by only a small amount, well within the 1σ uncertainty range for each measurement, indicating that the method used here is robust against the user-selected peak width. Likewise, the background range width was varied between 2.7 and 5.3 ns by moving the left boundary, while holding the peak width at 5.5 ns. Again, there is only a small variation in the measured ratio, as seen in Figure A3(b). There is a downward trend as the background range is increased, which is consistent with the small slope in the background level before the 25Mg++ peak (Figure A2), as a higher background estimate tends to reduce the corrected 25Mg++ counts. Mg delta values were calculated using the formula i Mg/24Mg = ((i Mg/24Mgsample/i Mg/24Mgstandard) − 1) × 1000, where the standard is the solar i Mg/28Mg ratio (Catanzaro et al. 1966; Lodders 2003).
Recent studies measuring isotopic ratios across minerals/particles with different chemical compositions, MRP, and detection events noted no biases between different ion species or charge states relative to the number of counts associated with each ion species (Kelly 2011; Meisenkothen et al. 2020). This similarity of peak shapes within a quantified and corrected time-of-flight spectra arises from an understanding of the physical processes (e.g., laser energy absorption, thermal conduction, field evaporation) which act on each isotope of the same chemical element without any significant dependence on the ion mass (i.e., no significant mass fractionation effects). Therefore, peaks are assumed to differ only in a scale factor in their contribution of signal above the background. Consequently, multiple charge states are not required to calculate isotopic abundances, enabling peaks without interferences and significant ion counts to be selected for measuring isotopes. This approach has been found to produce reliable and accurate isotopic ratios from APT samples, including from reference materials (Kelly 2011; Daly et al. 2018; Meisenkothen et al. 2020; Gopon et al. 2022).
While effective for measuring isotopic ratios, the constant-width method is impractical for calculating quantitative elemental abundances in measured phases. For example, this method neglects ions from thermal tails and does not account for peak variations, with each ion species often exhibiting different peak forms (Meisenkothen et al. 2020). Consequently, the full-width method was used for quantifying element concentrations, which incorporates the entire width of the peak.
2.7.2. Corrections for Hydride Complexes
Hydride complexes were readily identified within N-AL6. Hydride abundances formed during acquisition impact each ion equally within an ionic series (24Mg, 25Mg, and 26Mg = one series; Kelly 2011; Daly et al. 2018). As H combines with ions, heavier isotope peaks of the same element become skewed over lighter elements, e.g., 24MgH overlaps 25Mg, but 24Mg is free from H interferences. Therefore, H interferences require identifying, quantifying, and correcting for when conducting chemical and isotopic analyses. H2O+ is a known APT contaminant commonly found among APT spectra, and 17O+ and 16OH− are known to overlap each other. Separation of H2O+ from 18O+ and 17O+ from 16OH− requires a currently unattainable MRP (Kelly 2011). Therefore, these ions are precluded from further discussions. Peak-series SiH+ was identified within a series of three overlapping silicon (Si) peaks based on the broader peak shape at 29 m/z, which implies the presence of a H complex. The presolar silicate measured within this study also showed one additional hydride peak above thermal tails, i.e., SiOH+.
2.7.3. Isobaric Interferences
A series of three overlapping Si peak series were shown within the mass spectra from 30 to 31 m/z, including Si2+,  , and SiH+. Overlapping peaks Si+ and SiH+ alone cannot explain the disproportional peak heights or the presence of peak 30.5 m/z, implying a third overlapping peak series, i.e.,
  , starting at peak 30 m/z. An overlap of
  at 28 m/z (24Mg16O2
2+) and 29 m/z (25Mg16O2
2+) were discounted as no corresponding peak was present at 28.5 m/z (25Mg16O2
2+). These isobaric interferences did not impact isotopic calculations and had minimal impact on stochiometric calculations as overlapping peaks were comprised of the same ions, Si and O, and comprised minimal counts compared to the major ion series, i.e., Si+.
at 28 m/z (24Mg16O2
2+) and 29 m/z (25Mg16O2
2+) were discounted as no corresponding peak was present at 28.5 m/z (25Mg16O2
2+). These isobaric interferences did not impact isotopic calculations and had minimal impact on stochiometric calculations as overlapping peaks were comprised of the same ions, Si and O, and comprised minimal counts compared to the major ion series, i.e., Si+.
2.7.4. Uncertainty Calculations
The following equations detail the calculation of isotopic ratios using peaks without isobaric interferences and their calculated uncertainties. This equation considers background counts and the number of ions collected. All measurements were propagated to 1σ uncertainties.
(1) Calculating the isotopic ratio:

where Aisotope is the numerator ion of the isotopic ratio, Bisotope is the denominator ion of the isotopic ratio, Ac is the total value given when the background of ion A or the corrected value given by the software is subtracted from the raw ion counts, and Bc is the total value given when the background of ion B or the corrected value given by the software is subtracted from the raw ion counts.
(2) Calculating the uncertainty of m/z peaks A and B:

where Au is the uncertainty of the A m/z peak ion count, Ar is the raw ion count of the A peak, and Ab is the background count (take the corrected value from raw counts to isolate the background if the background is software corrected). The same formula should be applied to the B isotope.
(3) Calculating the uncertainty of the isotopic ratio:

where ± denotes the uncertainty associated with the isotopic ratio, Au is the uncertainty of the A m/z peak ion count, Ac is the background-corrected A value (see Equation (1)), Bu is the uncertainty of the B m/z peak ion count, and Bc is the background-corrected B value.
Delta ratio uncertainties were calculated by adding the calculated uncertainty to the isotopic ratio, determining the new delta ratio using the isotopic delta formula associated with that element (Section 2.4), and extracting it from the original delta value. The difference represents the delta uncertainty. The same calculation must then be conducted for confirmation whereby the uncertainty is instead subtracted. If accurate, its difference will yield the same value as the first equation.
Only 69Ga+ was detected in N-AL6, suggesting its Pt and carbon coating cap was sufficiently removed during sample preparation. Consequently, contaminants had no impact on data-processing procedures or isotopic or geochemical calculations.
3. Results
3.1. Oxygen and Silicon Isotopic Compositions
Presolar grain N-AL6 is a 400 × 580 nm silicate grain within ALH 77307 that has a triangular sectional profile with round corners. It has a 17O/16O isotopic ratio 3.2× solar values, consistent with classification as a Group 1 presolar grain (Figure 1). The 17O-rich isotopic composition is distinct from its surrounding matrix, highlighting a presolar origin and formation external to the parent body (Table 1; Figure 1).

Figure 1. Presolar oxygen and silicon isotopic compositions of N-AL6 determined using NanoSIMS, shown against O and Si isotopic values of presolar grains measured in previous studies and extracted from the Washington University Presolar Grain Database (Hynes & Gyngard 2009). (A) O isotope plot. The solid black lines correspond to the average O isotopic ratios of solar system materials. "SN" refers to ungrouped grains of SN origin. Presolar grain groups are labeled (Nittler et al. 1997). (B) Si isotope plot. Values are represented as deviation away from solar (permil ‰). Values were plotted against the mainstream line of SiC, calculated from 4000 SiC formed within a 2 M⊙ star (Nittler et al. 1997). The mainstream line is consistent with the effects of galactic chemical evolution and stellar composition.
Download figure:
Standard image High-resolution imageTable 1. Morphological, Isotopic, and Geochemical Signatures of N-AL6
| Meteorite | Grain No. | Grain Size (nm) | Morphology | Group | Phase | Geochemistry |
|---|---|---|---|---|---|---|
| ALH 77307 | N-AL6 | 400 × 580 | Obtuse Triangle | 1 | Silicate | Forsterite-like |
| Isotopic Compositions | ||||||
| NanoSIMS | Atom Probe | |||||
| 17O/16O ± 1σ (×10−4) | 18O/16O ± 1σ (×10−3) | δ29Si/28Si ± 1σ | δ30Si/28Si ± 1σ | δ25Mg/24Mg ± 1σ | δ26Mg/24Mg ± 1σ | |
| 11.78 ± 0.24 | 1.49 ± 0.03 | 5.09 ± 29.05 | −8.81 ± 35.67 | 3025.1 ± 38.3 | 746 ± 26 | |
| Mixing Calculation Compositions (95% SN) a | ||||||
| 7.9 | 12.1 | 0.00 | 0.00 | 3020.14 | 717.22 | |
| Elemental Abundances | ||||||
| Grain No. | Si (at%) | Mg (at%) | O (at%) | Mg/Si | Mg # | |
| N-AL6 | 13.85 ± 0.15 | 38.57 ± 0.15 | 47.58 ± 0.19 | 2.7 ± 0.03 | 100 | |
| N-AL6 (corrected) | 13.85 ± 0.15 | 29 ± 0.15 | 57.15 ± 0.19 | 2.1 ± 0.02 | 100 | |
Notes. Summary of the primary petrographic features of N-AL6. Delta ratios were calculated using iR/hS = (iR/hSsample/iR/hSstandard) − 1) × 1000, where standard is the solar ratio in APT and the average matrix ratio of the isotopically normal (solar) grains within the presolar ROI in NanoSIMS ion maps. ΔN-AL6 Mg isotopic ratios are more consistent with Group 1 grains recently proposed to form within explosive hydrogen-burning stars ending as electron capture. They exhibit mass ranges of 8–10 M⊙ (see Leitner & Hoppe 2019 and references therein). Mg # = Mg/(Mg + Fe) errors are calculated based on counting statistics. Modeled compositions were achieved using standard mixing calculations with ∼11% from the outer part of the O/nova and 89% from the outer shell of the SN.
a SN ejecta were mixed with the pre-SN wind from the 15 M⊙ SN model from Pignatari et al. (2015; e.g., 95% SN material, 5% wind material). Mixing calculations were performed in Excel using standard practices (Nittler et al. 2008; Hoppe et al. 2021).Download table as: ASCIITypeset image
The Si isotopic compositions plot within the mainstream correlation line and main presolar cluster (Table 1; Figure 1). Comparisons of Si isotopes in NanoSIMS and APT show similar values within analytical uncertainties, with both exhibiting large errors which are attributed to matrix-dilution effects and counting statistics from the low abundance of less common isotopes 29Si and 30Si and small analytical volume, respectively (Figure 1). Nevertheless, NanoSIMS-measured values are used for further comparisons.
3.2. Mineralogy: Atom Probe Tomography
The APT mass spectra from N-AL6 showed peaks 24Mg, 25Mg, 26Mg, 28Si, 29Si, and 30Si at (+) and (2+) charge states, Al27O16, and a series of Mg and Si oxide complexes, e.g., MgO, SiO, and SiO2 (Table 1; Figure 2). Mg, O, Al, and Si ions were homogeneously distributed throughout both the 3D tomographic reconstruction and along the 1D concentration profile of the presolar grain (Figure 2).
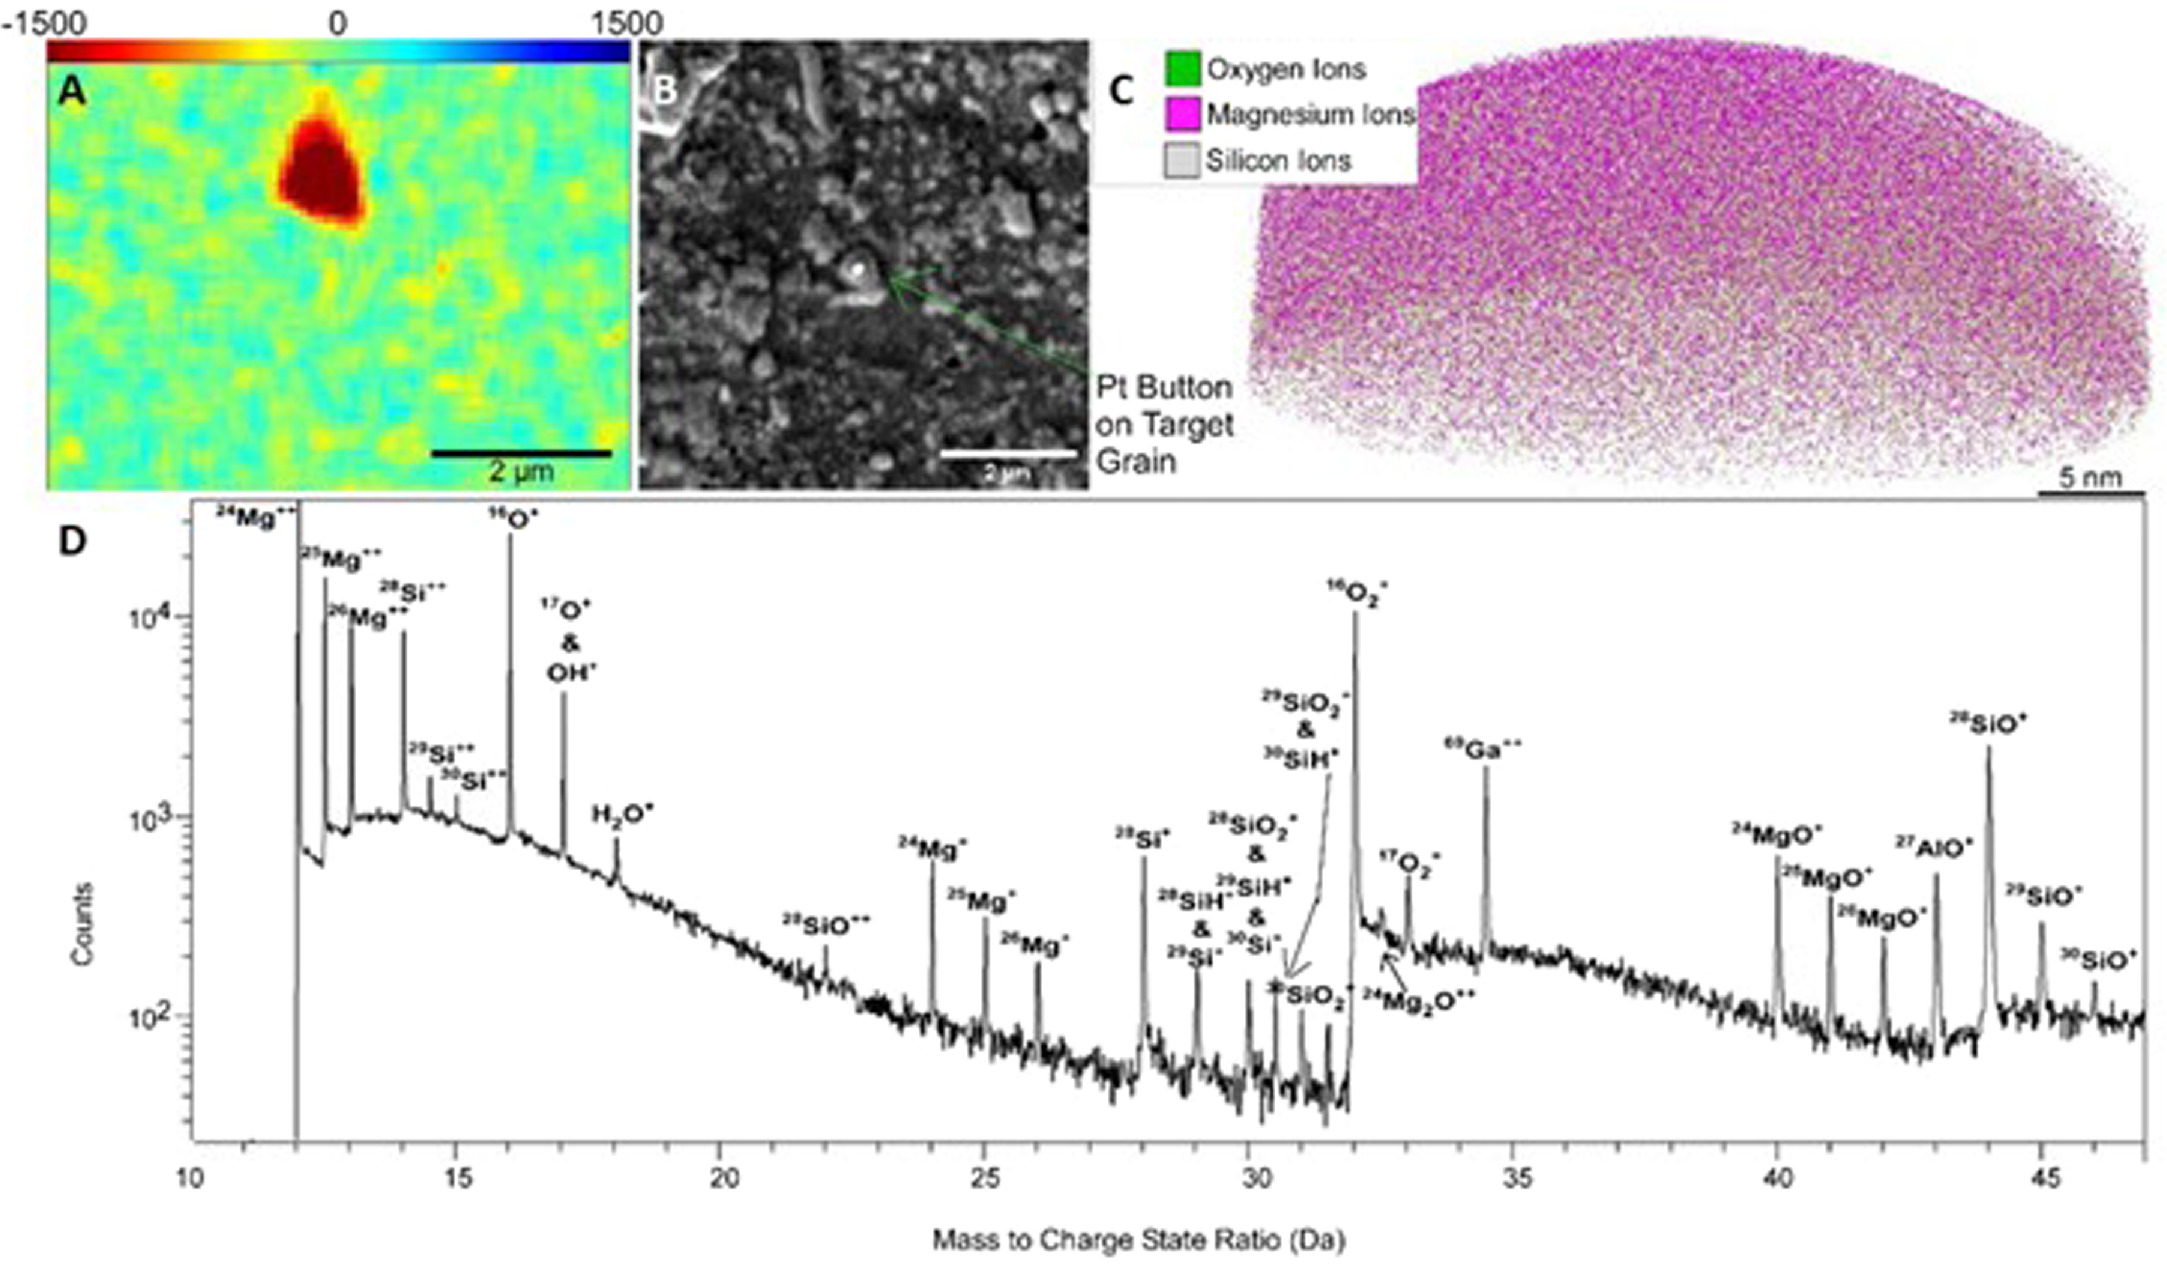
Figure 2. Geochemistry of N-AL6, a forsterite-like (δ17O enriched) presolar grain. (A) 17O NanoSIMS delta ratio map, (B) SEM secondary-electron image, (C) APT ionic reconstruction of magnesium and oxygen ions, (D) labeled APT spectra.
Download figure:
Standard image High-resolution imageThe APT data yield an elemental composition of Si (13.85 ± 0.15 at%), Mg (38.57 ± 0.15 at%), O (47.58 ± 0.19 at%), and Al (0.69 ± 0.04 at%). Comparisons of the APT-measured composition of N-AL6 with that of a terrestrial forsterite sample from the island of Holsnøy (SW Norway) analyzed under similar acquisition parameters, voltage ranges, and conditions (Tacchetto et al. 2021) demonstrates a similar stochiometric bias in the terrestrial olivine APT data, i.e., Si (14.94 at%), Mg (29.05 at%), Fe (9.04 at%), and O (46.98 at%). The quantification of oxygen anions via APT is known to be problematic due to the inability of APT to discriminate between the O+ and O2 ++ at a mass/charge of 16 Da (Reddy et al. 2020). Therefore, the APT results from N-AL6 are consistent with the analysis of stoichiometrically normal forsterite (Mg2SiO4). The theoretical value correcting for the over- and underestimation was calculated using total ion counts and correcting Mg and O for 10 at% each (Table 1).
3.3. Magnesium Isotopic Compositions: Atom Probe Tomography
The Mg isotopic compositions of N-AL6 calculated using APT data are δ25Mg = 3025‰ ± 38‰ (2σ) and δ26Mg = 746‰ ± 26‰ (2σ) (Table 1; Figure 3), which represents the highest value of δ25Mg ever measured in a silicate grain (Figure 3). A comparison of δ25Mg isotopic calculations from peaks Mg++ (peak series represents ∼90% of Mg ions within spectra) and Mg+ (peak series with second highest number of counts) yielded δ25Mg = 3025‰ ± 38‰ (Mg++) and δ25Mg = 3043‰ ± 383.9‰ (Mg+). The values derived from the Mg++ and Mg+ peak series are similar within analytical uncertainties and demonstrate internal consistency of APT isotope results. To demonstrate the accuracy of these results, we calculated the Mg isotopic compositions of two terrestrial olivine grains from Holsnøy (SW Norway) measured under similar acquisition parameters (Tacchetto et al. 2021) to N-AL6 and similar distributions of ion counts within each Mg peak. Using the same method, isotopic compositions were calculated as δ25Mg = −20.0‰ ± 11.9‰ and δ26Mg = 14.5‰ ± 11.4‰ for grain 3521, and δ25Mg = −28.9‰ ±20.1‰ and δ26Mg = 17.9‰ ± 17.4‰ for grain 3442 (Tacchetto et al. 2021). A minor overestimation of δ25Mg background correction during calculations resulted in slightly underestimated δ25Mg values in both terrestrial grains and N-AL6, with terrestrial grains likely preserving isotopic signatures of δ25Mg = 0‰. Results demonstrate that the measured anomalies in N-AL6 are accurate.
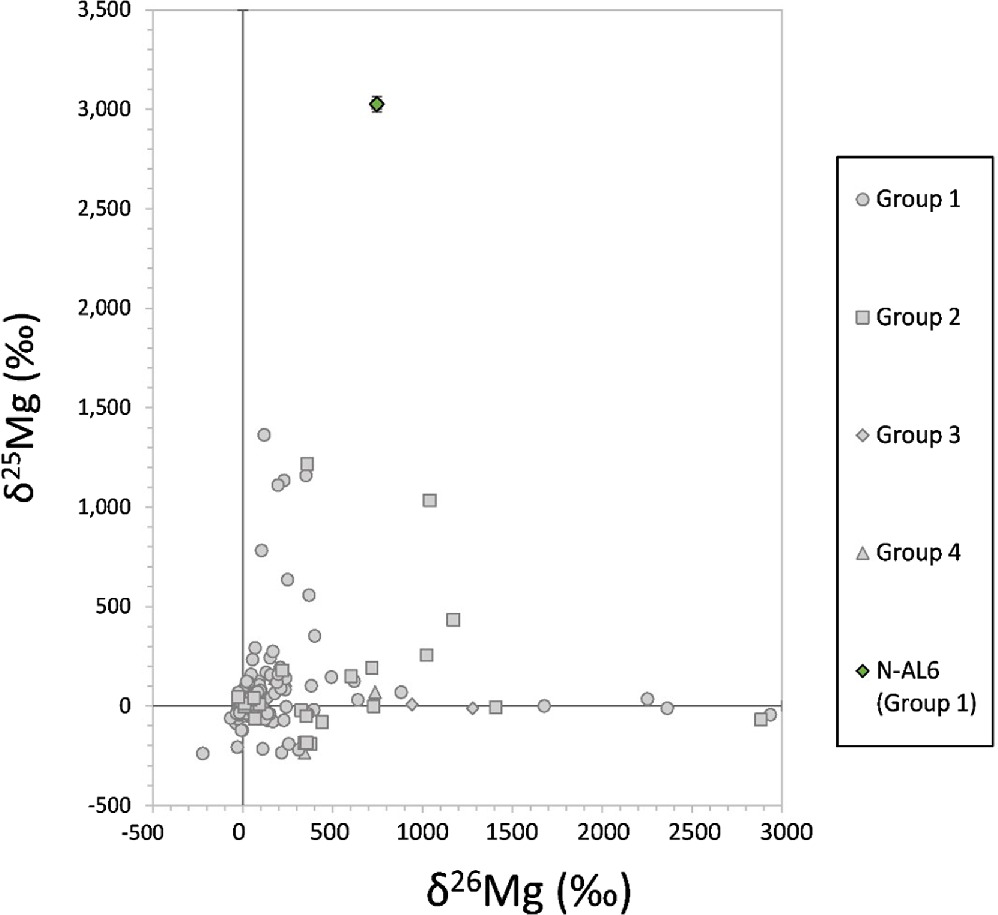
Figure 3. Magnesium isotopic ratios of N-AL6 compared with presolar silicates from other studies measured using NanoSIMS (Hynes & Gyngard 2009; Leitner & Hoppe 2019; Hoppe et al. 2021; Nevill et al. 2023). All ratios are deviations permil from solar (‰).
Download figure:
Standard image High-resolution image4. Discussion
4.1. The Significance of 25Mg-rich Presolar Grains
Presolar grain N-AL6 is classified as a Group 1 presolar silicate due to its O isotopic signature and has an extreme δ25Mg anomaly (δ25Mg = 3025‰ ± 38‰ and δ26Mg = 746‰ ± 26‰). Group 1 grains are characteristically 17O-rich with solar to slightly depleted 18O compositions (Nittler et al. 2008). Until recently, these Group 1 presolar grains were considered to have exclusively formed within the main-sequence RGB or low-mass AGB stars of close-to-solar metallicity (Boothroyd et al. 1994; Nittler et al. 2008). However, recent Mg isotopic studies using the Hyperion II RF plasma O primary ion source and 3D modeling of stellar atmospheres indicate that Group 1 and 2 presolar grains with δ25Mg >600‰ originate from Type II SN of solar metallicity which undergo hydrogen ingestion into the helium (He) shell prior to the explosion (Leitner & Hoppe 2019; Hoppe et al. 2021). This is because comparisons between isotopic compositions of presolar grains and theoretical modeling found that 25Mg excesses were challenging to reconcile with AGB nucleosynthesis irrespective of their metallicities. Nova models may account for some of the δ25Mg-rich presolar grains considering they predict 17O-rich, slightly 18O-poor, 25Mg-rich, and comparably low 26Mg isotopic compositions. However, current nova models reveal serious discrepancies between measured grains and expected ratios (i.e., oxygen was 10× to 70× measured 17O/16O ratios) and dust production was inefficient to account for the percentage of grains attributed to this origin (Hoppe et al. 2021). This discrepancy may be due to the limited coverage of the range of conditions that could occur within these stellar environments (Iliadis et al. 2018), an issue which may be addressed in future 3D modeling of nova atmospheres to explore a wider range of environmental parameters, e.g., pressure and temperature, and achieve more realistic conditions, e.g., changes in mixing length which alters as a function of stellar surface gravity and temperature.
4.2. Linking Presolar Grain N-AL6 to an Explosive H-burning Type II Supernova
Recently, the Mg, Si, and O isotopic compositions of 14 presolar grains were compared with theoretical modeling and astronomical observations of AGB, nova, and H-ingestion CCSN stellar atmospheres, to substantiate the proposed H-ingestion CCSN origin for 25Mg-rich Group 1 and 2 grains (Leitner & Hoppe 2019; Hoppe et al. 2021). The latter was conducted by artificially increasing temperature and density to mimic the effects of explosive H-burning within a 15 M⊙ SN model, which assumed 1.2% H ingestion into the He shell before the explosion (Pignatari et al. 2015; Leitner & Hoppe 2019; Hoppe et al. 2021). This same model was recently used to show that some presolar silicon carbide (SiC) grains originated from a H-ingestion CCSN rather than a nova (Liu et al. 2016).
Within CCSNe, once the core of the star reaches a critical mass and gravitational collapse occurs, a nascent neutron star is formed. During gravitational collapse, the infalling mass supersonically crashes onto the neutron star, launching a shock wave which passes through the outer layers of the star and ejects them. These shock waves cause instabilities among the layers of the stellar system, resulting in large-scale mixing within rapid timeframes (Harris & Lambert 1984). As a result, each zone alters in composition, becoming chemically distinct. These layers are therefore named according to their most abundant element and characteristics (Figure 4). As the shock wave passes through the layers they heat and compress, then expand and cool. Explosive H-burning occurs in the He layers as the material responds to the heating and compression resulting from the shock passage, leaving characteristic isotopic and elemental signatures not found within traditional CCSNe, e.g., an O/nova zone with nucleosynthesis characteristics of nova environments including strong 25Mg enrichments (Figure 4). The He shell is comprised of a C/Si zone, an O/nova zone (mass range 6.82–7.16 M⊙), and He/C zones (mass range 7.16–9.23 M⊙). For grains with δ25Mg exceeding values of 1000‰, mixing calculations required zone-selective mixing from the inner C/Si zone (mass range 6.8145–6.8247 M⊙), and the outer region of the O/nova zone (mass range 7.05–7.2 M⊙).
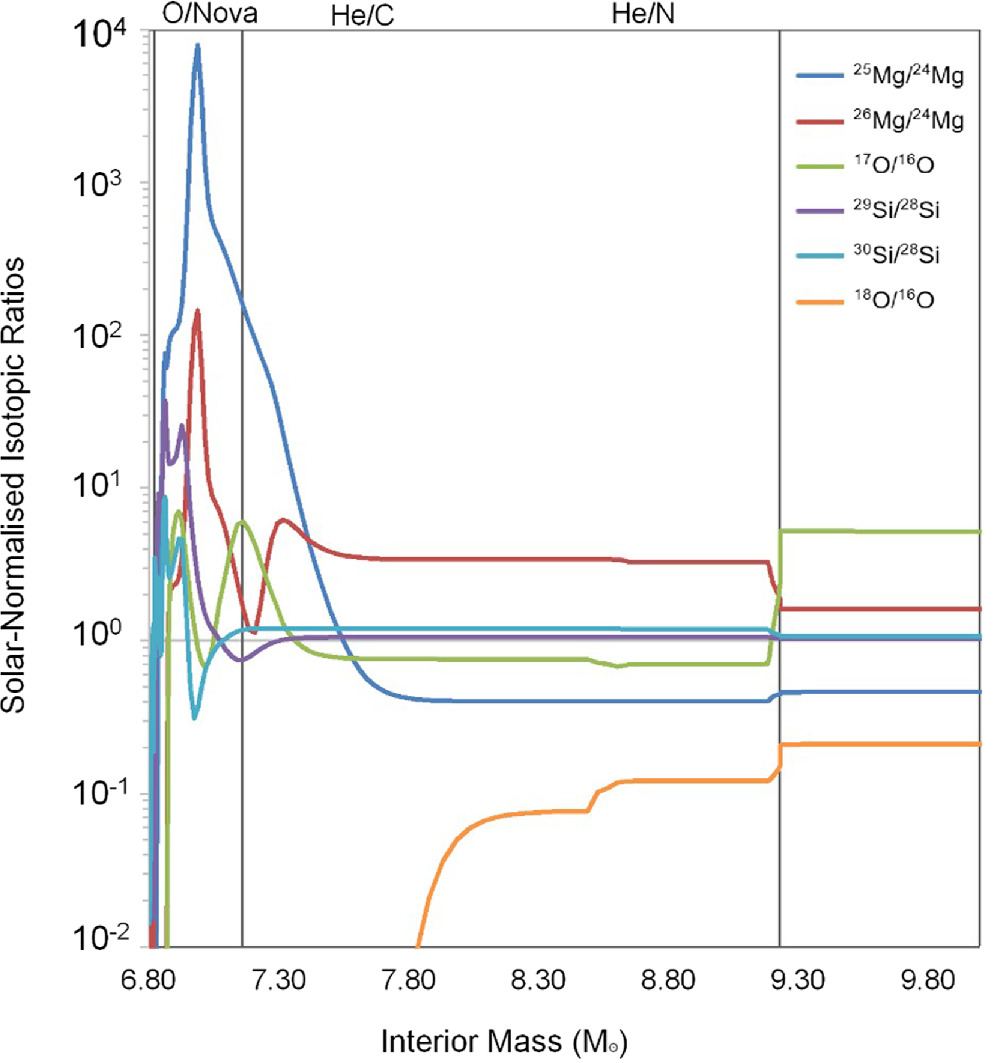
Figure 4. Isotopic fractionation of O, Si, Mg, and O normalized to solar values within a 25 M⊙ SN. Each SN layer is classified based on the interior structure of a 25 M⊙ SN (model from Pignatari et al. 2015). This model considers H ingestion into the He shell, with explosive H burning occurring within the He shell leading to a zone with isotopes characteristic of nova nucleosynthesis, e.g., a spike in 25Mg.
Download figure:
Standard image High-resolution imageAs measured Mg and Si isotopic fractionation were in good agreement with H-burning CCSN models but O isotopic fractionation in moderate agreement (Boothroyd et al. 1994; Leitner & Hoppe 2019; Hoppe et al. 2021), Leitner & Hoppe (2019) and Hoppe et al. (2021) took two approaches regarding O isotopes for their 14 presolar silicates. The first used O isotopes from a 15 M⊙ SN, and the second enhanced 17O isotopes within a pre-SN wind taken from infrared observations of pre-SN supergiant Betelgeuse, as this star had similar He shell physics assumptions as a model, accounting for the expected difference in solar metallicity (Harris & Lambert 1984; Pignatari et al. 2015; Leitner & Hoppe 2019; Hoppe et al. 2021). Modeling predictions in Hoppe et al. (2021) were best matched when SN envelopes were mixed with outer SN zones and matter ejected during the pre-SN phase. Thus, isotopic measurements of δ25Mg within studied presolar grains were modeled with mixtures of 63%–96% pre-SN wind material (Pignatari et al. 2016; Leitner & Hoppe 2019; Hoppe et al. 2021). Considering the limited parameters of SN models explored and assumptions used in modeling, it has been argued results are favorable with a H-burning CCSN stellar environment (Hoppe et al. 2021).
Modeling indicates H-burning CCSNe produce large 25Mg excesses due to the 24Mg(p, γ)25Al(β+)25Mg reaction, with 26Mg enriched to a lesser degree in contrast to standard CCSN models (Leitner & Hoppe 2019; Hoppe et al. 2021), consistent with Mg isotopic measurements in N-AL6 (Table 1; Figure 3). N-AL6 Mg, O, and Si isotopic values are comparable to initial modeling discussions (Leitner & Hoppe 2019; Hoppe et al. 2021). For example, N-AL6 O and Si N-AL6 O and Si isotopic values were 17O/16O = 11.78 ± 0.24, 18O/16O = 1.49 ± 0.03, δ29Si = 5.09 ± 29.05, and δ30Si = −8.81 ± 35.67, falling well within the range of Group 1 25Mg-rich grains measured within Leitner & Hoppe (2019) and Hoppe et al. (2021).
In calculations without zone-selective mixing, where 25Mg isotopes in N-AL6 could be matched, Si isotopes could not. When using the zone-selective mixing taken by Leitner & Hoppe (2019), 25Mg 26Mg, 29Si, and 30Si could all be well matched. In comparison to Hoppe et al. (2021) and Leitner & Hoppe (2019), N-AL6 was modeled with a 5% pre-SN wind mixture. For the pre-SN wind, we used the O isotopic ratios in a 15 M⊙ star predicted by Pignatari et al. (2016) and O isotopic values measured in Betelgeuse (Harris & Lambert 1984). Within the bounds of the 15 M⊙ star, the 17O/16O ratios were too low, deviating by ∼60%, and the 18O/16O ratios deviated by a factor of 10, as seen in Hoppe et al. (2021). When using Betelgeuse isotopic compositions, the 17O/16O ratios were within ∼30% and the 18O/16O ratios were off by a factor of 8. The O isotopic values showed better matches with 17O/16O ratios but poorer matches to 18O/16O ratios compared with Hoppe et al. (2021). As O isotopic compositions were a closer match to modeling of a H-burning CCSN than a nova, Hoppe et al. (2021) proposed that the deviations could be attributed to the limited number of tested metallicities and lack of 3D modeling of CCSNe, which is required to account for peak density, temperature, and hydrodynamic simulations of H ingestion (Pignatari et al. 2015). The results within this study are therefore in good agreement with a H-burning CCSN. Together, these calculations suggest CCSNe were significant suppliers of dust to the molecular cloud from which our solar system formed. However, we argue that novae should not be ruled out as a potential stellar origin for 25Mg-rich presolar grains given the extreme 25Mg values within nova atmospheres and lack of extensive modeling of nova atmospheres. Based on discussions of H-burning CCSNe and modeling calculations, it is clear that the isotopic signatures in N-AL6 challenge current stellar models, implying there may be processes occurring within stellar environments which we do not yet fully understand.
4.3. Ejection of Material and Condensation in an Explosive Hydrogen-burning Type II Supernova
N-AL6 was inferred to be a stoichiometric forsterite based on the similarity of APT results from a stochiometric terrestrial olivine grain measured under similar analytical conditions. The stoichiometry of N-AL6 implies that it formed during thermodynamic equilibrium condensation within a circumstellar environment. Thermodynamic equilibrium calculations of SN, nova, and AGB/RGB stellar systems have each identified forsterite as a primary condensing phase and the first Mg-rich silicate to condense within stellar atmospheres under equilibrium conditions (Lodders 2003; José et al. 2004; Fedkin et al. 2010; Pignatari et al. 2015; Agúndez et al. 2020). This supports the formation of N-AL6 within an H-burning CCSN atmosphere. The triangular sectional profile and round corners of N-AL6 (Table 1) indicate a degree of post-processing during ejection or migration throughout the ISM from processes that did not affect the overall chemistry, e.g., if ionizing processes in the ISM were sufficient to chemically alter N-AL6 we would expect depletion of Si relative to Mg, which was not observed (Jones 2000; Lodders 2003; Takigawa et al. 2014). Further constraints on N-AL6 evolution requires studying its crystallinity (Zinner 2014).
The minor amounts of aluminum detected within N-AL6 could be explained by direct condensation in the stellar environment. Comparative studies of condensation in AGB/RGB, novae, and CCSNe show similar relationships between condensation and environmental conditions. For example, during condensation of presolar grains, compatible elements are incorporated in minor and trace abundances at the tail end of the range of pressure and temperature conditions each phase condenses at, and increasing pressure reduces the condensing temperature range for each phase (Lodders 2003). Environmental changes within circumstellar envelopes can affect the timing and pressure/temperature ranges of each phase, which influences the abundances of each element incorporated into the lattice at the time of condensation and the compatibility of elements within a condensing phase. Pressure and temperature variations have minimal influence on gas composition, which also plays a role in the uptake of minor and trace elements. Consequently, pressure and temperature are unlikely to have solely contributed to a lack of additional minor and trace elements in N-AL6 regardless of whether it condensed under equilibrium or disequilibrium conditions.
We propose the following. (1) The collapse of the CCSN could have been so rapid that mixing and homogenization could not be achieved on smaller scales, resulting in pockets of different gas compositions which could occur at localized scales within the condensing envelope. (2) N-AL6 could have condensed just before collapse of the SN, where mixing of SN layers is minimal, consistent with mixing calculations and measured elemental abundances. Because Al is also the first condensate, this element would likely have been present within the condensing region in both scenarios when forsterite, the first Mg-rich silicate, formed, accounting for the elemental composition of N-AL6. (3) The elemental composition of N-AL6 could also be explained if the gas was enriched in Mg, Si, and O as well as additional heavy elements that are incompatible within a forsterite lattice under the pressure and temperature conditions within the circumstellar envelope at the time of condensation. A more extensive study of presolar nucleosynthesis and condensing phases from H-burning CCSNe and thermodynamic modeling of pressure conditions and equilibrium condensation is required to further refine geochemical relationships within H-burning CCSN environments.
The isotopic and elemental compositions of N-AL6 represent new constraints on mixing and processing in stellar atmospheres. Particles from external stellar systems such as this are among the original building blocks of our solar system, providing important records of its evolution. Ultimately, the study of all isotopic and chemical signatures of presolar silicates, at nanoscale spatial resolution, may therefore help reconcile the differences between (i) thermodynamic modeling and measured isotopic and chemical compositions, and (ii) the physical and chemical processes responsible for reproducing the signatures measured at micrometric to atomic scales in presolar grains from processes and environmental conditions in our solar system and external stellar systems.
Acknowledgments
We are grateful to M. Bose, M. Pignatari, and P. Hoppe for their advice and helpful discussions. We give thanks to the anonymous reviewer for their helpful and insightful comments. We thank S. Messenger for the use of the custom JSC software for processing NanoSIMS data. Additional thanks to all the parties who contributed research funds or research facilities. These include the RTP government training program; Curtin University; the John de Laeter Centre's (JdLC) Geoscience Atom Probe Facility; the JDLC's Microscopy and Microanalysis Facility whose instrumentation is partially funded by the University, State and Commonwealth Governments; and the Center for Microscopic, Characterisation and Analysis (CMCA), UWA NanoSIMS facility. Lunar and Planetary Institute (LPI) Contribution No. 3045. LPI is operated by the Universities Space Research Association (USRA).
Data and Materials Availability: All data from this study are available in the main text or the supplementary materials. A Dryad data repository is included with processed data used to create main text and supplementary figures and isotopic calculations in APT. The repository is available at doi:10.5061/dryad.j6q573nm7. Data from terrestrial grains is available in Tacchetto et al. (2021).
Appendix
A.1. Constraining the Presence of Aluminum in N-AL6
Peak 43 m/z is consistent with 27Al16O+. However, there were no other Al peaks present. If all the Al ions were bonded to O within the presolar grain before acquisition and the energy within the APT was not significant enough to break the Al-O bonds, all ions would accumulate at the single oxide charge state, peak 43 m/z, explaining the lack of additional peaks. Alternatively, peak 27 m/z could be missing if the Al concentration was low and the field too high (giving a high Al++/Al+ ratio). Given the proportional heights of each isotope within the other series of Mg peaks, peak 43 m/z was proportionally inconsistent with 26MgOH+, and was therefore assigned 27Al16O+.
A.2. Supplementary Figures and Table for Supporting Methodology and Technical Approach
The following figures and table support the outcomes of applied methods within this study. Figure A1 shows the prepared needle of presolar grain N-AL6, using site-specific focus ion beam. The BSE image of the APT needle is accompanied by the atomic reconstruction acquired during the APT run. Figures A2 and A3 show supporting information for the custom method applied within this study which enables us to constrain the isotopic compositions of phases in APT quantitatively. Figure A2 focuses on the peak quantification and background approach used and Figure A3 focuses on demonstrating isotopic consistency across different ranges within the N-AL6 APT data set. Table A1 details the experimental conditions, acquisition parameters, and reconstruction parameters used to re-create the N-AL6 APT reconstruction.
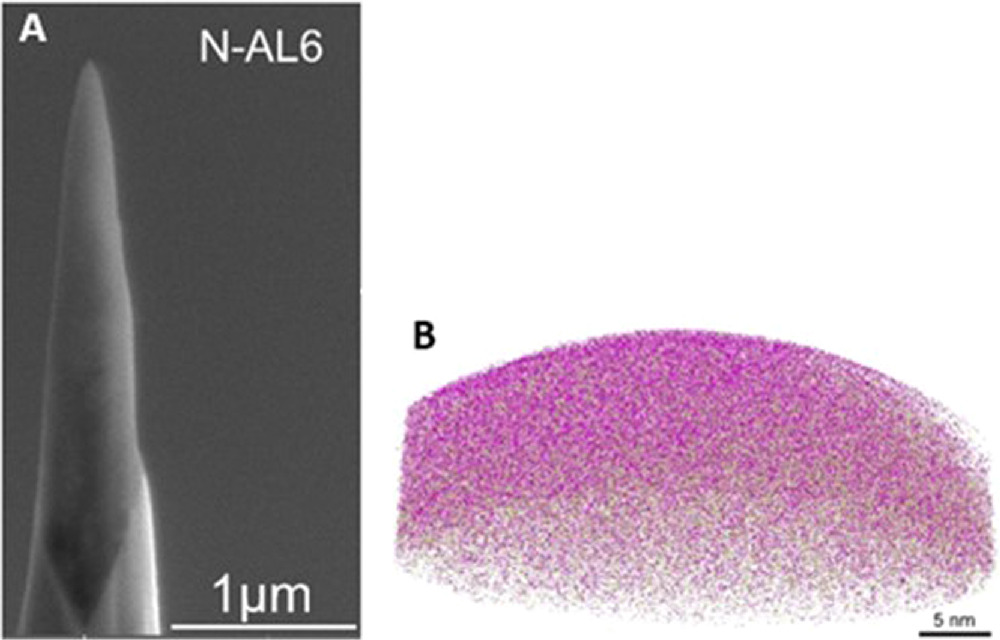
Figure A1. An atom probe tomography needle and its corresponding 3D atomic reconstruction of all atoms within N-AL6. (A) Atom probe tomography needle of N-AL6 prepared using focus ion beam; (B) the full APT needle reconstruction. A more detailed description of the APT reconstruction is given in Figure 2.
Download figure:
Standard image High-resolution image
Figure A2. Peak quantification and background approach. Corrected time-of-flight histogram of single-hit detection events from N-AL6. Peak range limits (red) and background range limits (blue) are indicated for each of the two isotopic Mg++ peaks in this interval. In the analysis method described here, the position and width of the ranges can be adjusted by the user, provided they represent equivalent locations relative to their respective peaks.
Download figure:
Standard image High-resolution image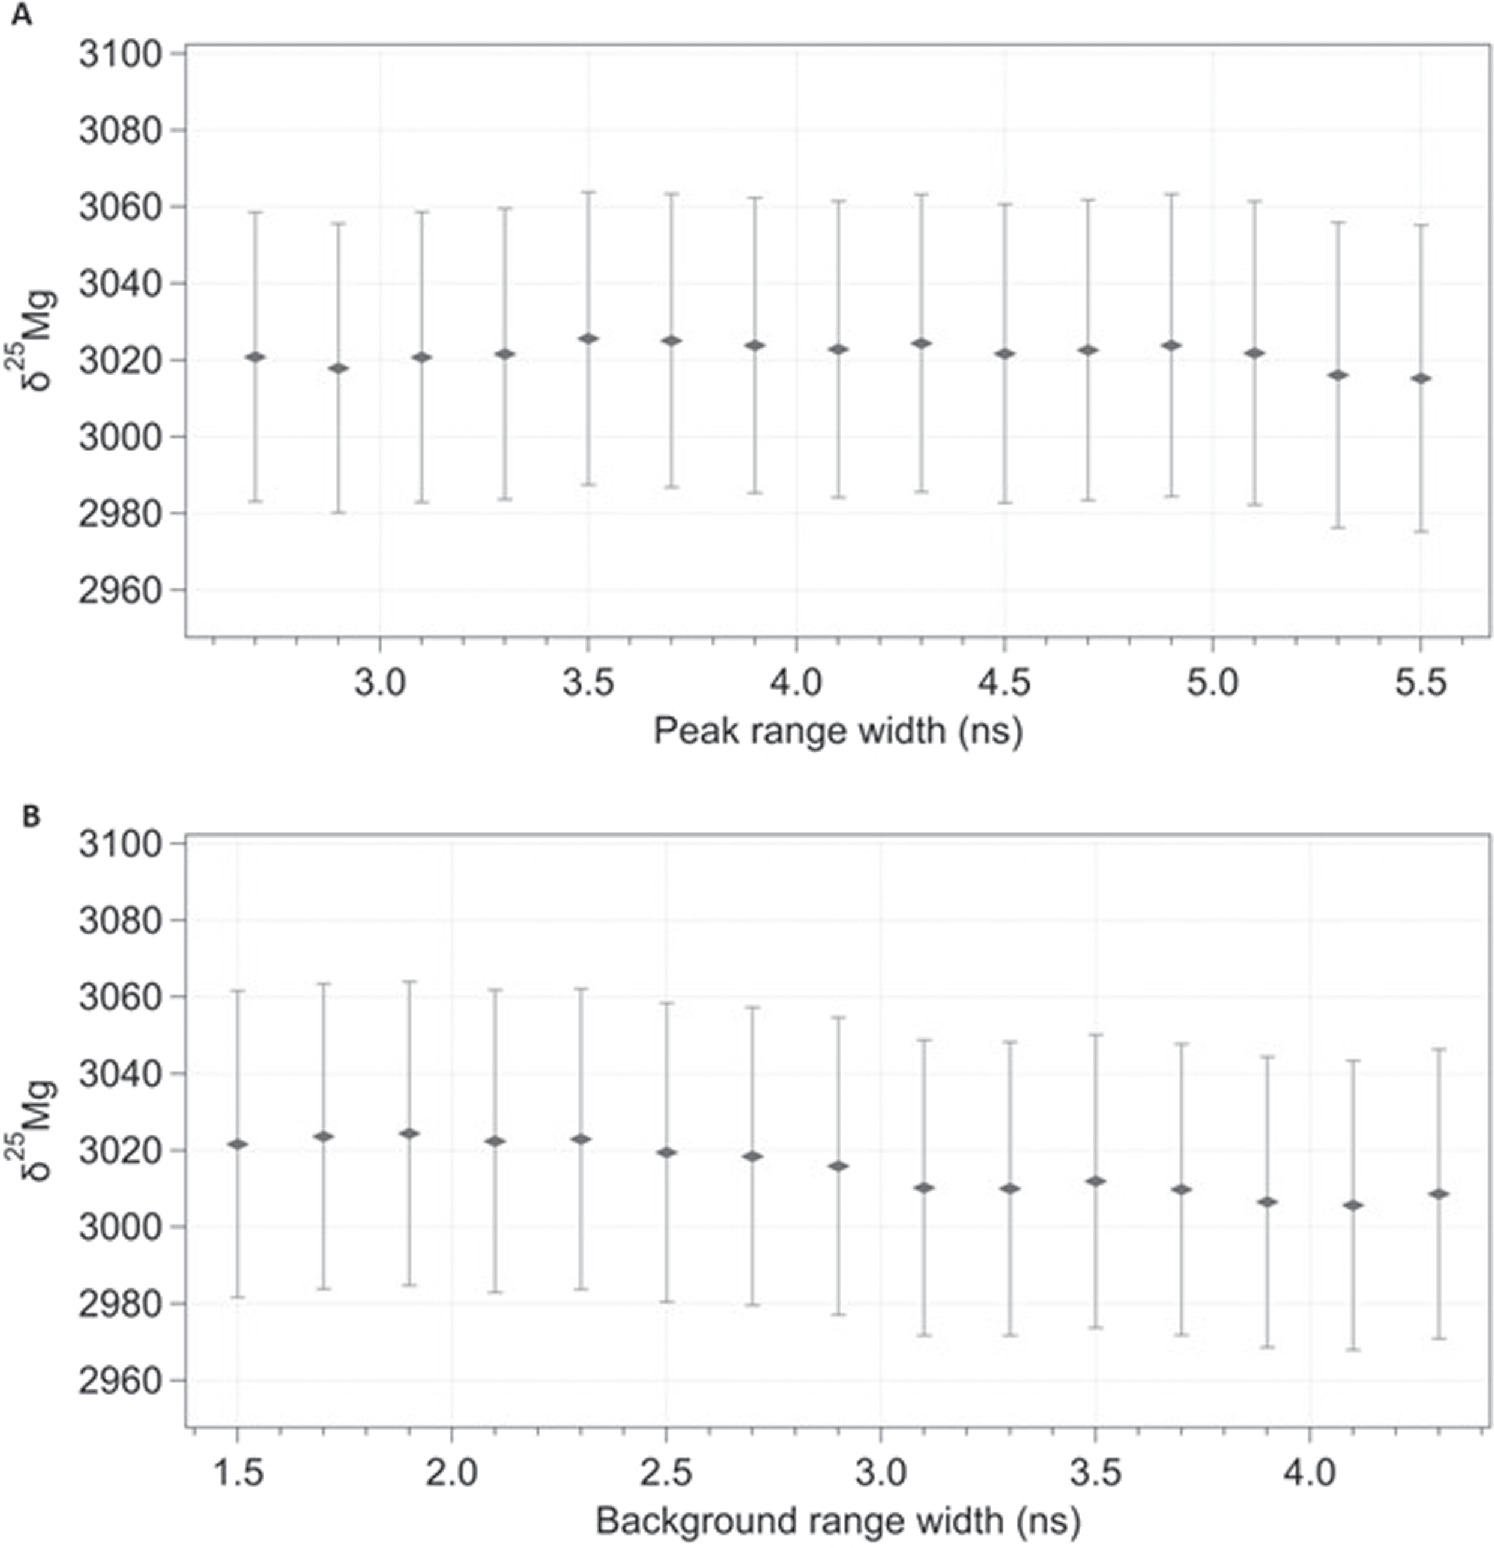
Figure A3. A measure of the consistency of isotopic calculations across different ranges. Examples are of δ25Mg values calculated from the 24Mg++ and 25Mg++ peaks in Figure A2. Uncertainties are 1σ. (A) Variation in measured δ25Mg with increasing peak width, with background range width fixed at 3 ns. The results reported in this work correspond to a peak range width of 3.7 ns. (B) Variation in δ25Mg as each background range is extended by moving the left-side limit. The peak range width was fixed at 5.5 ns, which spanned more than the full peak width visible above the background.
Download figure:
Standard image High-resolution image
Table A1. LEAP Running Parameters: N-AL6
| Instrumental Model | LEAP 4000X HR |
|---|---|
| Laser wavelength (nm) | 355 |
| Laser pulse energy (pJ) | 350 |
| Pulse frequency (kHz) | 125 |
| Evaporation control/detection rate (ions/pulse) | 0.006 |
| Nominal flight path (mm) | 382 |
| Set point temperature (K) | 70 |
| Sample temperature (K) | 80.5 |
| Chamber pressure (Torr) | 5.45 × 10⁻¹¹ |
| LAS root version | 15.41.342 l |
| CAMECAROOT version | 18.46.492 |
| Analysis software | AP Suite 6.0 |
| Run length (hr:minute) | 0:57 |
| Total ions: | 892,307 |
| Single (%) | 71.06 |
| Multiple (%) | 28.10 |
| Partial (%) | 0.82 |
| Reconstructed ions: | 839,807 |
| Ranged (%) | 36 |
| Unranged (%) | 64 |
| Volt./bowl corr. peak (Da) | 12, 13 & 16 |
| ΔM = full-width at half maximum | 918.78 |
| ΔM10 = full-width at tenth maximum | 415.24 |
| Time-independent background (ppm ns−1) | 11.463 |
| Final specimen state | Fractured |
| Pre-/post-analysis imaging | SEM/n.a. |
| Field factor (k) | 3.3 |
| Image compression factor | 1.65 |
| Assumed E-field (V nm−1) | 33 |
| Detector efficiency (%) | 36 |
| Avg. atomic volume (nm3) | 0.0232 |
| Vinitial; Vfinal (V) | 2267; 4280 |
Notes. This table summarizes all of the experimental conditions, acquisition parameters, and data-reconstruction parameters of the N-AL6 APT run.
Download table as: ASCIITypeset image