


Abstract
Like 1 Hz waves occurring in the upstream of various celestial bodies in the solar system, 1 Hz narrowband whistler-mode waves are often observed around the Moon. However, wave properties have not been thoroughly investigated, which makes it difficult to proclaim the generation mechanism of the waves. Using 5.5 yr wave data from ARTEMIS, we perform a detailed investigation of 1 Hz waves in the near-lunar space. The amplitude of lunar 1 Hz waves is generally 0.05–0.1 nT. In the geocentric solar ecliptic coordinates, the waves show no significant regional differentiation pattern but show an absence inside the magnetosphere. Correspondingly, in the selenocentric solar ecliptic coordinates, the waves can occur extensively at ∼1.1–12 RL, while few events are observed in the lunar wake due to a lack of interaction with the solar wind. Furthermore, the wave distributions exhibit modest day–night and dawn–dusk asymmetries but less apparent north–south asymmetry. Compared with the nightside, more intense waves with lower peak wave frequency are present on the dayside. The preferential distribution of 1 Hz waves exhibits a moderate correlation with strong magnetic anomalies. The waves propagate primarily at wave normal angles <60° with an ellipticity of [−0.8, −0.3]. For stronger wave amplitudes and lower latitudes, 1 Hz waves generally have smaller wave normal angles and become more left-hand circularly polarized. Owing to the unique interaction between the Moon and solar wind, our statistical results might provide new insights into the generation mechanism(s) of 1 Hz waves in planetary plasma environments and promote the understanding of lunar plasma dynamics.
Export citation and abstract BibTeX RIS

Original content from this work may be used under the terms of the Creative Commons Attribution 4.0 licence. Any further distribution of this work must maintain attribution to the author(s) and the title of the work, journal citation and DOI.
1. Introduction
One hertz waves are whistler-mode waves observed near 1 Hz in the spacecraft frame with narrowband spectra. The narrowband spectra structure is possibly caused by the upper cutoff limited by upstream propagating in the solar wind and the upward slope resulting from the Doppler-shift of power-law spectra (Russell 2007). It is also reported by Tsugawa et al. (2014) that narrowband spectra can be formed by group-standing for 1 Hz waves near the Moon.
One hertz waves have been observed extensively in the upstream of many solar system bodies, including both planetary bodies with and without intrinsic magnetic fields, i.e., Earth, Venus, Mercury, Saturn, Mars, Jupiter, and Uranus and at interplanetary bow shocks (Heppner et al. 1967; Russell et al. 1971; Russell 2007; Fairfield 1974; Smith et al. 1989; Orlowski et al. 1990; Smith et al. 1991; Orlowski et al. 1992; Tsurutani et al. 1993; Brain et al. 2002; Ruhunusiri et al. 2018; Xiao et al. 2020). These waves are also called "narrowband whistlers" or "upstream whistler waves." In addition, the Moon, which has neither a global-scale magnetic field nor a dense atmosphere, provides a representative example of the interaction between the solar wind and an unmagnetized, airless body with flowing plasma (Schubert & Lichtenstein 1974). Near the Moon, 1 Hz waves have also been reported based on observations from various spacecraft, including Wind (Farrell et al. 1996), Lunar Prospector (hereafter referred to as "LP"; Lin et al. 1998), Geotail (Nakagawa et al. 2003), Kaguya (Tsugawa et al. 2011), etc. Although numerous studies have been performed for several decades, the generation of 1 Hz waves has not been clarified yet. In general, the major candidates in driving the excitation of 1 Hz waves near the Moon are ions reflected by lunar magnetic anomalies (Tsugawa et al. 2011; Harada et al. 2015) and solar wind interactions with lunar crustal magnetic fields (Halekas et al. 2006, 2008).
Halekas et al. (2006) statistically analyzed the lunar 1 Hz narrowband whistlers using about 1.5 yr of data from the LP, which orbits at ∼100 km altitude from the lunar surface. Their results showed that 1 Hz waves are observed at an occurrence rate of ∼6.6%, with the regions where the waves often occur outside the lunar wake in the solar wind. The 1 Hz waves exhibit typical propagating and polarizing features of whistler-mode waves. In addition, the waves are closely related to external magnetic enhancements and crustal magnetic fields. Tsugawa et al. (2011) updated the results using 1 yr of data from Kaguya, which orbits in the polar orbit of the Moon at an altitude of about 100 km. Their study revealed that the 1 Hz narrowband whistlers tend to occur at a high (40°–90°) solar zenith angle (SZA). The distributions of 1 Hz waves exhibit considerable north–south and dawn–dusk asymmetries. Furthermore, waves with strong amplitude are typically observed near the lunar crustal magnetic anomalies.
This study comprehensively investigates the spatial distributions and propagating properties of lunar 1 Hz waves. The outline of this paper is organized as follows. We briefly introduce the instruments and selection criteria in Section 2. The spatial distributions of wave amplitude and peak frequency of 1 Hz waves, the wave normal angle, and ellipticity distributions are shown in Section 3. In Section 4, we summarize our principal conclusions and discuss the results.
2. Instrumentation and Event Selection
The Acceleration, Reconnection, Turbulence, and Electrodynamics of the Moon's Interaction with the Sun (ARTEMIS; Angelopoulos 2011) mission consists of two identical satellites (P1 and P2) originating from the two outermost satellites (THB and THC) of the THEMIS mission (Angelopoulos 2008). The two repositioned ARTEMIS satellites travel around the Moon in near-ecliptic orbit with an inclination below ∼30°. Specifically, the orbits of ARTEMIS probes have a period of ∼26 hr with selenocentric distances ∼1.1–12 RL (geocentric distances of ∼55–65 RE), where RL and RE are the radii of the Moon and Earth, respectively. As a result, ARTEMIS can provide unprecedented comprehensive observations of various plasma environments, including distant magnetotail, the solar wind, lunar space, and planetary space.
In this study, we obtain the wave spectra by applying the fast Fourier transformation to the magnetic field data provided by the fluxgate magnetometer (FGM; Auster et al. 2008). The processed data have a frequency coverage of ∼0.016–8 Hz with a time resolution of 32 s. Using ARTEMIS P2 data from 2016 January 1 to 2021 July 1, we perform a detailed statistical study on the spatial distributions and wave properties of 1 Hz waves.
The criteria adopted to select the 1 Hz waves are as follows:
- 1.We search the peak of power spectral density in the frequency range of 0.6–4 Hz, where the lower limit of 0.6 Hz is adopted to avoid spin tones up to the second harmonics (Harada et al. 2015), and the upper limit of 4 Hz is adopted following previous studies (Halekas et al. 2006; Tsugawa et al. 2011).
- 2.The peak of power spectral density should be greater than 0.01 nT2 Hz−1 to avoid noise contamination.
- 3.To exclude the broadband magnetic turbulence, the drop level, defined as the ratio between the peak intensity and the minimum intensity in the frequency range of 0.6 Hz–fpeak, should be greater than 20 dB, where fpeak is the frequency of peak intensity (Tsugawa et al. 2011).
- 4.Since the waves are mainly left-handed polarized, we focus on wave events with ellipticity <0 for the accuracy of calculating wave amplitude.
For broadband magnetic turbulence at 0.1–10 Hz, the wave frequency overlaps with the investigated 1 Hz waves. Therefore, we use visual inspection as a supplement to further ensure the reliability of our established wave database. The wave events which exhibit ambiguous wave features are excluded from the database. Using the above criteria, we identify 3847 wave events over the 5.5 yr ARTEMIS data.
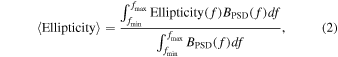
An example of 1 Hz waves identified by the above criteria is shown in Figure 1. Figures 1(a) and (b) show the energy spectra of all ions and nonsolar wind ions, respectively, which are provided by the electrostatic analyzer (ESA; McFadden et al. 2008). Ions with energy per charge 0.4 ESW /e < E/q < 4 ESW /e, where ESW /e is the solar wind proton energy per charge, and angles with respect to the solar wind velocity direction <45° are defined as solar wind ions. The rest are nonsolar wind ions (Harada et al. 2015). We can see from Figures 1(a) and (b) that during the observed time period, the fluxes of ions at tens of eV to about 1 keV experience moderate enhancement. As shown in Figure 1(c), 1 Hz waves are observed from ∼04:38 to 05:30 UT, with the wave power peaking at approximately 1.4 Hz. The bottom black curve and top black curve in Figure 1(c) indicate fcp and 2 fcp, respectively, where fcp is the proton cyclotron frequency. The corresponding wave normal angle (Figure 1(d)) and ellipticity (Figure 1(e)) exhibit that the waves propagate quasiparallelly with left-handed polarization. Figure 1(f) shows the power-weighted wave normal angle (red cross) and ellipticity (blue cross). For each wave event, the power-weighted wave normal angle (ellipticity) is defined as (Yu et al. 2017)
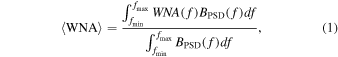
where the fmin and fmax are the minimum and maximum frequencies of 1 Hz waves, respectively.  ,
,  , and
, and  are the wave normal angle, ellipticity, and power spectral density as function of frequency at each event time, respectively.
Figure 1. An example of 1 Hz waves observed by ARTEMIS P2 on 2016 May 1. (a) Energy spectra of all ions and (b) of nonsolar wind ions. (c) Magnetic field power spectral density, with the bottom black curve and top black curve indicating fcp and 2 fcp, respectively. (d) Wave normal angle. (e) Ellipticity. (f) Power-weighted wave normal angle (red) and ellipticity (blue). (g) Wave amplitude of identified 1 Hz waves.
Download figure:
Standard image High-resolution imageAs illustrated by Figure 1(f), the power-weighted wave normal angle of the 1 Hz waves is mainly 20°–40°, and the power-weighted ellipticity is generally [−0.7, −0.6], indicating that the wave properties are consistent with the typical whistler-mode waves. Figure 1(g) exhibits the wave amplitude obtained by integrating the magnetic field wave power over 0.6–4 Hz. As we can see, the integrated wave amplitude of this event is generally >0.6 nT, with the peak wave amplitude of about 1.5 nT. As indicated by Figures 1(f) and (g), our wave selection criterion of drop level >20 dB is stringent; therefore, it would lead to an underestimation of wave occurrence.
Using this well-established wave database, we further explore the statistical properties of 1 Hz waves.
3. Statistical Results
3.1. Spatial Distributions of 1 Hz Waves
Figures 2(a)–(b) show the spatial distributions of 1 Hz wave amplitude in X–Y and X–Z planes of geocentric solar ecliptic (GSE) coordinates, respectively, while Figures 2(c)–(d) exhibit the results in the selenocentric solar ecliptic (SSE) coordinates. The GSE coordinates are Earth-centered, with the X-axis pointing from the Earth toward the Sun, the Z-axis paralleling the north normal of the ecliptic plane, and the Y-axis completing the orthogonal coordinate set. For SSE coordinates, the definition is analogous to the GSE coordinates but Moon-centered. Every dot in the figures represents a 1 Hz wave event. As shown in Figure 2, the amplitude of 1 Hz waves is generally 0.05–1 nT. For the wave distribution in the Earth-centered system (Figures 2(a) and (b)), the wave occurrence and amplitude exhibit no obvious dawn–dusk and north–south asymmetries. It is noteworthy that 1 Hz waves disappear at XGSE < ∼ −45 RE. This is consistent with a previous study, which reported that 1 Hz waves are not capable of passing through the magnetosheath (Russell 2007). As for the wave distribution in the Moon-centered system (Figures 2(c) and (d)), on the dayside, 1 Hz waves mainly occur near the Moon (XSSE < ∼ 4 RL), and the wave strength of 1 Hz waves is most intense in this region. On the nightside, 1 Hz waves occur extensively with moderately stronger wave amplitudes near the Moon (about or greater than 0.1 nT). As ∣XSSE∣ increases, the waves generally occur closer to both sides of YSSE = 0. It should be noted that 1 Hz waves cannot be observed in the typical lunar wake region right behind the Moon. Furthermore, at  = ∼11 RL, 1 Hz waves can be observed extensively with an occurrence peak in the midnight sector. This wave occurrence at a large radial distance might be related to the longer satellite dwelling time near the apoapsis. As shown in Figure 2(d), in the X–Z plane of the SSE coordinates, at ∣XSSE∣ < ∼4 RL, 1 Hz waves are generally observed near the equator. As ∣XSSE∣ increases, the waves extend to higher latitudes. At ∣XSSE∣ = 8–12 RL on the nightside, 1 Hz waves often occur at high latitudes on both hemispheres.

Figure 2. Spatial distributions of 1 Hz wave amplitude in the (a), (c) X–Y and (b), (d) X–Z planes of geocentric solar ecliptic (GSE) and selenocentric solar ecliptic (SSE) coordinates.
Download figure:
Standard image High-resolution imageFigure 3 exhibits the spatial distributions of the frequency of peak power spectral density fpeak (hereafter referred to as peak wave frequency) with the same format as Figure 2. As illustrated in Figure 3, the peak wave frequency is mainly located in the frequency range spanning 0.6–2 Hz, with a small population of wave events peaking at frequencies up to 3–4 Hz. In the Earth-centered system (Figures 3(a) and (b)), compared with the dusk sector, 1 Hz waves have a slightly higher peak wave frequency on the dawn sector of the Earth with averaged peak frequency of 1.59 Hz and 1.68 Hz respectively, but day–night (∼1.62 Hz) and north–south (1.63 and 1.61 Hz) dependences are not observed for the peak wave frequency of 1 Hz waves. For the peak wave frequency distribution in the Moon-centered system, as shown in Figure 3(c), at a large radial distance ( = 11 RL), the peak wave frequency is slightly higher at the dawn sector. For waves at small radial distances (
 < ∼ 6 RL), the peak wave frequency is higher on the nightside. Especially for wave events near YSSE = 0, the peak wave frequencies are generally >2 Hz. In the X–Z plane of SSE coordinates, the peak wave frequency also exhibits significant day–night asymmetry. In addition, 1 Hz waves tend to have slightly higher peak wave frequency in the Moon's northern hemisphere.

Figure 3. Spatial distributions of peak wave frequency in the (a), (c) X–Y and (b), (d) X–Z planes of the GSE and SSE coordinates.
Download figure:
Standard image High-resolution imageIn Figure 4, we merge all available data and investigate the wave properties in the longitude–latitude space with a resolution of 10° × 4° for each bin, and the local time corresponding to the longitude is shown by the red axes in the figure. Figure 4(a) shows the number of total satellite samples in each bin regardless of the presence of 1 Hz waves. In each bin, the threshold of the total sample number is set to 100 to eliminate the influence of accidental events as much as possible. Figure 4(b) displays the occurrence rates of 1 Hz waves as functions of the longitude and latitude. The occurrence rate in each bin is defined as the ratio between the number of 1 Hz wave events to the total number of satellite samples regardless of the presence of 1 Hz waves. As shown in Figure 4(b), it is preferable for 1 Hz waves to be observed on the dawn sector (longitude range of ∼−150°–−60°) of the Moon. In addition, the peak of occurrence rates occurs at high latitudes (>20°) on both hemispheres, with occurrence rates up to ∼8%. However, the corresponding number of satellite samples in the high latitudes is not abundant enough, thus decreasing the reliability of this result. Figure 4(c) shows the rms wave amplitude distributions of 1 Hz waves in the longitude–latitude space. It can be seen from the figure that the amplitudes of 1 Hz waves are predominantly distributed in the range of 0.05–1 nT. Specifically, 1 Hz waves are more intense on the dayside (longitude equals −90°–90°), with averaged wave amplitudes about or greater than ∼0.7 nT. Furthermore, the wave amplitudes exhibit moderate dawn–dusk and north–south asymmetries, with larger wave amplitude at dawn and in the south. This distribution pattern is generally consistent with that of strong magnetic anomalies, indicating a correlation between 1 Hz waves and magnetic anomalies (Tsugawa et al. 2011). Figure 4(d) illustrates the peak wave frequency of 1 Hz waves as a function of the longitude and latitude. One hertz waves tend to peak at a higher wave frequency on the nightside than on the dayside, while no obvious dawn–dusk and north–south asymmetries are observed.
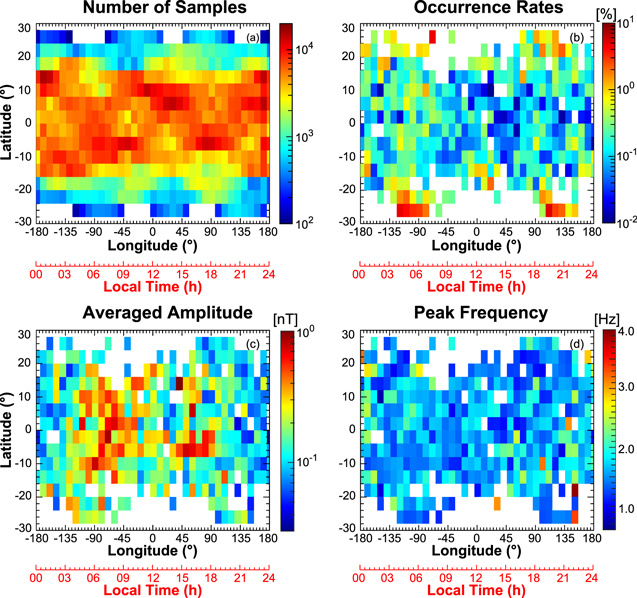
Figure 4. Spatial distributions of (a) the total number of satellite observation points in each longitude–latitude bin (0° longitude represents noon, local time) regardless of the presence of 1 Hz waves; (b) occurrence rates; (c) averaged wave amplitude; and (d) peak wave frequency of 1 Hz waves. Local time corresponding to the longitude is marked by the red axes.
Download figure:
Standard image High-resolution image3.2. Wave Normal Angle and Ellipticity Distributions of 1 Hz Waves
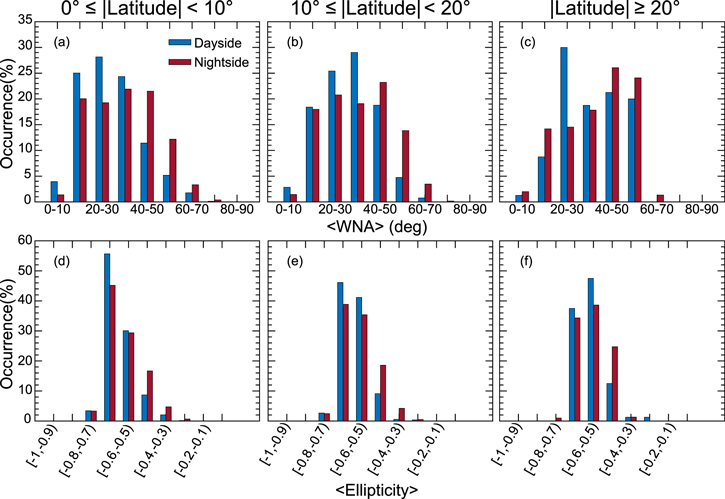
Figure 5 shows power-weight wave normal angle (Figures5(a)–(c)) and ellipticity (Figures 5(d)–(f)) distributions of 1 Hz waves on the dayside (blue bars) and nightside (red bars). From left to right, the wave amplitudes are sorted into three intervals: weak (0.03–0.1 nT), moderate (0.1–0.3 nT), and strong (>0.3 nT). The occurrence rates are defined as the ratio between the number of 1 Hz wave events in each wave normal angle (ellipticity) bin and the total number of 1 Hz waves in the designated amplitude level. The results of dayside and nightside are calculated separately. As shown in Figure 5, most (over 95%) power-weighted wave normal angles of 1 Hz waves are located at 0°–60°. As the wave amplitudes increase, the wave normal angles of 1 Hz waves tend to decrease. Specifically, the percentage of waves with small wave normal angled gradually increases, and that of large wave normal angles decreases correspondingly. For weak 1 Hz waves (0.03–0.1 nT), wave normal angles are distributed relatively evenly over a range of 10°–50° (10°–60° for nightside waves) with a percentage of ∼20% in each wave normal angle bin. For strong waves (≥0.3 nT), wave normal angles are distributed more concentratedly with the peak of occurrence rate (>30%) located at 20°–30° and over ∼80% of the waves having a wave normal angle of 10°–40°. Compared with nightside, dayside waves generally have a smaller wave normal angle. The ellipticities of 1 Hz waves (Figures 5(d)–(f)) are mainly distributed in the range of [−0.8, −0.3]. As the wave strength intensifies, the waves tend to be more left-hand circularly polarized, with the peak of occurrence rate accounting for ∼65% at smaller ellipticity ([−0.7, −0.6]). For weak and moderate 1 Hz waves, dayside waves are slightly more left-hand circularly polarized, while nightside waves tend to be more left-hand circularly polarized for strong waves.

Figure 5. Occurrence rates of power-weighted wave normal angle (a)–(c) and ellipticity (d)–(f) on the dayside (blue) and nightside (red) for three different wave amplitude levels.
Download figure:
Standard image High-resolution imageIn Figure 6 we further explore power-weighted wave normal angle (Figures 6(a)–(c)) and ellipticity (Figures 6(a)–(c)) distributions of 1 Hz waves in three different latitude intervals. As shown in Figures 6(a)–(c), for all three latitude intervals concerned, wave normal angles of 1 Hz waves are predominantly (>95%) distributed in the range of 0°–60° on both dayside and nightside. As the latitude increases, high wave normal angle waves tend to account for a slightly larger proportion, i.e., the percentage of wave normal angles in 50°–60° increases sharply from ∼5% on the dayside (∼12% on the nightside) in near-lunar equator regions (<10°) to 20% on the dayside (24% on the nightside) in high-latitude regions (>20°). In addition, the wave normal angles of waves on the dayside are slightly smaller than on the nightside. For power-weighted ellipticity distributions shown in Figures 6(d)–(f), 1 Hz waves generally have ellipticity in the range between −0.8 and −0.3. As the latitude increases, the ellipticity of 1 Hz waves becomes more linearly polarized. For instance, the occurrence of 1 Hz waves at [−0.7, −0.6) considerably decreases from ∼56% in near-lunar equatorial regions to ∼38% in high-latitudinal regions. In the meantime, the occurrence of ellipticity in the range of [−0.6, −0.4] moderately increases. Besides that, 1 Hz waves are slightly more likely to be left-hand circularly polarized on the dayside than on the nightside.
Figure 6. Occurrence rates of power-weighted wave normal angle (a)–(c) and ellipticity (d)–(f) on the dayside (blue) and nightside (red) for three different latitude intervals.
Download figure:
Standard image High-resolution image
4. Conclusions and Discussions
In this study, using 5.5 yr observational data from the ARTEMIS P2 spacecraft, we have performed a detailed statistical analysis of the spatial distributions of wave occurrence, wave amplitude, and peak wave frequency for lunar 1 Hz waves. Furthermore, we have comprehensively investigated the wave normal angle and ellipticity features of these 1 Hz emissions. Our principal conclusions are summarized as follows:
In the Earth-centered system: The wave amplitudes of lunar 1 Hz waves show no clear dawn–dusk and north–south asymmetries. In addition, 1 Hz waves cannot be observed inside the Earth's magnetosphere. For peak wave frequency, the wave power of 1 Hz waves peaks at a slightly higher frequency on the dawn sector while showing no clear difference between day–night and north–south sectors.
In the Moon-centered system: (1) The amplitude of 1 Hz waves is generally 0.05–1 nT. One hertz waves can be observed over a broad range of 1.1–12 RL, with a major peak at a small radial distance (<8 RL) and a secondary peak at a large distance (>∼10 RL). Wave amplitudes are stronger and mainly confined closer to the Moon (<∼4 RL) on the dayside with average values of >∼0.7 nT. In contrast, on the nightside, 1 Hz waves can extend to a larger radial distance and generally occur near YSSE = 0 except at XSSE < −10 RL. In addition, 1 Hz waves cannot be observed in the lunar wake region due to a lack of interaction with the solar wind.
(2) 1 Hz waves are more likely to occur at the dawn sector (longitude = −150° to −60°) with peak occurrence rates of ∼8% at high-latitude regions. The amplitude of 1 Hz waves is most intense on the dayside, with modest dawn−dusk and north–south asymmetries, showing a similar distribution pattern with strong magnetic anomalies. However, the peak wave frequency is higher on the nightside.
(3) 1 Hz waves predominantly propagate at wave normal angles <60° with ellipticity at [−0.8, −0.3]. As wave amplitudes increase, wave normal angles decrease, and the waves become more left-hand circularly polarized. The increase in latitudes plays an opposite role.
Because some of the power spectra of 1 Hz waves do not have a steep lower frequency cutoff, the selection criterion of drop level >20 dB would exclude a certain number of waves from our wave database, leading to the underestimation of wave occurrence. According to our results, 1 Hz waves exhibit clear wave normal angle dependence. Therefore, using wave normal angle as a supplementary proxy for identifying 1 Hz waves might help us obtain a more comprehensive understanding of 1 Hz waves.
Numerous studies have also been performed to analyze the characteristics of 1 Hz waves in planetary bodies besides the Moon (Fairfield 1974; Orlowski & Russell 1991; Russell 2007; Ruhunusiri et al. 2018, etc). Their results generally show that 1 Hz waves exhibit similar properties on these planets. Specifically, 1 Hz waves mainly propagate at wave normal angles < ∼55° to the magnetic field with most commonly left-handed polarization. The wave amplitude generally decreases with increasing distance from the shock. Furthermore, the wave frequencies decrease as the planets are located farther away from the Sun. As shown in this paper, 1 Hz waves at the Moon generally show similar wave features. Our results might imply that although these planets and the Moon are of different sizes and have different interactions with the solar wind, 1 Hz waves in these plasma environments might share similar generating mechanisms. Occurrence features and intensity distributions of 1 Hz waves in the selenographical coordinates indicate that 1 Hz waves often occur in regions with lunar magnetic anomalies. Strong 1 Hz waves are significantly associated with strong magnetic anomalies (Halekas et al. 2006; Tsugawa et al. 2011). In addition, wave distributions in the SSE coordinates have also been explored in these studies. Despite different orbital coverage, our results of wave distributions exhibit similar features in that the waves are rarely observed in the wake regions, and the favorable occurrence regions of waves with strong wave power are generally consistent in the overlapping regions of satellite orbits. Consequently, our results demonstrate a positive correlation between 1 Hz waves and lunar crustal magnetic fields as well. In addition, as reported by previous studies (Tsugawa et al. 2011; Harada et al. 2015), the generating mechanism of 1 Hz waves could be the ions reflected by the lunar magnetic anomalies. This hypothesis is also supported by observational results such as in Figure 1. However, further numerical simulations are needed to quantitatively estimate the contribution of reflected ions to the excitation of 1 Hz waves.
One hertz waves can be observed over a broad spatial range in the lunar plasma environment. But the interactions between 1 Hz waves and particles lack systematical evaluation. It is also suggested that the 1 Hz narrowband whistlers and the broadband whistler-mode waves can have the same wave source (Tsugawa et al. 2012). To further understand the correlation between these two wave modes, it is crucial to obtain detailed global morphology and wave properties of broadband whistler-mode waves and compare the similarities and differences between these two wave modes, which is left as future work.
This work was supported by the NSFC grants 42025404, 42188101, 41904144 and 41974205, 41804157, and 42130204, the B-type Strategic Priority Program of the Chinese Academy of Sciences (grant No. XDB41000000), the preresearch projects on Civil Aerospace Technologies No. D020308, D020104, D020303, and No. D020103 funded by the China National Space Administration, Macau foundation, the Fundamental Research Funds for the Central Universities (2042021kf1045 and 2042021kf1056), the China Postdoctoral Science Foundation (2020M672405), the Guangdong Basic and Applied Basic Research Foundation (2022A1515010257), and the Shenzhen Science and Technology Project (JCYJ20210324121403009). T.Z. was supported by the CAS Center for Excellence in Comparative Planetology. We acknowledge K. H. Glassmeier, U. Auster, and W. Baumjohann for the use of FGM data and C. W. Carlson and J. P. McFadden for use of ESA data. All ARTEMIS data used are available at http://artemis.ssl.berkeley.edu.