


Abstract
Recently the AMS-02 collaboration published detections of light cosmic-ray nuclei, including lithium, beryllium, boron, carbon, and oxygen. Combined with the released energy spectra of proton and helium, both primary and secondary spectra have a prominent hardening above ∼200 GV. In particular, the spectral variation of secondary cosmic rays is greater than the primary ones. One of the plausible interpretations for the above anomalies is the spatial-dependent diffusion model. It has successfully described various observational phenomena, e.g., hardening of primary nuclei, diffuse gamma-ray distribution and cosmic-ray anisotropy, etc. In this work, we apply the spatial-dependent propagation model to the latest observations, including both primary and secondary nuclei. Apart from the primary components, the spectra of secondary nuclei can be properly reproduced as well, especially the upturn above 200 GV. We also calculate the ratios of both secondary-to-primary and secondary-to-secondary. We find that except for the Be/B ratio, the computations of the spatial-dependent propagation model are in good agreement with the current data.
Export citation and abstract BibTeX RIS
1. Introduction
Nowadays, more and more signs call for modifications of the conventional cosmic-ray (CR) picture. Among them, the unexpected excesses of CR proton and helium fluxes above a few hundred GV have elicited widespread interest. The anomalies have been observed by ATIC-2 (Panov et al. 2006, 2009), CREAM (Ahn et al. 2010; Yoon et al. 2011, 2017), and PAMELA (Adriani et al. 2011) experiments respectively. According to their observations, more than ∼200 GV, the fluxes of both elements steadily grow with energy. Later on, such features were further identified by the AMS-02 experiment with a higher significance (Aguilar et al. 2015a, 2015b), which shows that the slope changes of proton and helium are 0.13 and 0.12 respectively. Not long ago the AMS-02 collaboration reported the precise measurements of carbon and oxygen. Both of them exhibit the same rigidity dependence as helium, that is, their energy spectra harden at rigidities above 200 GV (Aguilar et al. 2017).
The hardening also goes for the secondary CR nuclei. The AMS-02 collaboration claimed that between ∼60 GV and ∼450 GV the antiproton-to-proton ratio does not manifest explicit rigidity dependence (Aguilar et al. 2016). To be specific, within this energy range the antiproton spectrum has an identical power index as the proton. However, the standard transport picture predicts that the ratio of secondary-to-primary nuclei approximately falls off with energy, roughly  , where δ is the power index of the diffusion coefficient. Most recently the AMS-02 collaboration published the energy spectra of light secondary nuclei, including lithium, beryllium, and boron with very high accuracy (Aguilar et al. 2018). The deviation from a single power law is clearly visible in all three spectra above 200 GV, with an average hardening of 0.13, larger than helium, carbon, and oxygen.
The spectral hardening brings about different alternatives to the traditional CR theory. Most of them fall into, but are not limited to, three categories: the acceleration process (Biermann et al. 2010; Ohira & Ioka 2011; Yuan et al. 2011; Malkov et al. 2012; Khiali et al. 2017), the transport effect (Blasi et al. 2012; Blasi & Amato 2012; Tomassetti 2012; Vladimirov et al. 2012; Evoli & Yan 2014; Thoudam & Hörandel 2014; Aloisio et al. 2015; Tomassetti 2015a; Feng et al. 2016; Guo et al. 2016; Jin et al. 2016; Guo & Yuan 2018a, 2018b), as well as the origin of local source(s) (Bernard et al. 2012; Thoudam & Hörandel 2012, 2013; Bernard et al. 2013; Liu et al. 2015, 2017; Tomassetti & Donato 2015; Tomassetti 2015b; Kawanaka & Yanagita 2018). One of the popular scenarios is the so-called spatial-dependent propagation (SDP) model. It was first introduced by Tomassetti (2012) as the Two Halo model (THM) which well explains the proton and helium anomalies. Usually the CR diffusion is regarded as uniform and isotropic on large scales. Thus, it is only a function of rigidity, which does not vary spatially. But in the SDP model, the whole transport volume is divided into two regions. The Galactic disk and its surrounding area are called the inner halo (IH), in which the diffusion property is influenced by the distribution of CR sources. Outside of IH, the diffusion approaches the traditional assumption, i.e., that it is only rigidity dependent. This extensive region is named the outer halo (OH). To reproduce the high energy excess, the diffusion coefficient within IH has a weaker rigidity dependence on average, compared with the OH zone. In addition to the spectral hardening, the SDP model is also applied to solve the puzzles of large-scale anisotropy, diffuse gamma-ray distribution and so forth (Tomassetti 2012; Guo et al. 2016; Guo & Yuan 2018b).
In this work, we further study the spatial-dependent diffusion model by applying the latest observations of CR nuclei. Our calculations show that the energy spectra of both primaries and secondaries can be well described, as can the B/C ratio. The other secondary-to-primary and secondary-to-secondary ratios are computed as well. We find that, except for the Be/B ratio, their rigidity dependence can be well reproduced. The discrepancy of the Be/B ratio between the calculation and measurements may result from the uncertainties of the production cross section of beryllium.
The rest of the paper is organized as follows: In Section 2, we briefly touch on the SDP model. The results are presented in Section 3. Section 4 is reserved for our discussion and conclusion.
2. Spatial-dependent Propagation
After escaping from the acceleration sites, CRs undergo diffusive motion within a so-called magnetic halo. The shape of the magnetic halo is usually approximated to a cylinder, with the Galactic disk embedded in the middle. The radial boundary of magnetic halo defaults to the Galactic radius, i.e., R = 20 kpc, whereas its half thickness zh is uncertain, which has to be evaluated by the aid of CR data. Both CR sources and interstellar medium (ISM) chiefly spread within the Galactic disk, whose width zs is uniform and defined to 200 pc. Aside from the diffusion effect, CR nuclei may still suffer from the convection, reacceleration, and fragmentation due to the collisions with interstellar gas. At lower energy, CR nuclei further lose their energy via ionization and Coulomb scattering. The transport equation is generally written as
where  is the CR density per total particle momentum p at position
  . On the halo border, the free escape condition is imposed, namely
  . For a comprehensive introduction to the CR transport, one can refer to Maurin et al. (2002), Strong et al. (2007), and Grenier et al. (2015). In this work, we adopt the well-known diffusion-reacceleration model, which is shown to well describe the energy spectra of both CR nuclei and secondary-to-primary ratios (Trotta et al. 2011; Jóhannesson et al. 2016; Yuan et al. 2017).
The spatial distribution of CR sources is parameterized as
with  , α = 1.09, and
  (Green 2015) respectively.
  is normalized to 1 at solar system. In the original version of diffusive shock acceleration, a single power-law spectrum is anticipated. However, several separate studies (Trotta et al. 2011; Boschini et al. 2017; Yuan 2018; Yuan et al. 2018) have pointed out that the assumption of a single power-law injection spectrum could not reproduce the observations well, especially in the diffusion-reacceleration model. Recently some people proposed that if η in the diffusion coefficient is negative, the assumption of spectral break could be discarded (Evoli et al. 2008; Di Bernardo et al. 2010; Feng et al. 2016; Feng & Zhang 2018). In this work our major concern is the energy spectra above tens of GV, thus the rigidity dependence of the injection spectrum is supposed to have a broken power law, i.e.,
with q0 the normalization factor.  (
( ) is the spectral index below (above) rigidity
  and
and  is the cutoff rigidity.
Nearby the Galactic disk, the turbulence is appreciably affected by the activities of supernova explosions. Hence the level of turbulence is expected to be intense near the large population of sources and correspondingly the diffusion process is slow. At regions with fewer sources, the turbulence is moderate, so the diffusion tends to be fast. Therefore, inside the IH region, the diffusion coefficient is parameterized as a function of r and z, i.e.,

Both  and
and  are anticorrelated with the source density (Guo & Yuan 2018b), which are parameterized as
in which ![$g(r,z)={N}_{m}/[1+f(r,z)]$](https://content.cld.iop.org/journals/0004-637X/869/2/176/revision2/apjaaef39ieqn14.gif) . The size of the IH region is represented by its half thickness
. The size of the IH region is represented by its half thickness  , whereas the OH region's is
  . Within the OH region, the turbulence is believed to be CR-driven in principle and less impacted by the stellar activities. Hence the diffusion is regarded as only rigidity dependent, namely
  .
.
Lithium, beryllium, boron, and antiproton are conventionally treated as secondary CRs, which are chiefly brought forth by the spallation of primary CRs along with the radioactive decay throughout the transport. For the production of lithium, beryllium, and boron, the so-called straight ahead approximation is widely adopted, in which the kinetic energy per nucleon is conserved during the collision. Their source terms read

where  is the number density of interstellar hydrogen/helium and
  is the total cross section of the relevant hadronic interaction. Unlike the above nuclei, the generation of antiproton is expressed as a convolution of the primary spectrum
  with the corresponding differential cross section
  , i.e.,
The numerical package DRAGON is introduced to solve the transport equation to obtain the spatial distribution of both primary and secondary CRs. Less than tens of GeV, the CR flux are impacted by the solar modulation. The well-known force-field approximation (Gleeson & Axford 1968) is used to describe the effect, with a modulation potential ϕ adjusted to fit the low energy data.
3. Results
3.1. Primary Nuclei
In Figure 1, we show the fittings to the energy spectra of primary components, including proton, helium, carbon, and oxygen, as a function of rigidity. The red points and green squares are the AMS-02 and CREAM measurements respectively. The black solid lines are the propagated spectra within the SDP model. The fitted parameters for transport and injection spectrum for the proton are listed in Table 1, where Nm
and n are the parameters in  (Guo & Yuan 2018b). For helium, carbon, and oxygen, the difference of power indices and corresponding elemental abundances with respect to the proton are shown in Table 2.

Figure 1. Fittings to the spectra of primary nuclei, namely proton (upper left), helium (upper right), carbon (lower left), and oxygen (lower right), in which each spectrum is multiplied by  . Red data points denote the AMS-02 measurements (Aguilar et al. 2015a, 2017), while the green squares are from the CREAM experiment (Ahn et al. 2009; Yoon et al. 2017). The black solid line is the calculated fluxes under the SDP model. The parameters for transport and injection spectrum are listed in Tables 1 and 2.
Download figure:
Standard image High-resolution imageTable 1. Parameters of Transport and Injection Spectrum
D0
![$[{\mathrm{cm}}^{2}\,{{\rm{s}}}^{-1}]$](https://content.cld.iop.org/journals/0004-637X/869/2/176/revision2/apjaaef39ieqn24.gif)
|

|

| 0.6 |
vA
![$[\mathrm{km}\,{{\rm{s}}}^{-1}]$](https://content.cld.iop.org/journals/0004-637X/869/2/176/revision2/apjaaef39ieqn27.gif)
| 6 |
| zh [kpc] | 5 |
| Nm | 0.24 |
| ξ | 0.1 |
| n | 4 |
q0
![$[{({{\rm{m}}}^{2}\,\mathrm{sr}\,{\rm{s}}\,\mathrm{GeV})}^{-1}]$](https://content.cld.iop.org/journals/0004-637X/869/2/176/revision2/apjaaef39ieqn28.gif)
|

|

| −2.0 |

| −2.39 |
 [GV] [GV] | 5.5 |
 [TV] [TV] | 180 |
Download table as: ASCIITypeset image
Table 2. Injection Spectral Variation  and Elemental Abundance a of Primary Nuclei Compared with Proton
| Symbol | Z |

| a |
|---|---|---|---|
| H | 1 | 0 | 1 |
| He | 2 | 0.1 |

|
| C | 6 | 0.06 |

|
| O | 8 | 0.05 |

|
Download table as: ASCIITypeset image
Due to the discrepancy of diffusion properties between IH and OH regions, the spectral index naturally generates a break after propagation. Compared with the low energy components, the high energy CRs mainly come from the neighboring regions and their transport is dominated by the IH, in which the rigidity dependence of the diffusion coefficient is slight. From the figure, it can be seen that the spectra of primary CR nuclei grow hardening above ∼200 GV, which is in agreement with the AMS-02 observations. The position of the spectral break and its variation are principally regulated by the parameter Nm
, as well as the size of IH region, viz. ξ. Observationally the spectrum of helium is harder than proton, which may originate from the acceleration process at the source region. Accordingly, the fitted injection spectrum of helium is about 0.1 harder than proton. To fit the spectra below tens of GV, the modulation potential for proton and helium are  and
and  MV respectively. Furthermore, recent observations by the CREAM collaboration found a remarkable spectral softening for both proton and helium nuclei above ∼20 TeV (Yoon et al. 2017), which has been confirmed by the NUCLEON experiment (Atkin et al. 2017, 2018). To account for such a spectral change, the cutoff rigidity
  is adjusted to 180 TV.
Since the transport processes of primary nuclei are similar, the propagated spectra of carbon and oxygen likewise manifest remarkable excesses, which well reproduce the observed hardening by the AMS-02 experiment. They also show an identical rigidity of upturn as helium. Here given the visibly different absolute fluxes between the AMS-02 and CREAM experiments for carbon and oxygen, we leave CREAM data out of fitting. Like helium, both injection spectra are harder than proton. But it is noteworthy that their injection power index  , which is slightly smaller than that of helium,
  . This is required by the transport process. Compared with proton and helium, the interactions of carbon and oxygen nuclei with interstellar gas are stronger, which notably suppress low energy fluxes and makes the propagated spectrum harder. Since their observed energy spectra are close to helium, the injection spectra have to be softer than helium. This has been confirmed in the recent parameter fittings by the means of the Markov chain Monte Carlo technique (Yuan 2018; Yuan et al. 2018). The modulation potentials for carbon and oxygen are
  and
and  MV respectively.
3.2. Secondary Nuclei
Similar hardening appears in the secondary nuclei as well. Figure 2 demonstrates the comparison between the propagated spectra computed by the SDP model and the AMS-02 measurements. Under the SDP scenario, the spectral hardening of secondaries can be naturally generated. As can be seen from the figure, the energy spectra of lithium, beryllium, and boron deviate from a single power law above ∼200 GV in a similar way, which is in accordance with the AMS-02 observation. The hardening of secondaries principally has two sources: the hardening of propagated primary spectrum and spatial-dependent propagation. Hence an excess in the spectrum of secondary-to-primary ratios is also expected under the SDP model, which are shown in the next figures. The modulation potentials for lithium and boron are  and
and  MV respectively, whereas for beryllium it is significantly larger, up to
  MV.
MV.

Figure 2. Spectra of secondary nuclei, including antiproton (upper left), lithium (upper right), beryllium (lower left), and boron (lower right), in which each spectrum is multiplied by  . Red data points denote the AMS-02 measurements (Aguilar et al. 2016, 2017). The black solid lines are the calculated fluxes under the SDP model.
Download figure:
Standard image High-resolution imageIn contrast to lithium, beryllium, and boron, the generated antiprotons by p–p and p–He interactions have a broad energy distribution. The default cross section of p–p interaction in the DRAGON package is the parameterized formula of Tan & Ng (1983). However, this parameterization systematically underestimates the yield of antiprotons at low energies, especially in the diffusion-reacceleration model, which has been pointed out by Trotta et al. (2011), Evoli et al. (2012), and Lin et al. (2017). In this work, we apply an updated cross section, EPOS 1.99 (Pierog & Werner 2009), to compute antiproton injection spectrum. In the upper left of Figure 2, we show the fitting to the antiproton spectrum. Above 10 GV, there is a slight rigidity dependence of antiproton spectrum, which declines gradually with energy. Within the measurement uncertainties, our computation is compatible with the observed spectrum of antiproton. We hope the future detections extend to higher energies so that we can draw a definitive conclusion about the rigidity dependence. The modulation potential for antiproton is  .
.
We further compute the rigidity dependence of secondary-to-primary ratios, i.e., B/C and  , which are shown in Figure 3. The B/C ratio is widely used for the evaluation of transport parameters. Under the current transport parameters, the SDP model can well describe the rigidity dependence of the observed B/C ratio by AMS-02 observations in a wide rigidity range. Different from the traditional diffusion scenario, the SDP model anticipates an excess of B/C ratio above 200 GV, which is indicated in Figure 3. Beyond 200 GV, the B/C ratio becomes hardened slowly. The more accurate detections of the B/C ratio to higher energy can verify the origin of nuclei hardening as well as the SDP model. In addition, to reproduce the rigidity dependence of the B/C ratio, the power index of local diffusion is 0.12 in this work. Recent observations show that the local turbulent magnetic field follows a Kolmogorov
  spectrum, which means δ at the solar system closes to 0.333 (Burlaga et al. 2015). Our fitted exponent is smaller than the observation. As for the
  ratio, the observed energy dependence could be well reproduced by the updated cross section. Above 1 TV, the
  ratio gradually declines.
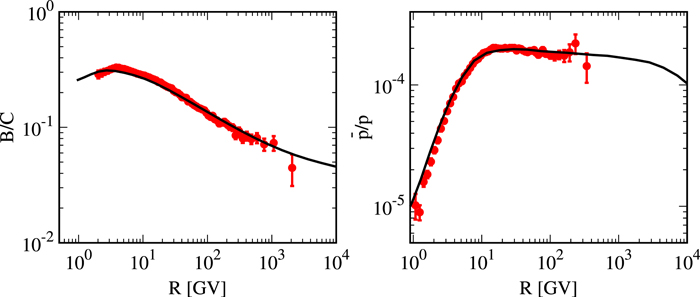
Figure 3. The B/C (left) and  (right) ratios as function of rigidity. Red data points denote the AMS-02 measurements (Aguilar et al. 2015a, 2017). The black solid lines are the calculated ratios under the SDP model.
Download figure:
Standard image High-resolution image3.3. Other Ratios
The AMS-02 experiment also measured the rigidity dependence of other secondary-to-primary ratios, which also reflect the transport behavior of CRs in the Galaxy. Figure 4 illustrates the fittings to the ratios of Li/C, Be/C, Li/O, and Be/O respectively. Above 10 GV, the rigidity dependences of fitting spectra are in agreement with the AMS-02 measurements. It is worth noting that compared with Li/C and Li/O ratios, both Be/C and Be/O ratios are marginally consistent with the lower limit of measurements. The yield of beryllium may be underestimated according to the available production cross section. Like the B/C ratio, all of them also show excesses over 200 GV under the SDP model, which could be testified by future experiments. Less than 10 GV, there is a break for each ratio and our computation naturally describes this low energy behavior.
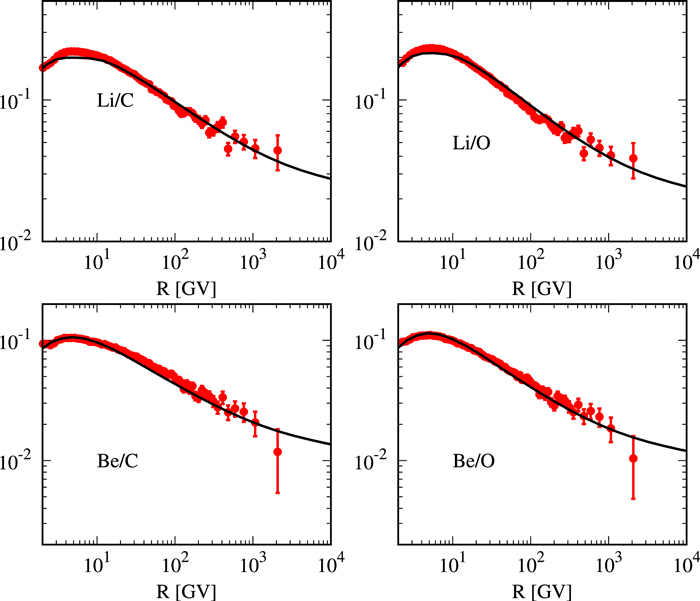
Figure 4. Ratios of secondary-to-primary nuclei as a function of rigidity, i.e., Li/C (upper left), Li/O (upper right), Be/C (lower left), and Be/O (lower right). Red data points denote the AMS-02 measurements (Aguilar et al. 2017). The black solid lines are the calculated ratios under the SDP model.
Download figure:
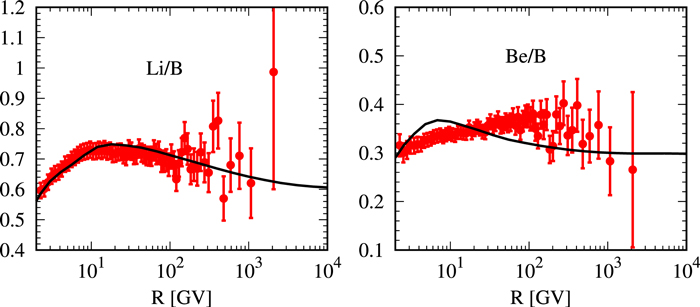
Standard image High-resolution imageWe also compute the rigidity evolution of secondary-to-secondary ratios, e.g., Li/B and Be/B, as shown in Figure 5. Unlike secondary-to-primary ratios, they could not provide the information of diffusion process. But they can uncover the energy dependence of production cross section. We find that the calculated Li/B ratio is consistent with the AMS-02 observation. But for the Be/B ratio, our computation cannot well explain its rigidity dependence, which may come from the uncertainties of production cross section of beryllium.
Figure 5. Ratios of secondaries as a function of rigidity, Li/B (left), Be/B (right). Red data points denote the AMS-02 measurements (Aguilar et al. 2017). The black solid lines are the calculated ratios under the SDP model.
Download figure:
Standard image High-resolution image
4. Conclusion
With the development of instruments, the CR detections have been greatly improved. Accurate observations could contribute to our understanding of CR acceleration and the subsequent transport. Recently the AMS-02 collaboration successively issues the high-precision measurements of light CR nuclei, including lithium, beryllium, boron, carbon, and oxygen. Along with the published proton and helium spectra, the spectral hardening above ∼200 GV is widespread in CR nuclei. These new discoveries impose a great challenge on the standard picture of CR acceleration and propagation.
In this work, we investigate the spatial-dependent propagation model with the latest observations from the AMS-02 and CREAM experiments. In the SDP model, due to the smaller rigidity dependence in the vicinity of Galactic disk, the CR spectrum becomes hardened at high energy. We find that under the SPD model, the hardening of both primary and secondary spectra can be naturally accounted for and the calculated B/C ratio is in accordance with the measurements. The other observed ratios of secondary-to-primary and secondaries are also computed. The rigidity dependence of the Be/B ratio is not nicely fitted, which may originate from the uncertainties of the production cross section of secondaries, especially beryllium. Recently, Genolini et al. (2018) reviewed the current knowledge of production cross sections of Li, Be, and B. We hope more accurate cross section measurements will be available in the future. Furthermore, we also expect that future experiments can accurately extend the energy spectra to higher energy in order to test our model.
We thank Profs. Hong-bo Hu and Qiang Yuan for helpful discussions. We appreciate Su-jie Lin for the discussion of the generated cross section of antiproton and provide EPOS 1.99 data. This work is supported by the National Key Research and Development Program of China (No. 2016YFA0400200), the National Natural Science Foundation of China (Nos. 11875264, 11635011, 11761141001, and 11663006).
Software: DRAGON (Evoli et al. 2008, 2017) available at https://github.com/cosmicrays.