


Abstract
We present Atacama Large Millimeter/submillimeter Array and Multi-Unit Spectroscopic Explorer observations of the brightest cluster galaxy in Abell 2597, a nearby (z = 0.0821) cool core cluster of galaxies. The data map the kinematics of a three billion solar mass filamentary nebula that spans the innermost 30 kpc of the galaxy's core. Its warm ionized and cold molecular components are both cospatial and comoving, consistent with the hypothesis that the optical nebula traces the warm envelopes of many cold molecular clouds that drift in the velocity field of the hot X-ray atmosphere. The clouds are not in dynamical equilibrium, and instead show evidence for inflow toward the central supermassive black hole, outflow along the jets it launches, and uplift by the buoyant hot bubbles those jets inflate. The entire scenario is therefore consistent with a galaxy-spanning "fountain," wherein cold gas clouds drain into the black hole accretion reservoir, powering jets and bubbles that uplift a cooling plume of low-entropy multiphase gas, which may stimulate additional cooling and accretion as part of a self-regulating feedback loop. All velocities are below the escape speed from the galaxy, and so these clouds should rain back toward the galaxy center from which they came, keeping the fountain long lived. The data are consistent with major predictions of chaotic cold accretion, precipitation, and stimulated feedback models, and may trace processes fundamental to galaxy evolution at effectively all mass scales.
1. Introduction
Abell 2597 is a cool core cluster of galaxies at redshift z = 0.0821 (Figure 1). The galaxies inhabit a megaparsec-scale bath of X-ray-bright, ∼107−108 K plasma whose central particle density is sharply peaked about a giant elliptical brightest cluster galaxy (BCG) in the cluster core. Under the right conditions (e.g., Fabian et al. 1994; Peterson & Fabian 2006), the dense halo of plasma that surrounds this galaxy can act like a reservoir from which hot gas rapidly cools, driving a long-lived rain of thermally unstable multiphase gas that collapses toward the galaxy's center (e.g., Gaspari et al. 2017), powering black hole accretion and ∼5 M⊙ yr−1 of star formation (Tremblay et al. 2012a, 2016). The rate at which these cooling flow mass sinks accumulate would likely be higher were the hot atmosphere not permeated by a ∼30 kpc scale network of buoyantly rising bubbles (Figure 1(a)), inflated by the propagating jet launched by the BCG's central accreting supermassive black hole (Taylor et al. 1999; McNamara et al. 2001; Clarke et al. 2005; Tremblay et al. 2012b). Those clouds that have managed to cool now form a multiphase filamentary nebula, replete with young stars, that spans the inner ∼30 kpc of the galaxy. Its fractal tendrils, likely made of many cold molecular clouds with warmer ionized envelopes (e.g., Jaffe et al. 2005), wrap around both the radio jet and the the X-ray cavities the jet has inflated (Figures 1(b) and (c); McNamara & O'Connell 1993; Voit & Donahue 1997; Koekemoer et al. 1999; McNamara et al. 1999; O'Dea et al. 2004; Oonk et al. 2010; Tremblay et al. 2012a, 2015; Mittal et al. 2015).

Figure 1. A multiwavelength view of the Abell 2597 brightest cluster galaxy. (Left) Chandra X-ray, HST, and DSS optical, and Magellan Hα+[N ii] emission are shown in blue, yellow, and red, respectively (Credit: X-ray: NASA/CXC/Michigan State University/G.Voit et al; optical: NASA/STScI and DSS; Hα: Carnegie Observatory/Magellan/W. Baade Telescope/University of Maryland/M.McDonald). (Top right) HST/STIS MAMA image of Lyα emission associated with the ionized gas nebula. Very Large Array (VLA) radio contours of the 8.4 GHz source are overlaid in black. (Bottom right) Unsharp mask of the HST/ACS SBC far-ultraviolet continuum image of the central regions of the nebula. 8.4 GHz contours are once again overlaid. In projection, sharp-edged rims of the far-ultraviolet continuum to the north and south wrap around the edges of the radio lobes. Dashed lines indicate relative fields of view between each panel. The centroids of all panels are aligned, with east left and north up. This figure has been partially adapted from Tremblay et al. (2016).
Download figure:
Standard image High-resolution imageThese X-ray cavities act as a calorimeter for the efficient coupling between the kinetic energy of the jet and the hot intracluster medium through which it propagates (e.g., Churazov et al. 2001, 2002). Given their ubiquity in effectively all cool core clusters, systems like Abell 2597 are canonical examples of mechanical black hole feedback, a model now routinely invoked to reconcile observations with a theory that would otherwise overpredict the size of galaxies and the star formation history of the universe (see, e.g., reviews by Veilleux et al. 2005; McNamara & Nulsen 2007; Alexander & Hickox 2012; Fabian 2012; McNamara & Nulsen 2012; Gaspari et al. 2013; Kormendy & Ho 2013; Bykov et al. 2015). Yet, just as for quasar-driven radiative feedback invoked at earlier epochs (e.g., Bower et al. 2006; Croton et al. 2006), the degree to which the mechanical luminosity of jets might quench (or even trigger) star formation depends on how it might couple to the origin and fate of cold molecular gas, from which all stars are born.
Observational evidence for this coupling grows even in the absence of a consensus explanation for it. The density contrast between hot (∼107 K) plasma and cold (∼10 K) molecular gas is nearly a million times greater than that between air and granite. So while one might naturally expect that the working surface of a jet can drive sound waves and shocks into the tenuous X-ray atmosphere, it is more difficult to explain the growing literature reporting observations of massive atomic and molecular outflows apparently entrained by jets (e.g., Morganti et al. 2005, 2013; Alatalo et al. 2011, 2015; Rupke & Veilleux 2011; Cicone et al. 2014, 2018; Dasyra et al. 2015) or uplifted in the wakes of the buoyant hot bubbles they inflate (e.g., McNamara et al. 2014, 2016; Russell et al. 2014, 2016, 2017a, 2017b). One might instead expect molecular nebulae to act like seawalls, damping turbulence, breaking waves in the hotter phases of the Interstellar Medium (ISM), and redirecting jets. Recent single-dish and Atacama Large Millimeter/submillimeter Array (ALMA) observations of cool core clusters nevertheless reveal billions of solar masses of cold gas in kiloparsec-scale filaments draped around the rims of radio lobes or X-ray cavities (e.g., Perseus: Lim et al. 2008; Salomé et al. 2008, Phoenix: Russell et al. 2017a, Abell 1795: Russell et al. 2017b, M87: Simionescu et al. 2018), or trailing behind them as if drawn upward by their buoyant ascent (e.g., Abell 1835: McNamara et al. 2014; 2A 0335+096: Vantyghem et al. 2016; PKS 0745−191: Russell et al. 2016).
Such a coupling would be easier to understand were it the manifestation of a top-down multiphase condensation cascade, wherein both the warm ionized and cold molecular nebulae are pools of cooling gas clouds that rain from the ambient hot halo. The disruption of this halo into a multiphase medium is regulated by the survivability of thermal instabilities, which lose entropy over a cooling time tcool, descend on a free-fall time tff, and remain long lived only if their local density contrast increases as they sink (e.g., Voit et al. 2017). This implies that there is an entropy threshold for the onset of nebular emission in BCGs, long known to exist observationally (Cavagnolo et al. 2008; Rafferty et al. 2008), set wherever the cooling time becomes short compared to the effective gas dynamical timescale. This underlying principle is not new (e.g., Hoyle 1953; Binney 1977; Rees & Ostriker 1977; Cowie et al. 1980; Nulsen 1986; Balbus & Soker 1989), but has found renewed importance in light of recent papers arguing that it may be fundamental to all of galaxy evolution (Pizzolato & Soker 2005, 2010; Marinacci et al. 2010; Gaspari et al. 2012, 2013, 2015, 2017, 2018; McCourt et al. 2012; Sharma et al. 2012; Li et al. 2015; Prasad et al. 2015, 2017, 2018; Singh & Sharma 2015; Voit et al. 2015a, 2015b, 2015c, 2017, 2018; Voit & Donahue 2015; McNamara et al. 2016; Yang & Reynolds 2016; Hogan et al. 2017; Main et al. 2017; Meece et al. 2017; Pulido et al. 2018).
Amid minor disagreement over the importance of the free-fall time, (compare, e.g., Voit et al. 2015a; McNamara et al. 2016 and Gaspari et al. 2017), these works suggest that the existence of this threshold establishes a stochastically oscillating but tightly self-regulated feedback loop between ICM cooling and active galactic nucleus (AGN) heating. The entire process would be mediated by chaotic cold accretion (CCA) onto the central supermassive black hole (Gaspari et al. 2013), a prediction that has recently found observational support with the detection of cold clouds falling toward black hole fuel reservoirs (e.g., Tremblay et al. 2016; A. C. Edge et al. 2018, in preparation). The radio jets that the black hole launches, and the buoyant hot bubbles it inflates, inject sound waves, shocks, and turbulence into the X-ray-bright halo, lowering the cooling rate and acting as a thermostat for the heating−cooling feedback loop (e.g., Bîrzan et al. 2004, 2012; Hlavacek-Larrondo et al. 2012, 2015; Zhuravleva et al. 2014; Gaspari & Sádowski 2017). Those same outflows can adiabatically uplift low-entropy gas to an altitude that crosses the thermal instability threshold, explaining their close spatial association with molecular filaments and star formation (Tremblay et al. 2015; Russell et al. 2017b). In this scenario, a supermassive black hole acts much like a mechanical pump in a water fountain29 (e.g., Salomé et al. 2006; Lim et al. 2008; Salomé et al. 2011), wherein cold gas drains into the black hole accretion reservoir, powering jets, cavity inflation, and therefore a plume of low-entropy gas that is uplifted as the jets rise. The velocity of this cold plume is often well below both the escape speed from the galaxy and the Kepler speed at any given radius (e.g., McNamara et al. 2016), and so those clouds that do not evaporate or form stars should then rain back toward the galaxy center from which they were lifted. This, along with merger-induced gas motions (Lau et al. 2017) and the feedback-regulated precipitation of thermal instabilities from the hot atmosphere, keeps the fountain long lived and oscillatory. The apparently violent and bursty cluster core must nevertheless be the engine of a process that is smooth over long timescales, as the remarkably fine-tuned thermostatic control of the heating−cooling feedback loop now appears to persist across at least 10 billion years of cosmic time (e.g., Bîrzan et al. 2004, 2008; Best et al. 2006, 2007; Dunn & Fabian 2006; Rafferty et al. 2006; Mittal et al. 2009; Dong et al. 2010; Hlavacek-Larrondo et al. 2012, 2015; McDonald et al. 2013, 2016, 2017, 2018; Simpson et al. 2013; Webb et al. 2015; Bonaventura et al. 2017).
These hypotheses are testable. Whether it is called "CCA" (Gaspari et al. 2013), "precipitation" (Voit et al. 2015a), or "stimulated feedback" (McNamara et al. 2016), the threshold criterion predicts that the kinematics of the hot, warm, and cold phases of the ISM should retain memory of their shared journey along what is ultimately the same thermodynamic pathway (Gaspari et al. 2018). Observational tests for the onset of nebular emission, star formation, and AGN activity, and how these may be coupled to this threshold, have been underway for many years (e.g., Cavagnolo et al. 2008; Rafferty et al. 2008; Sanderson et al. 2009; Tremblay et al. 2012b, 2014, 2015; McNamara et al. 2016; Hogan et al. 2017; Main et al. 2017; Pulido et al. 2018; Voit et al. 2018). The multiphase uplift hypothesis, motivated by theory and simulations (Pope et al. 2010; Gaspari et al. 2012; Wagner et al. 2012; Li & Bryan 2014a, 2014b; Li et al. 2015), is corroborated by observations of kiloparsec-scale metal-enriched outflows along the radio axis (e.g., Simionescu et al. 2009; Kirkpatrick et al. 2011), and an increasing number of ionized and molecular filaments spatially associated with jets or cavities (e.g., Salomé et al. 2008; McNamara et al. 2014; Tremblay et al. 2015; Vantyghem et al. 2016; Russell et al. 2017b).
More complete tests of these supposed kiloparsec-scale molecular fountains will require mapping the kinematics of all gas phases in galaxies. As we await a replacement for the Hitomi mission to reveal the velocity structure of the hot phase (Hitomi Collaboration et al. 2016, 2018; Fabian et al. 2017), combined ALMA and optical integral field unit (IFU) spectrograph observations of cool core BCGs can at least begin to further our joint understanding of the cold molecular and warm ionized gas motions, respectively. To that end, in this paper we present new ALMA observations that map the kinematics of cold gas in the Abell 2597 BCG. We compare these with new Multi-Unit Spectroscopic Explorer (MUSE; Bacon et al. 2010) IFU data that do the same for the warm ionized phase, as well as a new deep Chandra X-ray image revealing what is likely filament uplift by A2597's buoyant hot bubbles. These data are described in Section 2, presented in Section 3, and discussed in Section 4. Throughout this paper, we assume H0 = 70 km s−1 Mpc−1, ΩM = 0.27, and ΩΛ =0.73. In this cosmology, 1'' corresponds to 1.549 kpc at the redshift of the A2597 BCG (z = 0.0821), where the associated luminosity and angular size distances are 374.0 and 319.4 Mpc, respectively, and the age of the universe is 12.78 Gyr. Unless otherwise noted, all images are centered on the nucleus of the A2597 BCG at right ascension (R.A.) 23h 25m 19 7 and declination −12° 07' 27'' (J2000), with east left and north up.
2. Observations and Data Reduction
This paper synthesizes a number of new and archival observations of the A2597 BCG, all of which are summarized in Table 1. Here we primarily describe the new ALMA and MUSE data sets that comprise the bulk of our analysis. All Python codes/Jupyter Notebooks we have created to enable this analysis are publicly available in an online repository30 (Tremblay 2018).
Table 1. Summary of Abell 2597 Observations
| Waveband/Line | Facility | Instrument/Mode | Exp. Time | Prog./Obs. ID (Date) | Reference |
|---|---|---|---|---|---|
| (1) | (2) | (3) | (4) | (5) | (6) |
| X-ray (0.2–10 keV) | Chandra | ACIS-S | 39.80 ks | 922 (2000 Jul 28) | McNamara et al. (2001), Clarke et al. (2005) |
| ⋯ | ⋯ | ⋯ | 52.20 ks | 6934 (2006 May 1) | Tremblay et al. (2012a, 2012b) |
| ⋯ | ⋯ | ⋯ | 60.10 ks | 7329 (2006 May 4) | Tremblay et al. (2012a, 2012b) |
| ⋯ | ⋯ | ⋯ | 69.39 ks | 19596 (2017 Oct 8) | G. R. Tremblay et al. (2018, in preparation) |
| ⋯ | ⋯ | ⋯ | 44.52 ks | 19597 (2017 Oct 16) | (Large Program 18800649) |
| ⋯ | ⋯ | ⋯ | 14.34 ks | 19598 (2017 Aug 15) | ⋯ |
| ⋯ | ⋯ | ⋯ | 24.73 ks | 20626 (2017 Aug 15) | ⋯ |
| ⋯ | ⋯ | ⋯ | 20.85 ks | 20627 (2017 Aug 17) | ⋯ |
| ⋯ | ⋯ | ⋯ | 10.92 ks | 20628 (2017 Aug 19) | ⋯ |
| ⋯ | ⋯ | ⋯ | 56.36 ks | 20629 (2017 Oct 3) | ⋯ |
| ⋯ | ⋯ | ⋯ | 53.40 ks | 20805 (2017 Oct 5) | ⋯ |
| ⋯ | ⋯ | ⋯ | 37.62 ks | 20806 (2017 Oct 7) | ⋯ |
| ⋯ | ⋯ | ⋯ | 79.85 ks | 20811 (2017 Oct 21) | ⋯ |
| ⋯ | ⋯ | ⋯ | 62.29 ks | 20817 (2017 Oct 19) | ⋯ |
| Lyα λ1216 Å | HST | STIS F25SRF2 | 1000 s | 8107 (2000 Jul 27) | O'Dea et al. (2004), Tremblay et al. (2015) |
| FUV Continuum | ⋯ | ACS/SBC F150LP | 8141 s | 11131 (2008 Jul 21) | Oonk et al. (2010), Tremblay et al. (2015) |
| [O ii]λ3727 Å | ⋯ | WFPC2 F410M | 2200 s | 6717 (1996 Jul 27) | Koekemoer et al. (1999) |
| B-band and [O ii]λ3727 Å | ⋯ | WFPC2 F450W | 2100 s | 6228 (1995 May 07) | Koekemoer et al. (1999) |
| R-band and Hα+[N ii] | ⋯ | WFPC2 F702W | 2100 s | 6228 (1995 May 07) | Holtzman et al. (1996) |
| H2 1−0 S(3) λ1.9576 μm | ⋯ | NICMOS F212N | 12032 s | 7457 (1997 Oct 19) | Donahue et al. (2000) |
| H-band | ⋯ | NICMOS F160W | 384 s | 7457 (1997 Dec 03) | Donahue et al. (2000) |
| Hα (Narrowband) | Baade 6.5 m | IMACS/MMTF | 1200 s | (2010 Nov 30) | McDonald et al. (2012, 2011) |
| i-band | VLT/UT1 | FORS | 330 s | 67.A-0597(A) | Oonk et al. (2011) |
| Optical Lines and Continuum | VLT/UT4 | MUSE | 2700 s | 094.A-0859(A) | S. L. Hamer et al. (2018, in preparation) |
| NIR (3.6, 4.5, 5.8, 8 μm) | Spitzer | IRAC | 3600 s (each) | 3506 (2005 Nov 24) | Donahue et al. (2007) |
| MIR (24, 70, 160 μm) | ⋯ | MIPS | 2160 s (each) | 3506 (2005 Jun 18) | Donahue et al. (2007) |
| MIR (70, 100, 160 μm) | Herschel | PACS | 722 s (each) | 13421871(18-20) | Edge et al. (2010b) |
| FIR (250, 350, 500 μm) | ⋯ | SPIRE | 3336 s (each) | (2009 Nov 30) | Edge et al. (2010b) |
| CO(2–1) | ALMA | Band 6/213 GHz | 3 hr | 2012.1.00988.S | Tremblay et al. (2016) & this paper |
| Radio (8.44 GHz) | VLA | A array | 15 min | AR279 (1992 Nov 30) | Sarazin et al. (1995) |
| 4.99 GHz | ⋯ | A array | 95 min | BT024 (1996 Dec 7) | Taylor et al. (1999); Clarke et al. (2005) |
| 1.3 GHz | ⋯ | A array | 323 min | BT024 (1996 Dec 7) | Taylor et al. (1999); Clarke et al. (2005) |
| 330 MHz | ⋯ | A array | 180 min | AC647 (2003 Aug 18) | Clarke et al. (2005) |
| 330 MHz | ⋯ | B array | 138 min | AC647 (2003 Jun 10) | Clarke et al. (2005) |
Note. A summary of all Abell 2597 observations used (either directly or indirectly) in this analysis, in descending order from short to long wavelengths (i.e., from X-ray through radio). (1) Waveband or emission line targeted by the listed observation; (2) telescope used; (3) instrument, receiver setup, or array configuration used; (4) on-source integration time; (5) facility-specific program or proposal ID (or observation ID in the case of Chandra) associated with the listed data set; (6) reference to publication(s) where the listed data first appeared or were otherwise discussed in detail. Further details for most of these observations, including Principal Investigators, can be found in Table 1 of Tremblay et al. (2012b).
Download table as: ASCIITypeset image
2.1. ALMA CO(2–1) Observations
ALMA observed the Abell 2597 BCG for three hours across three scheduling blocks executed between 2013 November 17–19 as part of Cycle 1 program 2012.1.00988.S (P.I.: Tremblay). One baseband was centered on the J = 2–1 rotational line transition of carbon monoxide (12CO) at 213.04685 GHz (rest frame 230.538001 GHz at z = 0.0821). CO(2–1) serves as a bright tracer for the otherwise unobservable cold molecular hydrogen gas (H2) fueling star formation throughout the galaxy (H2 at a few tens of Kelvin is invisible because it lacks a permanent electric dipole moment). The other three basebands sampled the local rest-frame ∼230 GHz continuum at 215.0, 227.7, and 229.7 GHz, enabling continuum subtraction for the CO(2–1) data and an (ultimately unsuccessful) ancillary search for radio recombination lines.
The ALMA correlator was set to Frequency Division Mode, delivering a native spectral (velocity) resolution of 0.488 MHz (∼1.3 km s−1) across an 1875 MHz bandwidth per baseband. Baselines between the array's 29 operational 12 m antenna spanned 17–1284 m, delivering a best possible angular resolution at 213 GHz of 0 37 within a ∼28'' primary beam, easily encompassing the entire galaxy in a single pointing. In comparing the total recovered ALMA CO(2–1) flux with an older single-dish IRAM 30 m observation (Tremblay et al. 2012b), we find no evidence that any extended emission has been "resolved out" by the interferometer.
Observations of A2597 were bracketed by slews to Neptune as well as the quasars J2258–2758 and J2331–1556, enabling amplitude, flux, and phase calibration. Raw visibilities were imported, flagged, and reduced into calibrated measurement sets using CASA version 4.2 (McMullin et al. 2007). In addition to applying the standard phase calibrator solution, we iteratively performed phase-only self-calibration using the galaxy's own continuum, yielding a 14% improvement in rms noise. We used the UVCONTSUB task to fit and subtract the continuum from the CO(2–1) spectral window in the uv plane. We then deconvolved and imaged the continuum-free CO(2–1) measurement set using the CLEAN algorithm with natural weighting, improving sensitivity to the filamentary outskirts of the nebula.31
The final datacube reaches an rms sensitivity and angular resolution of 0.16 mJy beam−1 per 40 km s−1 channel with a 0715 × 0533 synthesized beam at P.A. = 74°, enabling us to resolve molecular gas down to physical scales of ∼800 pc. As indicated in the figure captions, some ALMA images presented in this paper use Gaussian-weighted uv tapering of the outer baselines in order to maximize sensitivity to the most extended structures, expanding the synthesized beam to a size of 0944 × 0764 at a P.A. of 86°. The captions also note whether we have binned the data (in the uv plane) to 5, 10, or 40 km s−1 channels, as dictated by sensitivity needs for a given science question. All CO(2–1) fluxes and line widths reported in this paper are corrected for response of the primary beam (pbcor = True).
We have also created an image of the rest-frame 230 GHz continuum point source associated with the AGN by summing the emission in the three line-free basebands. The CLEAN algorithm was set to use natural weighting and yielded a continuum map with a synthesized beam of 0935 × 0747 at a P.A. of 87°. The peak (and therefore total) flux measured from the continuum point source is 13.6 ± 0.2 mJy at 221.3 GHz, detected at 425σ over the background rms noise. It was against this continuum "backlight" that Tremblay et al. (2016) discovered infalling cold molecular clouds seen in absorption (see Section 3.1). We note that the continuum also features ∼3σ extended emission. If one includes this in the flux measurement, it rises to 14.6 ± 0.2 mJy.
This paper also presents CO(2–1) line-of-sight velocity and velocity dispersion maps made from the ALMA data using the "masked moment" technique described by Dame (2011) and implemented by Timothy Davis.32 The technique takes into account spatial and spectral coherence in position–velocity space by first smoothing the clean datacube with a Gaussian kernel whose FWHM is equal to that of the synthesized beam. The velocity axis is then also smoothed with a Gaussian, enabling creation of a three-dimensional mask that selects all pixels above a 1.5σ flux threshold. Zeroth, first, and second moment maps of the integrated intensity, flux-weighted mean velocity, and velocity dispersion (respectively) were created using this mask on the original (unsmoothed) cube, recovering as much flux as possible while suppressing noise. As we will discuss in Section 3.4, the inner ∼10 kpc of the galaxy contains molecular gas arranged in two superposed (blue- and redshifted) velocity structures. We have therefore also created CO(2–1) velocity and velocity dispersion maps that fit two Gaussians along the same lines of sight. The codes used to accomplish this are included in the software repository that accompanies this paper (Tremblay 2018).
2.2. MUSE Optical Integral Field Spectroscopy
We also present new spatial and spectral mapping of optical stellar continuum and nebular emission lines in the A2597 BCG using an observation from MUSE (Bacon et al. 2010). MUSE is a high-throughput, wide field-of-view (FoV), image-slicing IFU spectrograph mounted at UT4's Nasmyth B focus on the Very Large Telescope (VLT). Obtained as part of ESO programme 094.A-0859(A) (PI: Hamer), this observation was carried out in MUSE's seeing-limited WFM-NOAO-N configuration on the night of 2014 October 11. While the ∼1' × 1' FoV of MUSE easily covered the entire galaxy in a single pointing, a three-point dither was used over a 3 × 900 (2700) s integration time in order to reduce systematics. Throughout the observation, the source was at a mean airmass of 1.026 with an average V-band (DIMM) seeing of ∼12.
The raw data were reduced using version 1.6.4 of the standard MUSE pipeline (Weilbacher et al. 2014), automating bias subtraction, wavelength and flux calibration, as well as illumination, flat-field, and differential atmospheric diffraction corrections. In addition to the sky subtraction automated by the pipeline, which uses a model created from a "blank sky" region of the FoV, we have performed an additional sky subtraction using a Principal Component Analysis code by Bernd Husemann and the Close AGN Reference Survey33 (CARS; Husemann et al. 2016, 2017). We have also corrected the datacube for Galactic foreground extinction using AV = 0.082, estimated from the Schlafly & Finkbeiner (2011) recalibration of the Schlegel et al. (1998) IRAS+COBE Milky Way dust map assuming RV = 3.1.
The final MUSE datacube maps the entire galaxy between 4750 Å < λ < 9300 Å with a spectral resolution of ∼2.5 Å. The FWHM of its seeing-limited point-spread function (PSF), sampled with 02 pixels, is 10 and 08 on the bluest and reddest ends of the spectral axis, respectively. This is close to the spatial resolution of our ALMA CO(2–1) map, enabling comparison of the kinematics and morphology of the warm ionized and cold molecular gas phases on nearly matching spatial scales.
In pursuit of that goal, we have created a number of higher level MUSE data products by decoupling and modeling the stellar and nebular components of the galaxy with PyParadise, also used by the CARS team as part of their custom MUSE analysis tools (Walcher et al. 2015; Husemann et al. 2016; Weaver et al. 2018). PyParadise iteratively performs non-negative linear least-squares fitting of stellar population synthesis templates to the stellar spectrum of every relevant spectral pixel ("spaxel") in the MUSE cube, while independently finding the best-fit line-of-sight velocity distribution with a Markov Chain Monte Carlo method. The best-fit stellar spectrum is then subtracted from each spaxel, yielding residuals that contain nebular emission lines. These are fit with a linked chain of Gaussians that share a common radial velocity, velocity dispersion, and priors on expected emission line ratios (e.g., the line ratios of the [O iii] and [N ii] doublets are fixed to 1:3). Uncertainties on all best-fit stellar and nebular parameters are then estimated using a Monte Carlo bootstrap approach wherein both continuum and emission lines are refit 100 times as the spectrum is randomly modulated within the error of each spaxel.
While the nebular emission lines in the A2597 MUSE observation were bright enough to be fit at the native (seeing-limited) spatial resolution, the signal-to-noise ratio (S/N) of the stellar continuum was low enough to necessitate spatial binning. We have applied the Voronoi tesselation technique using a Python code kindly provided34 by Michele Cappellari (Cappellari & Copin 2003). The MUSE cube was tessellated to achieve a minimum S/N of 20 (per bin) in the line-free stellar continuum.
The products from PyParadise then enabled the creation of spatially resolved flux, velocity, and velocity dispersion maps of those emission lines most relevant to our study, namely Hα, [O i] λ6300 Å, [O iii] λ5007 Å, and Hβ, along with Voronoi-binned velocity and FWHM maps for the galaxy's stellar component. We have also created Balmer decrement (Hα/Hβ ratio), color excess (E(B − V)), and optical extinction (AV) maps by dividing the Hα and Hβ maps and scaling the result by following Equation (1) in Tremblay et al. (2010). Finally, we show an electron density map made by scaling the ratio of forbidden sulfur lines (i.e., [S ii]λλ 6717 Å/6732 Å; Osterbrock & Ferland 2006) using the calibration of Proxauf et al. 2014 (see their Equation (3)) and assuming an electron temperature of Te = 104 K. We repeated this process to make Balmer decrement and electron density maps from a cube whose spaxels were binned 4 × 4, increasing the signal in the fainter lines. Comparing these maps to their unbinned counterparts revealed no quantitative difference. We therefore only show the unbinned, higher spatial resolution maps in this paper.
2.3. ALMA and MUSE Line Ratio Maps
We have also created Hα/CO(2–1) flux, velocity, and velocity dispersion ratio maps by dividing the ALMA "masked moment" maps from the corresponding MUSE maps. To accomplish this, we made small WCS shifts in the MUSE maps to match the ALMA CO(2–1) image with the PyRAF imshift and wcscopy tasks, assuming that the CO(2–1) and Hα photocentroids in the galaxy center as well as a bright, clearly detected (≳10σ) "blob" of emission to the northwest in both data sets are aligned. The needed shifts were minor, and applying them also aligned enough morphologically matching features that we are confident that the alignment is "correct," at least to an uncertainty that is smaller than the PSF of either observation. We then confirmed that the ALMA synthesized beam closely matched the MUSE PSF at Hα (7101 Å and 6563 Å in the observed and rest frames, respectively), making smoothing unnecessary. We then resampled the ALMA data onto the MUSE maps' pixel grids in Python using reproject, an Astropy affiliated package.35 Depending on the science application, the reprojected ALMA image was then either divided directly from the MUSE map or divided after normalization or rescaling by some other factor (for example, to convert pixel units). The Python code used to create these maps, along with all MUSE and ALMA data products, is included in this paper's software repository (Tremblay 2018).
2.4. Adoption of a Systemic Velocity
All ALMA and MUSE velocity maps shown in this paper are projected about a zero point that is set to the stellar systemic velocity of the A2597 BCG at z = 0.0821 ± 0.0001 (cz = 24,613 ± 29 km s−1). As discussed in the Methods section of Tremblay et al. (2016), this velocity is consistent with Ca ii h + k and G-band absorption features tracing the galaxy's stellar component, a cross-correlation of galaxy template spectra with all major optical emission and absorption lines in the galaxy (Voit & Donahue 1997; Koekemoer et al. 1999; Taylor et al. 1999), an H i absorption feature (O'Dea et al. 1994), and the ALMA CO(2–1) emission line peak itself (Tremblay et al. 2016). It is, therefore, the best-known systemic velocity for the system, within ∼60 km s−1.
2.5. Deep Chandra X-Ray Data
Finally, we have combined all available Chandra X-ray Observatory data for A2597, spanning 626.37 ks in total integration time across 14 separate ACIS-S observations. The oldest three of these (see Table 1) were previously published (ObsID 922, PI: McNamara and ObsIDs 6934 and 7329, PI: Clarke; McNamara et al. 2001; Clarke et al. 2005; Tremblay et al. 2012a, 2012b), while the latest 11 were recently observed as part of Cycle 18 Large Program 18800649 (PI: Tremblay). This new data set will be analyzed in detail by G. R. Tremblay et al. (2018, in preparation). Here, we show only the deep image for the purposes of comparing it with the ALMA and MUSE data.
To create this deep image, all 14 ACIS-S observations were (re)-reduced, merged, and exposure-corrected using ciao version 4.9 (Fruscione et al. 2006) with version 4.7.5.1 of the Calibration Database. All exposures centered the cluster core (and therefore the BCG) on the nominal aimpoint of the back-illuminated S3 chip. We have applied a radially varying gradient filter to the final merged Chandra image using a Gaussian Gradient Magnitude (GGM) technique recently implemented by Sanders et al. (2016a, 2016b) and Walker et al. (2017) to highlight surface brightness edges in Chandra data. The codes we used to accomplish this have been kindly provided by Jeremy Sanders and are publicly available.36
3. Results
3.1. "Shadows" Cast by Inflowing Cold Clouds
The ALMA observation is dominated by a bright continuum point source, shown in Figure 2. Its flux at 221.3 GHz is 13.6 ± 0.2 mJy, which we show as part of a radio-through-optical SED in Figure 3. The green line shows a single power-law fit to the radio and ALMA data points with a spectral index of α = 0.95 ± 0.03 if S ∝ ν−α, where S is the flux density and ν is the frequency. The surrounding gray region shows the error on that fit and entirely encompasses the two-component radio-only fit by Hogan et al. (2015a). That model is shown in blue dashed and red dashed–dotted lines and includes, respectively, a power law with spectral index α = 1.18 ± 0.06 and a likely highly variable, flatter, GPS-like core (see the discussion in Hogan et al. 2015a, 2015b). Some curvature in the radio spectrum is evident, though it may be partly artificial as these data points were collected over the course of more than 20 years, during which time the source likely varied in brightness. Regardless, within errors, the new ALMA data point is consistent with both the single power-law and two-component models, and so it is likely that the 230 GHz continuum source detected by ALMA is simply the millimeter tail of the synchrotron continuum entirely associated with the AGN.

Figure 2. The ALMA 230 GHz continuum signal, summed over three basebands redward of the CO(2–1) line. The map is dominated by a millimeter synchrotron continuum point source associated with the AGN at the galaxy center, with a flux density of 13.6 ± 0.2 mJy. Contours marking the 8.4 GHz VLA observation of the compact steep spectrum radio source are overlaid in red. The 10σ contour is consistent with an unresolved point source. A log stretch has been applied to the data so as to best show the 3σ extended emission against the ≳400σ point source. Much of this extended emission is likely to be noise, though the extension to the south along the 8.4 GHz radio source may be real. We are unlikely to have detected any extended dust continuum emission, given the far-infrared fluxes shown in Figure 3.
Download figure:
Standard image High-resolution image
Figure 3. Radio-through-optical SED for Abell 2597, including the new ALMA millimeter continuum point. Dashed and solid lines show various fits to components of the spectrum including a one- and two-component fit to the radio and ALMA data (Hogan et al. 2015a, 2015b), as well as a modified blackbody fit to the far-infrared Herschel data (Mittal et al. 2011, 2012). Observation details (including dates) and references for all photometric points are given in Table 1. Error bars are shown on the plot, though in many cases they remain invisible because they are smaller than the data point. The gray shaded region shows the error on the single power-law fit to both the radio and ALMA continuum data. These fits are discussed in Section 3.1.
Download figure:
Standard image High-resolution imageThis continuum source acts as a bright backlight cast by the radio jet's launch site, in close proximity to the ∼3 × 10⁸ M⊙ black hole in the galaxy center (Tremblay et al. 2012b). Against this backlight we found three deep, narrow continuum absorption features (Figure 4), which we discuss in Tremblay et al. (2016). We suggest that these are "shadows" cast by inflowing cold molecular clouds eclipsing our line of sight to the black hole. Assuming they are in virial equilibrium, we calculate that the clouds, whose line widths are not more than σv ≲ 6 km s−1, must have sizes no greater than ∼40 pc and masses on the order of ∼105–106 M⊙, similar to giant molecular clouds in the Milky Way (e.g., Larson 1981; Solomon et al. 1987). If they are in pressure equilibrium with their ambient multiphase environment, their column densities must be on the order of cm−2. A simple argument based on geometry and probability, along with corroborating evidence from the Very Long Baseline Array, suggests that these inflowing cold molecular clouds are within ∼100 pc of the black hole and falling ever closer toward it (Tremblay et al. 2016). These clouds may therefore provide a substantial cold molecular mass flux to the black hole accretion reservoir, contrary to what might be expected in a "hot mode" Bondi-like accretion scenario. Regardless, these results establish that some cold molecular gas is clearly moving inward toward the galaxy center. The remainder of this paper connects this inflowing gas to the larger galaxy of which it is a part.


Figure 4. A summary of the primary result from Tremblay et al. (2016), showing three compact (≲40 pc) molecular clouds moving deeper into the galaxy and toward its nucleus at ∼+300 km s−1. The clouds are likely in close proximity (within ∼100 pc) to the central supermassive black hole and therefore may play a direct role in fueling the black hole's accretion reservoir. (Left) A slice through the continuum-subtracted ALMA CO(2–1) datacube, 10 km s−1 in width and centered on +240 km s−1 relative to the galaxy's systemic velocity. A region of "negative emission," arising from continuum absorption, appears as a dark spot the size of the ALMA beam, whose 0715 × 0533 (∼1 kpc × ∼0.8 kpc) size is indicated by the white ellipse in the bottom-left corner. 8.4 GHz radio contours are shown in red. The innermost contours of the radio core associated with the AGN have been removed to aid viewing of the ALMA continuum absorption feature. Extracting the CO(2–1) spectrum from a region bounding the galaxy's nucleus (roughly marked by the dashed white box) reveals the spectrum in the rightmost panel (adapted from Tremblay et al. 2016).
Download figure:
Standard image High-resolution image3.2. Morphology of the Cold Molecular Nebula
The continuum-subtracted ALMA CO(2–1) data reveal a filamentary molecular nebula whose largest angular extent spans the inner 30 kpc (20'') of the galaxy (Figure 5(a)). The brightest CO(2–1) emission is cospatial with the galaxy nucleus, forming a "V" shape with an axis of symmetry that is roughly aligned with the galaxy's stellar minor axis. In projection, a 12 kpc (8'') linear filament appears to connect with the southeastern edge of the "V" and arcs southward. Fainter clumps and filaments, many of which are part of a smoother distribution of gas just below the ≥3σ clipping threshold shown in Figure 5(a), are found just to the north of the "V."

Figure 5. An overview of the morphological and spectral characteristics of the ALMA CO(2–1) observation we discuss at length in this paper. The central panel (a) shows a clipped moment zero (flux) image of all ≥3σ CO(2–1) emission in the A2597 BCG. The various clumps seen likely represent ≳3σ peaks of a smoother, fainter distribution of gas below the sensitivity threshold (although some clumps may indeed be discrete). For reference, the outer contour of the Hα nebula is shown with a solid gray contour. Various apertures are shown in black polygons, indicating the (rough) spectral extraction regions for the CO(2–1) line profiles shown in the surrounding panels. All data are binned to 10 km s−1 channels. (b) The CO(2–1) line profile from a region cospatial with the ∼10 kpc scale CSS radio source (red contours on panel (a)). (c) An extraction from the nucleus of the galaxy, cospatial with the millimeter and radio core, as well as the stellar isophotal centroid. The deep absorption features are discussed in Section 3.1 and Tremblay et al. (2016). (d) All detected emission across the entire nebula. It is from this spectrum that we estimate the total gas mass in Section 3.3. Panels (e) and (f) show the spectra extracted from what we call the southern and northern filaments, respectively.
Download figure:
Standard image High-resolution imageThis cold molecular nebula is forming stars across its entire detected extent, at an integrated rate of ∼5 M⊙ yr −1 as measured with a number of observations, including Herschel photometry (Edge et al. 2010a, 2010b; Tremblay et al. 2012b). We have smoothed the HST/ACS SBC far-ultraviolet (FUV) continuum map from Oonk et al. (2011) with a Gaussian whose FWHM matches that of the synthesized beam in our ALMA map of integrated CO(2–1) intensity, normalized their surface brightness peaks, and then divided one map by the other. The quotient map is close to unity across the nebula, indicating that the star formation rate surface density (even as traced by extinction-sensitive FUV continuum) is proportional to the underlying CO(2–1) surface brightness.37
Where they overlap, the MUSE/ALMA Hα-to-CO(2–1) surface brightness ratio map is similarly smooth (see Section 3.6). Matching Hα and CO(2–1) morphology is consistent with the hypothesis that the optical and millimeter emission arises from the same population of clouds, as we will discuss in Sections 3.5 and 4. In Figure 5(a), we show the CO(2–1) emission bounded by a gray contour that marks the outer extent of the Hα emission. That the molecular nebula appears smaller in angular extent than the warm ionized nebula is more likely due to a sensitivity floor than a true absence of cold gas at larger radii. The ALMA observations do reveal faint, smooth emission in the northern and southern locales of the warm ionized filaments, though much of it is simply below the threshold we apply to all CO(2–1) maps presented in this paper. That we have detected at least some faint molecular emission in the outer extents of the warm nebula suggests that, were we to observe to greater depths with ALMA, we might detect CO(2–1) across its entire extent. This is not guaranteed, as warm ionized gas can be present without cold molecular gas (e.g., Simionescu et al. 2018). We do note that most ALMA observations of CC BCGs published thus far generally show molecular filaments cospatial with warm ionized counterparts (McNamara et al. 2014; Russell et al. 2014, 2016, 2017a, 2017b; Vantyghem et al. 2016). This has been known long prior to the first ALMA observations, too (see, e.g., the single-dish observations of the Perseus filaments by Lim et al. 2008; Salomé et al. 2011).
3.3. Total Mass and Mass Distribution of the Molecular Gas
Assuming a CO(2–1) to CO(1–0) flux density ratio of 3.2 (Braine & Combes 1992), we can estimate the total mass of molecular H2 in the nebula following the relation reviewed by Bolatto et al. (2013):

where SCOΔv is the integrated CO(2–1) intensity, z is the galaxy redshift (z = 0.0821), and DL its luminosity distance (374 Mpc in our adopted cosmology). The dominant source of uncertainty in this estimate is the CO-to-H2 conversion factor XCO (see, e.g., Bolatto et al. 2013). Here we adopt the average value for the disk of the Milky Way of XCO = XCO,MW = 2 × 1020 cm−1 (K km s−1)−1. There is a ∼30% scatter about this value (Solomon et al. 1987), minor in comparison to the overriding uncertainty as to the appropriateness of assuming that the A2597 BCG is at all like the Milky Way. The true value of the conversion factor depends on gas metallicity and whether or not the CO emission is optically thick. The metal abundance of the hot X-ray plasma is ∼0.5–0.8 solar in the inner ∼50 kpc of the A2597 BCG (Tremblay et al. 2012a), and the velocity dispersions of individual molecular clouds in the galaxy are similar to those in the Milky Way (Tremblay et al. 2016). Echoing arguments made for the A1835, A1664, and A1795 BCGs in McNamara et al. (2014), Russell et al. (2014), and Russell et al. (2017b), respectively, we have no evidence to suggest that the "true" XCO in A2597 should be wildly different from the Milky Way, as it can often be in ULIRGs (Bolatto et al. 2013). Indeed, Vantyghem et al. (2017) report one of the first detections of 13CO(3–2) in a BCG (RX J0821+0752), and in doing so find a CO-to-H2 conversion factor that is only a factor of 2 lower than that for the Milky Way. Adopting XCO,MW is therefore likely to be the most reasonable choice, with the caveat that we may be overestimating the total mass by a factor of a few. This should be taken as the overriding uncertainty on all mass estimates quoted in this paper.
We fit a single Gaussian to the CO(2–1) spectrum extracted from a polygonal aperture encompassing all ≥3σ emission in the primary-beam-corrected cube, binned to 10 km s−1 channels (this spectrum is shown in Figure 5(d)). This gives an emission integral of SCOΔv = 7.8 ± 0.3 Jy km s−1 with a line FWHM of 252 ± 16 km s−1, which, noting the caveats discussed above, converts to an H2 gas mass of M⊙. Within errors, we obtain the same integral for cubes binned to 20 or 40 km s−1, and an identical flux with an analytic integral of the line (e.g., adding all ≥3σ flux in the cube, rather than fitting a Gaussian). This mass estimate is a factor of ∼1.8 higher than that in Tremblay et al. (2016) because their Gaussian was fit from −500 to +500 km s−1, while ours is fit between −600 and +600 km s−1. This apparently minor difference gives rise to a significant offset because the former fit misses real emission blueward and redward of the line, biasing the continuum zero point upward. Tremblay et al. (2016) therefore slightly underestimate the total flux, though not to a degree that affects any of the results reported in that work.

Indeed, factor of 2 variations in the total mass estimate do not significantly impact the conclusions drawn in either paper, especially considering the larger uncertainty coupled to our assumption for XCO and the CO(2–1) to CO(1–0) flux density ratio. It is sufficient for our purposes to say that the total cold molecular gas mass in the A2597 BCG is a few billion solar masses. Given the critical density of CO(2–1), any reasonable assumption for the three-dimensional volume of the nebula, and the total amount of cold gas available to fill it, the volume filling factor of the cold molecular clouds cannot be more than a few percent (Tremblay et al. 2016; see also David et al. 2014; Anderson & Sunyaev 2017; Temi et al. 2018). Far from a monolithic slab, the cold gas is instead more like a "mist" of many smaller individual clouds and filaments seen in projection (e.g., Jaffe et al. 2001, 2005; Wilman et al. 2006; Emonts et al. 2013; McCourt et al. 2018).
A significant fraction of the total mass in this "mist" is found far from the galaxy's nucleus. In Figure 5, we divide the nebula into three primary components consisting of the bright nuclear region cospatial with the 8.4 GHz radio source (panel b), the northern filaments (panel f), and the southern filaments (panel e). Fitting the CO(2–1) spectra extracted from each of these components shows that their rough fractional contribution to the total gas mass (i.e., panel d) is ∼70%, ∼10%, and ∼20%, respectively. This means that although most (∼2.2 × 10⁹ M⊙) of the cold gas is found in the innermost ∼8 kpc of the galaxy, ∼1 billion M⊙ of it lies at distances greater than 10 kpc from the galactic center.
3.4. Velocity Structure of the Molecular Gas
In Figure 6, we show the "masked moment" maps of integrated CO(2–1) intensity, flux-weighted velocity, and velocity dispersion. The cold molecular nebula features complex velocity structure across its spatial extent, with gas found at projected line-of-sight velocities that span ≳300 km s−1, arranged roughly symmetrically about the systemic velocity of the galaxy. Aside from a possible ±100 km s−1 rotation (or "swirl") of gas near the nucleus (Figure 6(b); see the blue and redshifted components to the NW and SE of the radio core, respectively), most of the nebula appears removed from a state of dynamical equilibrium and poorly mixed (in phase space) with the galaxy's stars. Almost everywhere, projected line-of-sight velocities are below the circular speed at any given radius and well below the galaxy's escape velocity. The kinematics of the molecular nebula can therefore be considered rather slow, unless most gas motions are contained in the plane of the sky. This is unlikely, given several recent papers reporting similarly slow cold gas motions in CC BCGs (McNamara et al. 2014; Russell et al. 2014, 2016, 2017a, 2017b; Vantyghem et al. 2016). The overall picture for A2597, then, is that of a slow, churning "mist" of cold gas, drifting in the turbulent velocity field of the hot atmosphere, with complex inward and outward streaming motions. In the below sections, we will argue that these motions are largely induced by mechanical feedback from the central supermassive black hole, mediated either by the jets that it launches or the buoyant X-ray cavities that those jets inflate.

Figure 6. (a) Zeroth, first, and second moment maps of the integrated CO(2–1) intensity, mean velocity, and velocity dispersion (respectively) in the cold molecular nebula. The maps have been created from the ALMA cube using the "masked moment" technique to preserve the spatial and spectral coherence of the ≥3σ structures in position–velocity space, as described in Section 2.1. Panels (b) and (c) show a zoom-in on the nuclear region in the velocity and velocity dispersion maps, respectively. Take caution when interpreting these, because there are two velocity components (one approaching/blueshifted, the other receding/redshifted) superposed on one another. The velocity structure here is therefore best represented by a double-Gaussian fit, which we show in Figure 9.
Download figure:
Standard image High-resolution image3.4.1. Uplift of the Southern Filament
The velocity and velocity dispersion maps in Figure 6(a) (center and right) show a largely quiescent structure along the southern filament, with no monotonic or coherent gradient in either across its ∼12 kpc projected length. In Figure 7(a), we show a position–velocity (hereafter PV) diagram of emission extracted from a rectangular aperture around the filament. The structure is brightest at its northern terminus (i.e., the lefthand side of Figure 7(a)), which serves as the easternmost vertex of the bright central "V" feature around the galaxy nucleus. Southward from this bright knot, toward the righthand side of Figure 7(a), the filament is roughly constant in velocity centroid and width (+50–100 km s−1 and ∼80–100 km s−1, respectively). About 6'' (∼9 kpc) south of the northern terminus, however, the filament broadens in velocity dispersion. Here, near the filament's apex in galactocentric altitude, it features its largest observed line-of-sight velocity width (∼300 km s−1), with a centroid that is roughly the same as that along its entire length.
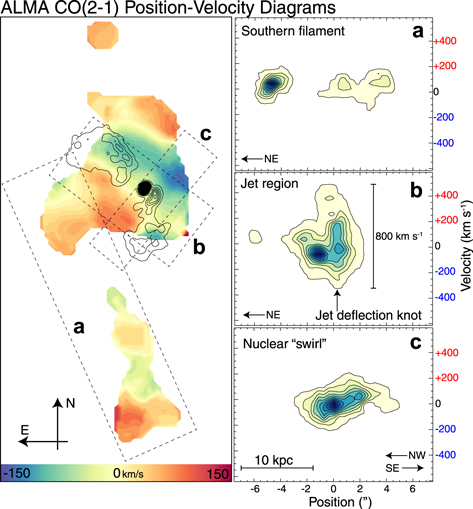
Figure 7. Position–velocity (PV) diagrams extracted from the three regions of the molecular nebula. The lefthand panel shows the moment one velocity map from Figure 6, with three PV extraction apertures overlaid. The righthand panels show the PV diagrams extracted from these apertures. Arrows are used to show the cardinal orientation of each aperture's long axis (the slit orientation for panel (c) is roughly perpendicular to that for panels (a) and (b), and so the relative orientations are admittedly confusing at first glance). Note that while the length of the extraction aperture varied, all diagrams are shown on the same spatial scale in the righthand panels, enabling cross-comparison. Panel (a) shows that the southern filament has a narrow velocity width across its entire length, and no coherent velocity gradient. Panel (b) reveals the broadest velocity distribution of molecular gas in the entire nebula and includes the region in which the 8.4 GHz radio source bends in position angle, likely because of deflection. Panel (c) shows the rotation of molecular gas about the nucleus. All emission shown is ≥3σ.
Download figure:
Standard image High-resolution imageThe southern filament's velocity structure is inconsistent with gravitational free fall (Lim et al. 2008). Its projected length spans ∼12 kpc in galactocentric altitude, along which one would expect a radial gradient in Kepler speed. Its major axis is roughly parallel (within ∼20°) to the projected stellar isophotal minor axis, but the filament itself is offset at least 5 kpc to the southeast. In response to the gravitational potential, gas at high altitude will have a higher velocity toward the galaxy's nucleus than it will at its orbital apoapse (Lim et al. 2008). It therefore spends a longer amount of time around its high altitude "turning point" than it does in proximity to the nucleus. This is consistent with the observed velocity width broadening at the filament's southern terminus, where our line of sight will naturally intersect clouds that populate a broader distribution of velocities, because some will be on their ascent, while others will be slowing and beginning to fall back inward. That the filament's velocity is slower near the nucleus than at its high altitude terminus suggests that gas has not fallen into it, but rather has been lifted out of it. For the two scenarios to be consistent with one another, then, the filament should be dynamically young. We will discuss the cavity uplift hypothesis in Section 4.
3.4.2. Cold Gas Motions Induced by the Radio Jet
The inner ∼10 kpc of the molecular nebula shows evidence for dynamical interaction between the radio jet and the ambient molecular gas through which it propagates. This can be seen in Figure 8, in which we show 40 km s−1 "slices" through the CO(2–1) datacube (i.e., channel maps), from −360 km s−1 through +400 km s−1 relative to the galaxy's systemic velocity. The blueshifted channels reveal a sheet of cold gas, which, in projection, bends to hug the edges of the radio lobes (see, e.g., the −120 km s−1 channel in Figure 8, where the alignment is most apparent). The bulk of this sheet's line-of-sight velocity is slow (only ∼−100 km s−1), though there is a thinner filament of higher velocity gas that bisects the sheet lengthwise, cospatial with a bright, linear knot along a P.A. of ∼45° (N through E) in the 8.4 GHz radio lobe. The velocity of this filament increases (to ≳200 km s−1) with increasing galactocentric radius, which, like the southern filament (Section 3.4.1), is inconsistent with expectations of infall under gravity.

Figure 8. ALMA CO(2–1) channel maps, showing 40 km s−1 slices of the full datacube, ranging from −360 km s−1 through +400 km s−1 relative to the systemic velocity of the galaxy at z = 0.0821. The outermost baselines have been tapered so as to increase S/N, resulting in a beam size of 094 × 079, corresponding to a physical resolution of 1.4 kpc × 1.2 kpc (marked by the white ellipse in the top-left panel). Red contours show the 8.4 GHz radio source, and dashed black contours are used to mark the significance of the emission. The outermost black dashed contours show where the CO(2–1) emission exceeds 3σ and, when present, increase inward to show 5σ, 10σ, and 20σ over the background rms noise of 0.18 mJy beam−1 per 40 km s−1 channel. The white dashed contour marks the continuum absorption discussed in Section 3.1.
Download figure:
Standard image High-resolution imageThe velocity structure of cold gas along the jet is better seen in Figure 9. In panel (a), we show the CO(2–1) spectrum extracted from a ∼10 kpc (major axis) elliptical aperture placed on the millimeter and radio core. The line profile necessitates a fit with at least two Gaussians. The emission associated with these two Gaussians is shown in panel (b). A two-component velocity map, made by fitting the blue- and redshifted components independently, is shown in panel (c). The blueshifted shell of material, whose dispersion map is shown in panel (d), is bound on its northwestern edge by a linear ridge of higher velocity dispersion blueshifted gas. In projection, this feature is cospatial with the prominent FUV-bright rim of star formation, detected by HST (see Figure 1, bottom-right panel), that envelopes the northern radio lobe. The molecular gas that is dynamically interacting with the working surface of the radio jet is therefore likely permeated by young stars.

Figure 9. A closer look at the molecular gas cospatial with the radio jet. A single-Gaussian fit to this region (i.e., as shown for the moment maps in Figure 6) does not adequately model the superposition of approaching and receding components along the same line of sight. Here we show moment maps created with a double-Gaussian fit, better representing the velocity distribution. (a) The CO(2–1) line profile extracted from a polygonal aperture encompassing the jet region, as shown in Figure 5(b). The line features a peak slightly blueward of center, as well as a strong red wing offset by ∼+150 km s−1 relative to the systemic velocity. Two Gaussians are fit to these components (shown in blue and red, respectively). Panels (b) and (c) show the velocity maps for these approaching and receding molecular components, while panels (d) and (e) show their velocity dispersion maps. Multi-Gaussian fits for various subregions are explored in Figure 10.
Download figure:
Standard image High-resolution imageAs we noted in our discussion of Figure 7(b), the broadest, fastest velocity structure in the entire molecular nebula is cospatial with the bright radio knot where the southern radio jet bends sharply in position angle. This is clearly evident in Figure 9, which shows multi-Gaussian fits to various spectral components of CO(2–1) emission cospatial with the radio jet. These fits iteratively fit (and, if necessary, add) Gaussians to the extracted spectra using a simple χ2 minimization technique. The leftmost panel shows a three-Gaussian fit to the entire region cospatial with the radio jet, while the center and right panels show fits to the regions cospatial with the northern and southern radio lobes, respectively. The spectral extraction apertures used are indicated by orange circles on the images inlaid in these two panels. A broad, single-Gaussian fit is needed for the region cospatial with the southern jet, including the location at which the jet is deflected. This region includes the broadest velocity distribution of molecular gas in the galaxy, with a FWHM of 342 ± 8 km s−1 (σ = 145 ± 3 km s−1). This fit has an integral of ∼1.6 ± 0.9 Jy km s−1, corresponding to a molecular gas mass of (6.4 ± 0.4) × 108 M⊙.
Pollack et al. (2005) presented VLA polarimetry of PKS 2322–123, the radio source associated with the A2597 BCG. The source has a steep spectral index of α = 1.8 between ∼5 and ∼15 GHz, suggesting either that it is old or, given its compactness, that it has remained dynamically confined as it struggles to expand against a dense, frustrating medium. The VLA polarimetry reveals a compact region of polarized flux associated with the southern lobe with a Faraday rotation measure of 3620 rad m−2, suggesting that the southern lobe is deflected from its original southwestern trajectory toward the south and into our line of sight. This bright radio knot, cospatial with the broadest velocity distribution of molecular gas (see Figures 9 and 10), is likely an impact site, showing strong evidence for a dynamical interaction between the radio source and molecular gas. Whether it is the molecular gas that has redirected the jet's trajectory will be discussed in Section 4.

Figure 10. ALMA CO(2–1) spectra extracted from regions cospatial with the radio jet and lobes. One or more Gaussians have been fit to the data so as to minimize residuals, which are marked by the dark yellow line near 0 mJy. The (multi)-Gaussian fit is shown in red, while individual Gaussian components are shown in blue. The leftmost panel shows a three-Gaussian fit to the entire region cospatial with the radio jet, while the center and righthand panels show fits to smaller regions cospatial with the northern and southern radio lobes, respectively. Those spectral extraction apertures are marked by orange circles on the in.aid velocity dispersion maps. Gaussian centroids and FWHMs for each component are labeled for all fits.
Download figure:
Standard image High-resolution image3.5. MUSE Maps of the Host Galaxy and Warm Nebula
In Figure 11 we show the Voronoi-binned MUSE map of the stellar line-of-sight velocity and velocity dispersion within the inner 50 kpc of the galaxy. Only Voronoi-binned spaxels with S/N > 200 are shown. A deep VLT/FORS i-band image of the BCG with MUSE Hα contours overlaid is shown for reference. While some background/foreground sources are seen, there are a number of spectroscopically confirmed companions embedded within the stellar envelope of the BCG (G. R. Tremblay et al. 2018, in preparation). The galaxy has clearly enjoyed a rich merger history, as is generally the case for all those that sit long enough at the bottom of a cluster potential well. At best, there is only a weak signature of coherent stellar rotation in the inner 50 kpc (NW approaching, SE receding), consistent with expectations for the boxy interior of a "slow/non-regular rotator" early-type galaxy (Cappellari 2016). We note that there is some evidence for a minor-axis kinematically decoupled core (e.g., Krajnović et al. 2011) in the nucleus. This will be discussed in a forthcoming paper (G. R. Tremblay et al. 2018, in preparation).

Figure 11. The host galaxy and the kinematics of its stellar component. (Left) VLT/FORS i-band image of the BCG and its surrounding 250 kpc × 250 kpc environment. A logarithmic stretch has been applied to highlight the low surface brightness outskirts of the galaxy. Hα contours are shown in black, while the white dashed box indicates the FoV of the rightmost panels. (Top right) VLT/MUSE velocity map of the galaxy's stellar component. The data have been Voronoi-binned and so increase S/N in the stellar continuum, as described in Section 2.2. We only show the innermost 60 × 60 kpc2 because the stellar surface brightness (and therefore S/N) drops rapidly beyond this FoV. Velocities have been projected around a zero point at z = 0.0821 (e.g., cz = 24,613 km s−1), as we have done for the ALMA and MUSE emission line velocity maps. (Bottom right) Best-fit stellar velocity dispersion (e.g., FWHM/2.35), also from the MUSE data. Dispersions are typical for a large giant elliptical galaxy (e.g., Faber & Jackson 1976).
Download figure:
Standard image High-resolution imageThe total (stellar and nebular) spectrum, extracted from a spatial aperture that encompasses the galaxy center in the MUSE cube, is shown in Figure 12. All major nebular lines are detected at high S/N, enabling spatially resolved line maps from Hβ through [S ii]. A selection of these are shown in the side panels of Figure 12. We note that [O iii]λλ4959, 5007 Å is spatially extended, but only on the scale of the 10 kpc 8.4 GHz radio source. The remaining lines, particularly those tracing star formation, match the morphology (and line width, roughly) of the Hα nebula, albeit at lower surface brightness. As is apparent from Figure 11, the major axis of the warm emission line nebula is roughly aligned with the stellar minor axis of the host galaxy.

Figure 12. The MUSE optical spectrum extracted from a 10'' circular aperture centered on the galaxy nucleus. Both nebular and stellar continuum emission are shown. The red end of MUSE spectral coverage is around 9300 Å, but we have truncated it at 7500 Å for clarity. The MUSE IFU enables spatially resolved spectroscopy at the seeing limit (∼09) across the entire nebula, and so every spectral line here can be shown as a two-dimensional image (or velocity/velocity dispersion map; e.g., Figure 13). As examples, we show the continuum-subtracted Hα image as an inset, as well as the [O iii]λ5007 and [O i]λ6300 images to the right.
Download figure:
Standard image High-resolution imageIn Figure 13, we show the MUSE flux, velocity, and velocity dispersion maps for the Hα nebula. Just as for the cold molecular gas, the warm ionized nebula has not dynamically equilibrated, as there are no obvious signs of rotation save for the innermost ∼10 kpc of the galaxy. There, a blueshifted shell of material is found, cospatial with a similar feature in the molecular gas, clearly matching the shape of the 8.4 GHz radio source. The Hα velocity dispersion map reveals thin, bubble-like rims of higher velocity dispersion gas, reaching widths upward of ∼350 km s−1. Given their location and morphology, these broad streams are likely churned by dynamical interaction with the radio source or the buoyant X-ray cavities it has inflated. Cospatial with these features, Oonk et al. (2010) discovered coherent velocity streams of warm molecular hydrogen (traced by the H2 1–0 S(3) and Paα lines) similarly hugging the edges of the radio source, at roughly the same line-of-sight velocity and velocity width as those seen in the MUSE Hα maps.

Figure 13. MUSE maps of Hα flux, line-of-sight velocity, and velocity dispersion in the warm ionized nebula, created after modeling and subtracting the stellar continuum as described in Section 2.2. The Hα flux map (left panel) is shown with a logarithmic color scale to better show the faint filaments relative to the bright nucleus. Note the blueshifted "S"-shaped feature near the nucleus in the velocity map (center), strongly reminiscent of the shape of the 8.4 GHz radio source (shown in the flux map, for comparison). Note that these maps properly account for blending of the Hα and [N ii] lines. Note also, particularly for the northern filaments, that velocities are higher at higher altitudes from the galaxy center, consistent more with uplift than gravitational free fall. Compare these maps to those for the cold molecular nebula in Figure 6. We compare the MUSE and ALMA data directly in Section 3.6.
Download figure:
Standard image High-resolution imageAgain, like the molecular nebula, the northern and southern warm ionized filaments are more difficult to interpret. All show a narrow velocity structure, and no evidence for free fall. This is the case for a large number of warm nebulae in CC BCGs (Hatch et al. 2007; Edwards et al. 2009; Hamer et al. 2016), even those for which there is extremely compelling morphological coincidence between filaments and X-ray cavities, suggestive of uplift (see, e.g., IFU observations of the ionized filaments in Perseus; Hatch et al. 2006; Gendron-Marsolais et al. 2018). As we will discuss in Section 4, A2597 is in many ways like Perseus in that the Hα filaments are spatially coincident with X-ray cavities. We discuss these implications in Section 4.
Dividing the MUSE Hα and Hβ flux density maps produces a Balmer decrement map which, following the assumptions discussed in Section 2.2, we scale to create the extinction (AV) map shown in Figure 14(a). The highest extinction, and therefore perhaps the densest, dustiest gas, is found to the south of the nucleus, where the radio source is deflected. CO(2–1) is brightest at this same knot (compare the ALMA moment zero map in Figure 6 with Figure 14). The northeastern dust lane seen in optical imaging is also clear. It is along this rim that we find extended 230 GHz continuum emission (see Figure 2). This could indeed be dust continuum emission, detected at ∼3σ alongside the ∼425σ nonthermal millimeter-synchrotron point source associated with the AGN. Figure 14(b) shows the electron density map (linearly proportional to the total gas density at ∼104 K) made from the [S ii]λλ 6717 Å/6732 Å line ratio. The densest gas is found along the jet axis, perhaps due to the dredge-up of cooler, denser ionized gas from the nucleus, and also along a southerly "shell" that appears to hug the boundary of the southern radio jet as it bends in position angle. If real (and it likely is, given that it is also seen in the AV map made from the Balmer lines), this may be tracing the dense population of clouds that form the impact site at which the jet is deflected. We will discuss this possibility in Section 4.

Figure 14. (Left) An extinction (AV) map made by scaling the MUSE Balmer decrement map (Hα/Hβ ratio) following the procedure described at the end of Section 2.2. The 8.4 GHz radio source is overlaid in black contours. The inset panel shows a zoom-in on this 12 × 12 kpc2 region. The color bar is in units of V-band magnitudes. (Right) Electron density map, made by scaling the ratio of the forbidden sulfur lines ([S ii]λλ 6717 Å/6732 Å) using the calibration of Proxauf et al. (2014) and assuming an electron temperature of Te = 104 K. The region of highest extinction is found just to the south of the nucleus, where the radio jet bends in position angle at the site of a bright radio knot with a large Faraday rotation measure, indicative of abrupt deflection. It is here that CO(2–1) is brightest (Figure 6). The electron density map is highest at the boundaries of the southern radio lobe and along the long axis of the northern radio lobe.
Download figure:
Standard image High-resolution imageIn Figure 15, we show a spatially resolved Baldwin, Phillips, & Terlevich (BPT; Baldwin et al. 1981) diagnostic plot using the [O iii]λ5007/Hβ and [N ii]λ6585/Hα line ratios (e.g., Veilleux & Osterbrock 1987) extracted from each spaxel in the MUSE cube. Galaxies (or individual regions within a single galaxy, as shown here) stratify in BPT space based upon the relative contributions of stellar and non-stellar ionization sources. The solid gray curve shows the empirical star formation line from Kauffmann et al. (2003), the dashed gray curve shows the theoretical maximum starburst model of Kewley et al. (2001), and the dashed–dotted gray line is the empirical division between LINER- and Seyfert-like sources as defined by Schawinski et al. (2007). We have color-coded the data points based upon the regions in which they sit. The vast majority of points lie in the "composite" or "AGN–H ii" region as defined by Kewley et al. (2006; also called the "transition region" in Schawinski et al. 2007). This "classification" should not be overinterpreted, as the situation for CC BCGs is highly complex and likely represents a superposition of several different ionization sources (see, e.g., the discussions of Ferland et al. 2009; McDonald et al. 2012). To illustrate this, we plot lines of constant shock velocity (in orange) from the Allen et al. (2008) library of fast radiative shocks, assuming a gas density of n = 1000 cm−3 (i.e., roughly the value in the central regions of Figure 14(b)), as well as the "slow shock + star formation" composite models adapted from Farage et al. (2010) and McDonald et al. (2012). Debate continues as to the relative role played by stellar photoionization, (slow) shocks (McDonald et al. 2012), conduction (Sparks et al. 2012), and cosmic-ray heating (Ferland et al. 2009; Donahue et al. 2011; Fabian et al. 2011; Mittal et al. 2011; Johnstone et al. 2012). Galaxies are enormous, complex structures, and so any line of sight that passes through them will inevitably reveal a superposition of many physical processes. It is likely that all of these ionization mechanisms play some role in heating the envelopes of cold clouds. We note, finally, that new HST/COS far-ultraviolet spectroscopy of the filaments in A2597 will be discussed in a forthcoming paper (S. Vaddi et al. 2018, in preparation).

Figure 15. MUSE emission line diagnostic diagrams for spaxels with S/N > 3 in each line. The left panel shows a standard Baldwin, Phillips, & Terlevich (BPT; Baldwin et al. 1981) diagnostic plot using the [O iii]λ5007/Hβ and [N ii]λ6585/Hα line ratios (e.g., Veilleux & Osterbrock 1987). Spaxels are color-coded based upon their location relative to boundaries between well-known empirical and theoretical classification schemes (Kewley et al. 2001; Kauffmann et al. 2003; Schawinski et al. 2007) shown in gray dashed and solid lines. We also show "pure shock" (Allen et al. 2008) as well as "slow shock + star formation" (McDonald et al. 2012) composite models in solid color lines. We discuss these lines in Section 3.5. Spaxel color-coding is shown to the panel at right, which also shows their distribution on the sky.
Download figure:
Standard image High-resolution image3.6. MUSE and ALMA Comparison
Comparing the MUSE and ALMA data directly reveals strong evidence that the warm ionized and cold molecular nebulae are not only cospatial, they are comoving. In Figure 16 we overplot the Hα+[N ii] and CO(2–1) profiles extracted from matching 6'' diameter apertures centered on the galaxy core in the MUSE and ALMA cubes, respectively. The panels at the sides of Figure 16 show matching Hα and CO(2–1) morphology at the broadest wings of each line, consistent (but not uniquely) with the hypothesis that the two lines stem from largely the same population of clouds. This cannot be true entirely, as the deblended Hα FWHM is 565 ± 25 km s−1, a factor of ∼2 broader than the 252 ± 14 km s−1 FWHM of the CO(2–1) line.

Figure 16. The MUSE Hα and ALMA CO(2–1) datacubes reveal similar morphologies at matching velocities, consistent with the hypothesis that the warm ionized and cold molecular gas are comoving with one another, as would be predicted if the Hα emission arose from the warm ionized skins of millimeter-bright molecular cores. Here we show the MUSE Hα+[N ii] profile extracted from a circular aperture with a diameter of 30 spaxels (∼6''), centered on the galaxy core. We have deblended the Hα line from the [N ii] doublet and plot the resulting single-Gaussian fit to Hα with the blue dashed line. The ALMA CO(2–1) spectrum, extracted from a (roughly) matching aperture, is plotted in purple.
Download figure:
Standard image High-resolution imageThis velocity width mismatch is more readily apparent in Figure 17, where we plot CO(2–1) line-of-sight velocity and dispersion against the same quantities for Hα. We have smoothed the data points (i.e., one point for each cospatial spaxel in the registered MUSE and ALMA cubes) with a Gaussian, and show shaded regions indicating ratios of 1:1–2:1 and 2:1–4:1. While the line velocity centroids lie largely along the 1:1 line, the line widths preferentially span the 2:1–4:1 range. The rightmost panels of Figure 17 show the difference and ratio, respectively, between the MUSE Hα and ALMA CO(2–1) velocity and dispersion maps. In the velocity difference map, bluer colors mean that the CO(2–1) velocity centroid is slightly blueshifted relative to the Hα velocity centroid. The velocity difference map is largely smooth and below ±45 km s−1, which shows that the Hα and CO(2–1) line velocity centroids track one another closely across the entire overlap region between the molecular and ionized nebulae. The velocity dispersion ratio map (Figure 17, right panel) shows that, on average, the Hα velocity dispersion is a factor of 2–3 times broader than that for CO(2–1).

Figure 17. (Left panel) ALMA CO(2–1) vs. MUSE Hα velocity and velocity dispersion. Points are taken from every cospatial spaxel in the >3σ overlap region between the warm ionized and cold molecular nebulae. The points have been smoothed with a Gaussian kernel. Contour colors encode the Gaussian kernel density estimate (i.e., a darker color indicates a higher density of data points). (Right panels) Maps of the difference and ratio between Hα and CO(2–1) velocity centroid and dispersion, made by subtracting and dividing the corresponding MUSE and ALMA moment maps, respectively. We have applied various corrections to account for, e.g., differing spatial resolutions, as described in Section 2.3. The edges of these maps should be ignored. In the dispersion ratio map, for example, the outermost dark blue rim is smaller than the ALMA beam size, and an artifact of the division.
Download figure:
Standard image High-resolution imageThe broader observed velocity widths for Hα are important but not necessarily surprising, given that our line of sight is likely to intersect more warm gas (and therefore a broader velocity distribution) than cold molecular clouds, owing to their large relative contrast in volume filling factor. We discuss this further in Section 4.
4. Discussion
This paper presents three results:
- 1.Cold gas is cospatial and comoving with warm gas. A 3 billion solar mass filamentary molecular nebula is found to span the inner 30 kpc of the galaxy. Limited by the critical density of CO(2–1), its volume filling factor must be low, and so the nebula must be more like a "mist" than a monolithic slab of cold gas (e.g., McCourt et al. 2018). These cold clouds are likely wrapped in warm envelopes that shine with Balmer and forbidden line emission at the cloud's interface with the hot X-ray atmosphere, explaining why the Hα and CO(2–1) nebulae are largely cospatial and comoving. This hypothesis is now supported by a large and growing number of ALMA observations of CC BCGs (e.g., papers by Russell, McNamara, and collaborators).
- 2.Cold gas is moving inward, and perhaps feeding the black hole. Clouds are directly observed to fall inward toward the galaxy nucleus, probably within close proximity (≲100 pc) to the central supermassive black hole. These clouds may therefore provide a substantial (even dominant) component of the mass flux toward the black hole accretion reservoir. This result, discussed in Tremblay et al. (2016) and considered in a broader context here, is consistent with a major prediction of the CCA model (Gaspari et al. 2013).
- 3.Cold gas is dynamically coupled to mechanical black hole feedback. In projection, a bright rim of blueshifted molecular gas appears to encase the radio lobes (see, e.g., Figure 8), perhaps suggestive of dynamical coupling between the cold molecular gas and the powerful radio jet plowing through it. The broadest distribution of cold gas velocities is found cospatial with the southern jet (Figure 10, right panel). Just south of the radio core, this jet deflects in position angle, perhaps because it has exchanged momentum with a dense ensemble of cold clouds. Nearly all cloud velocities, save for the most extreme wings of the distribution, are nevertheless below the circular speed at any given radius, and so the clouds should be falling inward unless tethered to the hot medium. Approximately 1 billion M⊙ of cold gas is found in dynamically short-lived filaments spanning altitudes greater than 10 kpc from the galaxy center and may be draped around the rims of buoyant X-ray cavities. We argue that effectively all of these non-equilibrium cold gas structures are directly or indirectly due to mechanical black hole feedback, as mediated either by jets, or buoyant hot cavities, or turbulence in the velocity field of the hot atmosphere.
It is possible that the molecular and ionized nebula at the heart of Abell 2597 is effectively a galaxy-scale "fountain," wherein cold gas drains into the black hole accretion reservoir, powering a jet- or cavity-driven plume of uplifted low-entropy gas that ultimately rains back toward the galaxy center from which it came. This scenario might establish a long-lived heating–cooling feedback loop, mediated by the supermassive black hole, which would act much like a mechanical "pump" for this fountain.
4.1. The Fountain's "Drain"
We directly observe at least three cold molecular clouds moving toward what would be the fountain's drain (see Section 3.1 and Tremblay et al. 2016). If this line-of-sight observation is at all representative of a (much) larger three-dimensional distribution of inward-moving clouds, and if indeed they are as close to the black hole as corroborating evidence suggests they are, they could supply on the order of ∼0.1 to a few M⊙ yr −1 of cold gas to the black hole's fuel reservoir. The observation would then be consistent with a major prediction of Gaspari et al. (2013, 2015, 2017), who argue that that nonlinear condensation from a turbulent, stratified hot halo induces a cascade of multiphase gas that condenses from the ∼107 K to the ∼20 K regime. This cooling "rain" manifests as chaotic motions that dominate over coherent rotation (with turbulent Taylor number <1; e.g., Gaspari et al. 2015). Warm filaments condense along large-scale turbulent eddies (generated, for example, by AGN feedback), naturally creating extended and elongated structures like the Hα filaments ubiquitously observed in CC BCGs and possibly explaining their apparent close spatial association with radio jets and X-ray cavities (e.g., Tremblay et al. 2015). Warm overdensity peaks further condense into many cold molecular clouds that form giant associations,38 hosting most of the total mass. The thermodynamics and kinematics of the cooler gas phases should then retain "memory" of the hot plasma from which they have condensed (Gaspari et al. 2017, 2018; Voit 2018).
Despite important differences (reviewed in part by Hogan et al. 2017; Gaspari et al. 2018; Pulido et al. 2018; Voit 2018), the CCA model of Gaspari et al. (2013) succeeds alongside the "circumgalactic precipitation" and "stimulated feedback" models of Voit et al. (2015b) and McNamara et al. (2016), respectively, in predicting many of the major observational results we find in Abell 2597. Were we to (roughly) attempt to unify these models within the same "fountain" analogy, all would effectively include a "drain" into which cold clouds fall, providing a substantial (even dominant) mass flux toward the black hole fuel reservoir. That we have strong observational evidence for exactly such a drain in Abell 2597 enables us to place at least broad constraints on how the drain might operate.
For example, whether they condense in the turbulent eddies of cavity wakes or not, a cascade of gas cooling from hot plasma will still require roughly a cooling time tcool to reach the molecular phase. Using the buoyant rise time as a rough age estimate, the oldest X-ray cavities in A2597 are ∼2 × 10⁸ yr (Tremblay et al. 2012b), which is roughly comparable to the cooling time at the same 20–30 kpc radius (Tremblay et al. 2012a). The time it takes for clouds to descend from any given altitude to the center of the galaxy is a more complicated issue. Following Lim et al. (2008), a thermal instability, precipitating at rest with respect to the local ICM velocity, will free fall in response to the gravitational potential and accelerate to a velocity v given roughly by

where v(r0) is its initial velocity (assumed to be zero if the ICM and BCG velocities are roughly matched), r0 is its starting radius relative to the BCG core, G is the gravitational constant, M is the total gravitating mass of the BCG, and a is its scale radius (which is roughly half the effective radius Re, as a ≈ Re/1.815). For a scale radius of a ∼ 20 kpc and a gravitating mass of M ≈ 1012 M⊙ (Tremblay et al. 2012a), the cooling cloud would attain a rough velocity of ∼470 km s−1, ∼380 km s−1, or ∼300 km s−1 if it fell from a height of 20, 10, or 5 kpc, respectively.
Observed line-of-sight cloud velocities in Abell 2597 are significantly lower than these free-fall values, just as they are for effectively all other CC BCGs thus far observed with ALMA (see, e.g., Vantyghem et al. 2018 for the latest example). The clouds might still be ballistic if most of their motion is contained in the plane of the sky, but this argument weakens with every new observation showing the same result. It is therefore now clear that the velocity of cold clouds in the hot atmospheres of CC BCGs cannot be governed by gravity alone. Simulations and arguments by (e.g.) Gaspari et al. (2018) and Li et al. (2018) indeed suggest that the clouds must have subvirial velocities, consistent with those observed in CC BCGs including Abell 2597 (Section 3.4).
If a cooling cloud's terminal speed is smaller than typical infall speeds (McNamara et al. 2016), it can drift in the macro-scale turbulent velocity field of the hot X-ray atmosphere (Gaspari et al. 2018), whose dynamical structure is sculpted by jets, sound waves, and bubbles. The terminal velocity of cold clouds is set by the balance of their weight against the ram pressure of the medium through which they move (e.g., Li et al. 2018). That the clouds in Abell 2597 are apparently not in free fall may simply mean that their terminal velocity is the lower of the two speeds. While the extreme density contrast between the molecular gas and hot plasma remains an issue, one simple explanation is that the clouds' velocity in the hot atmosphere has been arrested by more efficient coupling mediated by their warm ionized skins, which would effectively lower their average density (and therefore their terminal speed) and increase the strength of any magnetic interaction (e.g., Fabian et al. 2008).
Given the apparent lack of coherent velocity gradients along the molecular and ionized filaments, it is also likely that the multiphase nebula is dynamically young. Such a result is unsurprising in the context of CCA, precipitation, and stimulated feedback models. In essence, all suggest that the cold clouds are just one manifestation of what is ultimately the same hydrodynamical flow, drifting in the velocity field of the hot plasma. That velocity field, in turn, is continuously stirred by subsonic turbulence induced by buoyant bubbles, jets, and merger-driven sloshing (Gaspari et al. 2018). This omnipresent dynamical mixing may inhibit virialization, preventing the formation of smooth gradients over kiloparsec scales. At the very least, the recent Hitomi observation of Perseus confirms that bulk shear in the hot plasma is similar to molecular gas speeds observed with ALMA, supporting the idea that they move together (Hitomi Collaboration et al. 2016). At subkiloparsec scales, inelastic collisions and tidal stress between clouds can funnel cold gas toward the nucleus, which we observe directly in Abell 2597 (Section 3.1 and Tremblay et al. 2016). Chaotic cold accretion can then boost black hole feeding far in excess of the Bondi rate, powering the "pump" at the fountain's center.
4.2. The Fountain's "Plume"
There is little doubt that this pump injects an enormous amount of kinetic energy into the hot ∼107–108 K phase. In Figure 18 we present a new, deep Chandra X-ray map of the A2597 BCG and its outskirts, made by combining the new observations from our recent Cycle 18 Large Program with the archival exposures previously published by McNamara et al. (2001), Clarke et al. (2005), and Tremblay et al. (2012a). The new map contains 1.54 million source counts collected over 626 ks of total integration time, enabling an exquisitely deep look at the X-ray cavity network that permeates the innermost 30 kpc of the cool core. The figure makes use of a GGM filter as an edge detector (Sanders et al. 2016a; Walker et al. 2017), revealing the X-ray cavities in sharp relief. A discussion of detailed X-ray morphology along with deep spectral maps, etc., will be discussed in a forthcoming paper (G. R. Tremblay et al. 2018, in preparation). We preview the map here because it makes obvious the need to consider uplift by buoyant hot cavities as a primary sculptor of morphology in the cold and warm nebulae.

Figure 18. A new, deeper look at the X-ray cool core cospatial with the A2597 BCG. (a) 626 ks Chandra X-ray observation of 0.2–10 keV emission in the innermost ∼250 × 250 kpc2 of the cluster. The X-ray data have been convolved with a GGM filter (e.g., Sanders et al. 2016a) to better show ripples and cavities. The optical Petrosian radius of the BCG's stellar component is (roughly) marked by the gray dashed ellipse. Brackets indicate the relative FoVs shown in the surrounding panels. Panels (b), (c), and (d) show the same data, slightly zoomed in, with MUSE Hα, ALMA CO(2–1), and 8.4 GHz radio contours overlaid in green, blue, and gray, respectively. Moving inward, the ALMA contours in panel (d) show emission that is 3σ, 5σ, 10σ, and 20σ over the background rms noise level. With the caveat that projection effects complicate interpretation, the Hα nebula shows strong circumstantial evidence that at least some of the filaments are draped around the edges of the buoyant X-ray cavities marked by arrows.
Download figure:
Standard image High-resolution imageTo the north and south, Hα filaments (green contours on Figure 18) appear draped over the edges of the inner X-ray cavities, as if they have either been uplifted as they buoyantly rise or have formed in situ along their wakes and rims (e.g., Brighenti et al. 2015; McNamara et al. 2016). The northernmost Hα filament has a morphology and X-ray cavity correspondence that is reminiscent of the northwestern "horseshoe" filament in Perseus (e.g., Hatch et al. 2006; Fabian et al. 2008; Gendron-Marsolais et al. 2018). In projection, the southern Hα filaments reach a terminus at the rim of the southern cavity, forking like a snake's tongue into two thinner filaments. As seen in the Hα velocity map (Figure 13), one filament approaches and the other recedes, yet both have a coherent bulk line-of-sight velocity that is similar to the expected terminal velocity of the buoyantly rising hot bubble with which it is cospatial (roughly half the sound speed in the hot gas, or ∼375 km s−1; Tremblay et al. 2012a). A similar "snake's tongue" split is seen in the redshifted northern filaments, whose ≳15 kpc outskirts at the edges of cavities show the fastest line-of-sight velocities of any optical emission line in the galaxy (+400 km s−1).
The cospatial and comoving components of the warm and cold nebulae likely trace the same population of clouds, as we have argued repeatedly throughout this paper, and as has been suggested by many authors over many years (e.g., O'Dea et al. 1994; Jaffe & Bremer 1997; Jaffe et al. 2005; Wilman et al. 2006; Emonts et al. 2013; Anderson & Sunyaev 2017). In Figure 19 we compare the Hα and CO(2–1) line-of-sight velocity maps side by side. Where they overlap, the projected velocity of the molecular gas matches that of the warm gas, consistent with the hypothesis that much of the Balmer emission stems from warm ionized envelopes of cold molecular cores, tracing their interface with the ambient hot gas. As projected on the sky, the Hα nebula only shows line-of-sight velocities consistently in excess of mean CO(2–1) velocities at galactocentric radii that are greater than the outermost extent of the detected CO(2–1) emission. Were we able to detect CO(2–1) at these large radii, we would likely find it at similar line-of-sight velocities to the Hα. The fact that the latter shows a factor of 2 broader line width, then, is not necessarily surprising. Perhaps simply because of a sensitivity floor, cold molecular gas is confined to smaller radii. Any given line of sight therefore intersects a smaller volume occupied by CO(2–1)-bright clouds—and therefore smaller scale turbulent eddies—which in turn have smaller velocity dispersions. Hα is both vastly brighter (i.e., easier to detect at large radii) than CO(2–1) relative to the sensitivity limits of our optical and millimeter observations, respectively. Moreover, CO(2–1)-bright molecular clouds can dissociate easily, absent sufficient shielding, and so may be more vulnerable to destruction at larger galactocentric radii. H i in A2597, as mapped in detail by O'Dea et al. (1994), shows broader line widths more consistent with those found in Hα, supporting this notion.

Figure 19. A side-by-side comparison of the MUSE Hα and ALMA CO(2–1) line-of-sight velocity maps, shown on the same spatial and velocity scales. Insets show a zoom-in on the nuclear region for both maps. Black contours again show the 8.4 GHz radio source. Where they overlap, the MUSE and ALMA velocity maps look very similar to one another. These maps are more quantitatively compared in Figure 17.
Download figure:
Standard image High-resolution imageIn any case, if a substantial component of the Hα filaments have been buoyantly uplifted in the rise of the X-ray cavities, then so too must be the molecular filaments. Assuming (hypothetically) that coupling efficiency is not an issue, simple energetics arguments suggest that the cavity network in Abell 2597 is powerful enough to uplift the entirety of the cold molecular nebula. Archimedes' principle dictates that the bubbles cannot lift more mass than they displace (e.g., McNamara et al. 2014; Vantyghem et al. 2016; Russell et al. 2017b). The mass of hot gas displaced in the inflation of the cavity network is at least ∼7 × 10⁹ M⊙ (using X-ray gas density and cavity size measurements from Tremblay et al. 2012b, assuming spherical cavity geometry, and adopting the arguments in Gitti et al. 2011), while the total cold gas mass in the molecular nebula is less than this (∼3.2 × 10⁹ M⊙). Moreover, the cavity system has an estimated 4pV mechanical energy of ∼4 × 1058 erg (Tremblay et al. 2012b), while the total kinetic energy in the cold molecular nebula (e.g., ) is about an order of magnitude lower, at roughly ∼2 × 1057 erg. Therefore, if we ignore coupling efficiency, the uplift of the entire mass of the molecular nebula would be safely within the kinetic energy budget of the system.

Any such uplift would be temporary. The escape speed from the galaxy, which is roughly twice the circular speed at any given radius, is far in excess of any observed line-of-sight velocity in the system. After decoupling from either the cavity wake or jet entrainment layer that has lifted them to higher altitudes, cold clouds should fall back inward at their terminal speed, drifting in the hot gas velocity field as they descend. These infalling clouds may join the population we observe in absorption, powering black hole activity once again, and keeping the fountain long lived.
This paper makes use of the following ALMA data: ADS/JAO.ALMA#2012.1.00988.S. ALMA is a partnership of ESO (representing its member states), NSF (USA), and NINS (Japan), together with NRC (Canada) and NSC and ASIAA (Taiwan), in cooperation with the Republic of Chile. The Joint ALMA Observatory is operated by ESO, AUI/NRAO, and NAOJ. We are grateful to the European ALMA Regional Centres, particularly those in Garching and Manchester, for their dedicated end-to-end support of data associated with this paper. We have also received immense support from the National Radio Astronomy Observatory, a facility of the National Science Foundation operated under cooperative agreement by Associated Universities, Inc.
This work is also based on observations made with ESO Telescopes at the La Silla Paranal Observatory under programme ID 094.A-0959 (PI: Hamer). We also present observations made with the NASA/ESA Hubble Space Telescope, obtained from the data archive at the Space Telescope Science Institute (STScI). STScI is operated by the Association of Universities for Research in Astronomy, Inc. under NASA contract NAS 5-26555.
G.R.T. thanks E.S.T. and A.S.T. for educating him on nature's many sources of uplift. G.R.T. also acknowledges support from the National Aeronautics and Space Administration (NASA) through Chandra Award Number GO7-8128X as well as Einstein Postdoctoral Fellowship Award Number PF-150128, issued by the Chandra X-ray Center, which is operated by the Smithsonian Astrophysical Observatory for and on behalf of NASA under contract NAS8-03060. B.J.W., S.W.R., J.A.Z., P.E.J.N., R.P.K., W.R.F., C.J., and Y.S. also acknowledge the financial support of NASA contract NAS8-03060 (Chandra X-ray Center). F.C. acknowledges the European Research Council for the Advanced Grant Program # 267399-Momentum. M.G. is supported by NASA through Einstein Postdoctoral Fellowship Award Number PF5-160137, as well as Chandra grant GO7-18121X. The work of S.A.B., C.P.O., and B.R.M. was supported by a generous grant from the Natural Sciences and Engineering Research Council of Canada. H.R.R. and T.A.D. acknowledge support from a Science and Technology Facilities Council (STFC) Ernest Rutherford Fellowship. A.C.E. acknowledges support from STFC grant ST/P00541/1. A.C.F. acknowledges support from ERC Advanced Grant "Feedback." M.N.B. acknowledges funding from the STFC. Basic research in radio astronomy at the Naval Research Laboratory is supported by 6.1 Base funding. This research made use of Astropy,39 a community-developed core Python package for Astronomy (The Astropy Collaboration et al. 2013, 2018). Some MUSE data reduction and analysis was conducted on Hydra, the Smithsonian Institution's High Performance Cluster (SI/HPC).
Facilities: CXO (ACIS-S) - , HST (ACS - , NICMOS) - , VLT: Yepun - .
Software: Astropy (The Astropy Collaboration et al. 2013, 2018), CASA (McMullin et al. 2007), CIAO (Fruscione et al. 2006), IPython (Perez & Granger 2007), Matplotlib (Hunter 2007), NumPy (van der Walt et al. 2011), PySpecKit (Ginsburg & Mirocha 2011), scipy (Jones et al. 2001).
Footnotes
- 29
- 30
This code repository is archived at 10.5281/zenodo.1233825, and also available at https://github.com/granttremblay/Tremblay2018_Code.
- 31
We also experimented with a number of different weighting schemes, including Briggs with a robust parameter that ranged from −12.0 (roughly uniform) to 2.0 (close to natural). We show only natural weighting throughout this paper, partially because our results are not strongly dependent on the minor differences between the various available algorithms.
- 32
- 33
- 34
- 35
- 36
- 37
This is unsurprising in the context of a simple Kennicutt (1998) scenario. It is, however, also important to consider this result alongside the several known CC BCG filament systems that are clearly not forming stars. A famous example is found in the Perseus/NGC 1275 optical nebula. Many of its filaments are rich in molecular gas (Salomé et al. 2011), yet largely devoid of any ongoing star formation (e.g., Conselice et al. 2001; Canning et al. 2014).
- 38
- 39