


Abstract
Irregular time evolution of the radio emission generated in a B2-class microflare (SOL2017-01-25T10:15), occurring on 2017 January 25 in active region 12,628, is studied. The microflare was apparently initiated by an appearance of an s-shaped loop, observed in the EUV band. The radio emission is associated with the nonthermal electrons detected with Ramaty High Energy Solar Spectroscopic Imager, and originates simultaneously from two opposite footpoints of a magnetic fan structure beginning at a sunspot. According to the active region geometry, the footpoints are situated in the meridional direction, and hence are observed by RATAN-600 simultaneously. The radio emission intensity signal, as well as the left-hand and right-hand circular polarization signals in the low-frequency band (3–4 GHz) show good correlation with each other, with the average characteristic time of the variation 1.4 ± 0.3 s. The polarization signal shows a time variation with the characteristic time of about 0.7 ± 0.2 s. The irregular quasi-periodic pulsations of the radio emission are likely to be caused by the superposition of the signals generated at the local electron plasma frequencies by the interaction of nonthermal electrons with the plasma at the footpoints. In this scenario, the precipitation rate of the nonthermal electrons at the opposite footpoints could be modulated by the superposition of fundamental and second harmonic modes of sausage oscillations, resulting in the observed different characteristic times of the intensity and polarization signals. However, other mechanisms, e.g., the oscillatory regime of loop coalescence or magnetic null point oscillation could not be rigorously excluded.
Export citation and abstract BibTeX RIS
1. Introduction
The emission produced during solar and stellar flares often appears to have quasi-periodic time variations called quasi-periodic pulsations (QPP; see Nakariakov et al. 2016; Van Doorsselaere et al. 2016, for recent comprehensive reviews). It has been demonstrated that QPP are a statistically significant, common feature of both thermal and nonthermal emission of flaring energy releases (Kupriyanova et al. 2010 and Simões et al. 2015, respectively, see also Inglis et al. 2016; Pugh et al. 2016, 2017 for recent statistical studies). The mechanisms for QPP are intensively studied, and it is commonly accepted that they can be connected with repetitive regimes of charged particle acceleration in magnetic reconnection, and/or the periodic modulation of the accelerated particle kinematics. The periodicity could be either spontaneous, or induced by magnetohydrodynamic (MHD) waves (see McLaughlin et al. 2018 for a review). In particular, the periodicity could be caused by the modulation of the nonthermal charged particle kinematics by an MHD oscillation, e.g., by the sausage mode (Zaitsev & Stepanov 1982). The study of QPP is directly relevant to the understanding physical processes operating in flaring energy releases. In particular, QPP may be used as a tool for the diagnostics of physical conditions in flaring sites. We would like to stress that it is applicable not only to QPP with a well-pronounced stationary periodicity, but also to nonstationary and even irregular pulsations (e.g., similarly to the Pi-type geomagnetic pulsations), modulations and statistical properties of which are linked with the underlying physical processes (see Nakariakov et al. 2016, for a review).
Usually, QPP are detected in powerful flares, in which the signal is sufficiently strong to allow for the confident resolution of the emission variation. However, the importance of weaker energy releases, i.e., microflares, which could play an important role in the solar atmospheric energy balance (e.g., De Moortel & Browning 2015), justifies the interest in detection and analysis of QPP in microflares too. As microflares are usually characterized by a significant emission of the nonthermal nature (e.g., Hannah et al. 2011), while their typical thermal emission is lower than the GOES C class (e.g., Hannah et al. 2008; Hudson 2011), a suitable band for the microflare detection is the radio band. Perhaps, the first detailed study of microflares in the radio domain, detected as weak 2–10 s bursts of the type III nature, was performed by Kundu et al. (1986). The nature of the bursts was found to be similar to type III bursts created at the local electron plasma frequency of the background plasma penetrated by a beam of nonthermal electrons—the plasma mechanism. The phenomenon of microflares could be connected with so-called "cold" (or "thermal-poor") flares which are characterized by a low ratio of the peak flux of thermal soft X-ray to nonthermal radio emissions (e.g., Fleishman et al. 2011; Masuda et al. 2013, and references therein). Specific mechanisms leading to the suppression of the thermal emission in the cold flares have not been revealed yet, and the study of QPP in those energy releases could shed light on them.
To the best of our knowledge, there have been only a few dedicated observational studies of QPP in microflares. Xie & Wang (1996) detected a QPP train with the typical period of 15–20 ms in the 1.42 MHz emission generated by a microflare, and interpreted it in terms of the coalescence of current-carrying loops. Jess et al. (2010) observed a quasi-periodic spatial pattern of the Doppler velocity in the vicinity of the magnetic neutral line in a microflare observed in Hα and associated it with the magnetic field deformation triggering forced reconnection. Recently, Shen et al. (2017) demonstrated that a B1.9 class microflare had been able to excite a kink oscillation of a filament. Thus, the rareness of the QPP detections in microflares causes even individual cases to be of interest.
A possible quasi-periodic process that can be searched for in the radio emission of microflares, are small-scale microwave bursts (SMBs) that are frequently detected in more powerful flares. Millisecond timescale SMBs have been detected in the microwave emission in an X6.9 solar flare (Tan & Tan 2012). SMBs with similar properties have been observed in all phases, from the early rising phases to the decay phases of six flares of the GOES class greater than C4.8 (Tan 2013). Usually, SMBs are superposed on underlying broadband flaring emission. SMBs have been considered as a possible manifestation of elementary energy-release processes in flares, connected with the flaring current sheet fragmentation into a cascade of plasmoids (see, e.g., Karlický 2014, for a review). QPP that lasted for about 70 s were detected at 4–7 GHz during a C2.4 flare were associated by Mészárosová et al. (2016) with sausage oscillations with the periods of 0.7 s and 2 s, see also Kashapova et al. (2013) and Zhdanov et al. (2016). The specific reason for the quasi-periodicity was not established, while it was pointed out that the signal had properties of sausage fast magnetoacoustic wave trains guided by coronal plasma nonuniformities.
The study of QPP in microflares requires the resolution of the radio burst fine structure, and the use of observational instruments with high time resolution and high sensitivity. Also, it would be important to have some information about the spatial location of the emission, in both the plane of the sky and at height above the solar surface. In this work, we study the time variability of the microwave emission at 3–18 GHz, with the large reflector Radio Astronomical Telescope of the Academy of Sciences-600 (RATAN-600, Korolkov & Pariiskii 1979; Bogod 2011). This instrument provides 1D spatial resolution observations that allow us to determine the horizontal coordinate of the emission source. The vertical-to-horizontal beam pattern size ratio is equal to 60. The total collection area is about 400–1000 m2. The frequency resolution is 1%. The minimum measurable polarization degree is less than 1%. The sensitivity in terms of flux is about 0.01 s.f.u. per beam pattern.
The aim of this paper is to study a quasi-periodic time variability of the microwave emission in a microflare observed with RATAN-600, and to get insight into the possible physical mechanisms responsible for this quasi-periodicity. The observations are summarized in Section 2. Our findings are summarized and discussed in Section 3.
2. Observations and Analysis
2.1. Context Information
RATAN-600 is a transit telescope. It targets a selected fixed location on the sky, with the observational beam situated at some angle to the path of the Sun, recording the radio signal at 70 frequencies in the spectral band 3–18 GHz, i.e., the sit-and-stare method. Due to the daily motion, the Sun passes through the motionless Gaussian-like beam with a width of about 83'' in the horizontal direction at 3 GHz. Thus, the scanning speed is 15'' per second when the solar transit is perpendicular to the beam, or, depending on the angle between the Sun's path and the vertical axis of the observational beam, a bit lower.
The discussed event was recorded by RATAN-600 on 2017 January 25 during the scan that passed the solar center at 10:16:43 UT,6 with the cadence time 0.2 s. Figure 1 shows the intensity and polarization signals recorded by RATAN-600, plotted over the solar magnetogram made with the Helioseismic and Magnetic Imager (HMI; Scherrer et al. 2012) on the Solar Dynamics Observatory (SDO; Pesnell et al. 2012). The radio burst detected in both intensity and polarization was observed when the western slope of active region NOAA 12,628 was passing through the RATAN-600 beam (Figure 2). The quasi-periodically varying radio burst is detected from about 10:16:15 to 10:16:21 UT. The apparent antenna temperature of the intensity burst reached the maximum value of 8 × 10⁴ K at 3.09 GHz at 10:16:18 UT, which corresponds to the radio flux of 3500 Jy/''. In the scans made before and after the discussed scan, i.e., at 9:25:57 UT and 11:07:46 UT, respectively, this active region produced signals of the apparent antenna temperature lower than 1.3 × 10⁴ K.
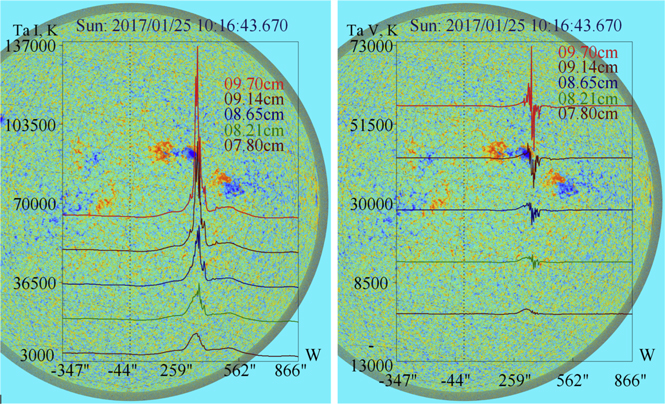
Figure 1. Radio burst recorded by RATAN-600 during the scan at 10:16:43 UT (the passage of the solar center) on 2017 January 25. The intensity (left panel) and polarization (right panel) signals corresponding to different observational wavelengths, are plotted over the photospheric magnetogram. The orange and blue colors indicate the positive and negative magnetic polarities, respectively. The curves showing the longer wavelength signal are shifted upwards for better visualization.
Download figure:
Standard image High-resolution image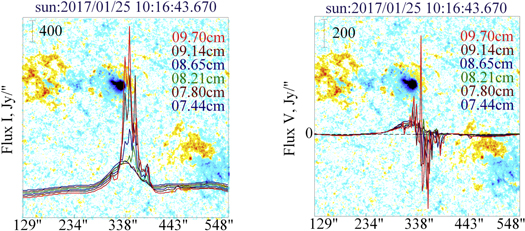
Figure 2. Same as in Figure 1, but zoomed near active region 12,628. In addition, the units on the vertical axis are Jy/''. The vertical bars in the left bottom corners of the images show the scale in the radio flux units.
Download figure:
Standard image High-resolution imageIn the discussed scan, the burst was detected at the lowest observational frequencies only, from 3.09 GHz (9.7 cm) to 3.84 GHz (7.8 cm). Both the intensity and polarization signals decreased rapidly with the increase in the frequency. The increase in the observational frequency from 3 to 4 GHz leads to the decrease in the antenna temperature by a factor of 4, see Figure 3.
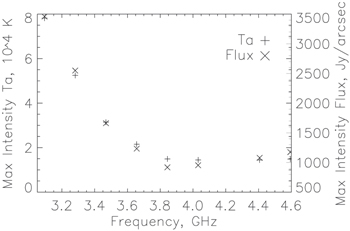
Figure 3. Dependence of the radio burst intensity on the frequency at 10:16:20 UT. Both antenna temperature (diamonds) and maximum intensity (stars) flux are shown.
Download figure:
Standard image High-resolution imageDuring the discussed RATAN-600 scan, the GOES soft X-ray flux was at the level of about B1.5, with a very small spiky increase reaching B2. Thus, we classify the discussed event as a microflare, despite its relatively high radio flux (e.g., Hudson 1991, 2011; Hannah et al. 2011). The Reuven Ramaty High Energy Solar Spectroscopic Imager (RHESSI; Lin et al. 2002) detected a noticeable increase in the X-ray flux, up to energies of 25–50 keV, with the peak at about 10:15:57 UT, see Figure 4. Figure 5, left panel, shows the time variation of the photon energy spectrum, recorded by RHESSI. The X-ray spectra made during the impulsive phase of the microflare, which occurs at 10:15:55–10:16:05 UT, and the decay phase that lasts for at least two minutes after the impulsive phase, are clearly distinguishable. Figure 5, right panel, shows the photon energy spectra determined during the impulsive and decay phases of the microflare. The presence of nonthermal particles is clearly evident.
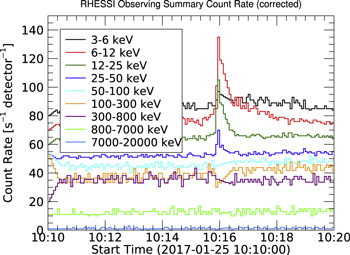
Figure 4. Variation of the X-ray flux recorded by RHESSI at different energies.
Download figure:
Standard image High-resolution image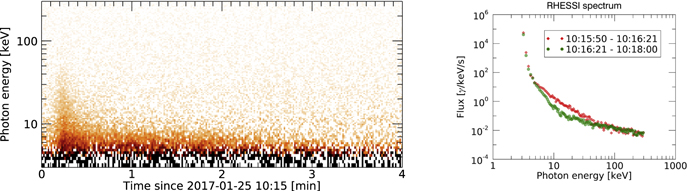
Figure 5. Left panel: the time evolution of the photon spectrum measured with RHESSI. Right panel: the comparison of the photon spectra calculated by the signals integrated from 10:15:50 to 10:16:21 UT (red diamond) and from 10:16:21 to 10:18:00 UT (green circle).
Download figure:
Standard image High-resolution imageThe discussed energy-release event was also observed at EUV wavelengths with the SDO Atmospheric Imaging Assembly (Lemen et al. 2012). The left top panel of Figure 6 shows the snapshot of the active region of interest, taken at 171 Å during the event. There are two visible spots where the emission intensity increases. The southern one, indicated by the letter B in the figure, is compact. It is situated in the umbra of the sunspot associated with active region 12,628, see the right top panel of Figure 6. This source is also well seen at 1700 Å. The northern spot that appears in the same image is indicated by the letter A. The northern source of the increased EUV emission is of a much larger area than source B, and has a zigzag-like shape. The difference in the areas suggests that the magnetic field has significantly different values at the opposite footpoints. Both features A and B are also quite visible in the hotter channels, e.g., see the 94 Å image in the bottom left panel of Figure 6. The northern source is practically invisible at 1600 and 1700 Å. Unfortunately, the X-ray signal was insufficiently strong for the syntheses of the northern X-ray source of this energy release, while the southern source, at the sunspot, is clearly seen in the RHESSI data (the bottom right panel of Figure 6). The magnetogram of the active region shown in the bottom right panel of Figure 6, demonstrates that the southern footpoint is situated in the region of the negative photospheric magnetic polarity, while the northern footpoints are in the region with the positive polarity. The geometry of coronal loops in the vicinity of the EUV and X-ray brightenings suggests that the energy release occurs in a closed coronal fan magnetic configuration that begins at the sunspot and ends at its northern periphery of the opposite magnetic polarity (see the top left panel of Figure 6).

Figure 6. EUV images of active region 12,628 during the microflare at 171 Å (top left), 1600 Å (top right), and 94 Å (bottom left). The southern white circle indicated by the letter B highlights the origin of the magnetic fan. The northern contour indicated by letter A, highlights the enhanced EUV emission of the zigzag-like shape. Bottom right: the HMI magnetogram of the active region. The red circle indicates the location of the 6–30 keV kernel during the microflare at about 10:15:57 UT, determined with RHESSI.
Download figure:
Standard image High-resolution imageBefore the beginning of the microflare, at 10:15:13 UT, an EUV image taken at 171 Å shows an occurrence of an s-shaped coronal loop that is located at the site of the EUV brightening during the microflare (Figure 7). This loop is oriented approximately in the north–south direction, apparently links the regions of the positive and negative magnetic polarity at the photosphere, and is a part of the magnetic fan in active region 12,628.
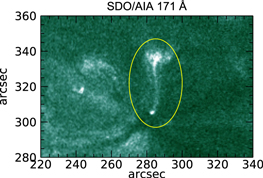
Figure 7. Image of the flaring region at 171 Å at 10:15:13 UT, showing an s-shaped coronal loop highlighted by the yellow oval.
Download figure:
Standard image High-resolution image2.2. Fine Structure of the Radio Burst
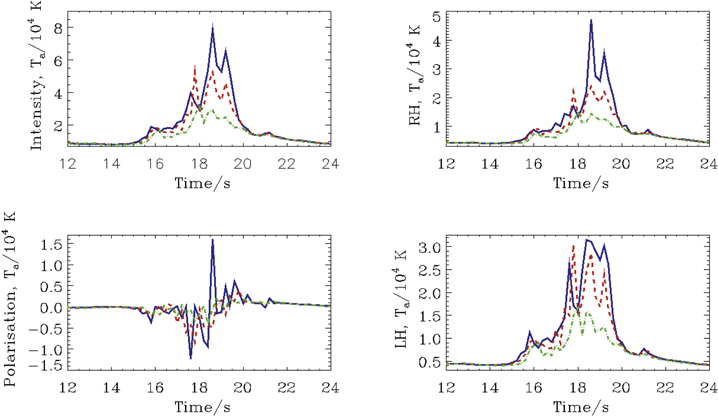
Figure 8 shows the time variation of the intensity I and polarization V signals recorded by RATAN-600 at 10:16:12–10:16:24 UT in the three lowest frequency channels. We also show the right-hand R and left-hand L circular polarization signals, which are calculated as R = (I + V)/2 and L = (I − V)/2. The I, R, and L signals have a bump-like shape, while the V signal resembles its derivative, with both positive and negative intervals. The degree of polarization, V/I, ranges between about −0.31 and 0.21 at the lowest frequency, 3.094 GHz; −0.22 and 0.16 at 3.281 GHz; and −0.16 and 0.11 at 3.469 GHz.
Figure 8. Fine time structure in the radio emission of the microflare at the lowest observed frequencies. The top left panel shows the antenna temperature of the intensity signals. The bottom left shows the polarization. The top right panel shows the right-hand circular polarization, and the bottom right panel the left-hand circular polarization. The blue (solid) curves show the signals at 3.09 GHz, red (dashed) to 3.28 GHz, and green (dashed–dotted) to 3.47 GHz. The time is the elapsed time since 10:16:00 UT.
Download figure:
Standard image High-resolution image
All types of signals show an irregular modulation that resembles an under-sampled QPP. The apparent characteristic times of the signal variations of the I, R, and L signals are similar, while the V signal variation has a shorter timescale. Calculating the average time between the peaks, we get it to be 1.4 ± 0.3 s for the I, R, and L signals, and 0.7 ± 0.2 s for the V signal. Those values do not change strongly for the signals measured at different frequencies. The error bars are calculated by the standard deviation of the times between individual peaks in the signals. Unfortunately, it is impractical to support the estimation of the characteristic times of the variability by Fourier or wavelet analyses because of the insufficient number of the observational points per oscillation period and the small number of oscillation cycles.
The time variations of the emissions recorded at different frequencies correlate well with each other. The correlation coefficient of the I signal measured at the lowest frequency, 3.094 GHz, with the I signal at the next frequency, 3.281 GHz, is 0.99; and at 3.469 GHz is 0.96. The correlation coefficients of the L signal at 3.094 GHz with the L signals at 3.281 GHz and 3.469 GHz are 0.99 and 0.95, respectively. For the R signals, they are 0.98 and 0.95, respectively. The V signal at 3.094 GHz correlates with those at 3.281 GHz and 3.469 GHz much poorer, 0.55 and 0.56, respectively. However, the correlation coefficient of the V signals at 3.281 GHz and 3.469 GHz is 0.83. The correlation coefficient between the R and L polarization signals at the frequency 3.094 GHz is 0.98; at the higher frequencies, it exceeds 0.99. Likewise, the correlations of the R and L signals with the I signal are about 0.98.
3. Discussion and Conclusions
We analyzed observations of a solar microflare that occurred in active region 12,628 on 2017 January 25 with the impulsive phase at 10:15:55–10:16:05 UT. In the soft X-ray band, the emission spike was very weak, reaching the B2 level from the B1.5 background. However, the X-ray spectrum of the emission showed the presence of nonthermal electrons with the 5–50 keV energies during the microflare. The morphology of the enhanced EUV emission sources before and during the microflare, together with the magnetogram of the active region (see the bottom right panel of Figure 5) and the geometry of coronal loops, suggest that the energy release takes place in a closed coronal fan magnetic configuration that begins at the sunspot and ends at its northern periphery. The trigger of the microflare is likely to be associated with destabilization of an s-shaped loop that is a part of the coronal fan.
The microflare produced a radio emission detected with RATAN-600 during its scan of the active region that hosted the microflare, at 10:16:12–10:16:24 UT. Thus, RATAN-600 missed the impulsive phase of the microflare only slightly, while it managed to detect the decay phase. During the microflare, RATAN-600 detected a significant increase in the radio emission, by a factor of 5 at about 3 GHz, from this active region in comparison with the previous and next scans that occurred during the quiet periods of time. The radio burst was observed at the lowest observational frequencies of the instrument, 3–4 GHz, and was absent from the higher frequencies. The degree of circular polarization was low, ranging from −0.3 to 0.2.
The intensity I signal and L and R circular polarization signals detected by RATAN-600 show a good correlation with each other, and vary in time with the average time between the peaks of about 1.4 s. The QPP in the I, L, and R signals are almost synchronous. In contrast, the polarization, V, signal has a time variability with the characteristic time of about 0.7 s.
We summarize the possible interpretation of the observed event as follows:
The microflare was initiated by a destabilization of an s-shaped loop situated in a coronal fan structure situated in the north–south direction. The radio emission detected by RATAN-600 resembles SMBs that are frequently detected in more powerful flares. This emission could be caused by the interaction of the nonthermal electrons accelerated in the microflare with the dense plasma of the transition region. The emission originates simultaneously from two opposite footpoints of the coronal fan structure with one footpoint at the sunspot. According to the active region geometry, the footpoints are situated in the meridional direction, and hence the radio emissions generated at the opposite footpoints are observed by RATAN-600 simultaneously. The superposition of the emissions coming from two different microwave sources is suggested by the similarity of the signals detected in the left-hand and right-hand circular polarizations. In this scenario, the observed signals of both polarizations are of the left-hand polarization with respect to the local magnetic field at the footpoints of the coronal fan. The cutoff frequency of the right-hand polarized wave is greater than the electron plasma frequency for all values of the magnetic field, and hence the wave of this polarization cannot escape from the dense plasma of the footpoints, and is not detected. The emissions produced in the opposite footpoints are seen to be of the opposite polarization because the LoS magnetic fields in the opposite footpoints are directed in the opposite directions. In both footpoints, the microwave emission is produced by the plasma mechanism, i.e., by the excitation of electromagnetic waves with the frequency about the local electron plasma frequency.
The electron concentration corresponding to the electron plasma frequency of 3–4 GHz is (1.11–1.95) × 1017 m−3. It is not likely that the observed radio emission is connected with the local magnetic field in the emitting plasma: the signals coming from the footpoints with the opposite magnetic field are rather similar, while the values of the field in those footpoints are not likely to be the same. It is suggested by different areas of the footpoint anchored in the sunspot and in its periphery as seen in the EUV band. The electrons are accelerated somewhere in the coronal part of the fan structure, in a magnetic reconnection site. The reconnection could occur because of the coalescence of the magnetic flux in the destabilized s-shaped loop with a preexisting magnetic field in the fan structure or around it.
The observed variation of the radio emission is irregular, and hence could be classified as an irregular QPP pattern, by analogy with Pi-type pulsations in the Earth's magnetosphere. We need to stress that the use of the term "quasi" emphasizes the irregular nature of the variation, while it points out the presence of a certain characteristic time of the variation, the "quasi-period." The time variability could be produced by several physical processes. For example, the detected characteristic timescale of about one second occurs in the dispersive formation of quasi-periodic fast magnetoacoustic wave trains (e.g., Roberts et al. 1984; Nakariakov et al. 2004). Theoretical modeling demonstrated that the mean period is approximately equal to the width of the fast magnetoacoustic waveguide, e.g., the minor radius of the loop or width of the current sheet (e.g., Shestov et al. 2015; Yu et al. 2017, for recent results). Thus, for a characteristic length scale of 1500 km, which is a typical width of an EUV loop, and a typical coronal active region fast speed of 1000 km s−1, the oscillation period is about the detected values of the quasi-periods. But, in this scenario it is not clear how to explain the observed difference between the quasi-periods of the intensity and polarization of the radio emission. In addition, the formation of a quasi-periodic fast wave train by waveguide dispersion requires some time, more than 10 mean periods of oscillation after its excitation, which is not consistent with the discussed observation.
Other possibilities are the nonstationary coalescence of neighboring magnetic flux tubes (Tajima et al. 1987; Kolotkov et al. 2016), and the magnetic null point oscillation (e.g., McLaughlin et al. 2009; Thurgood et al. 2017). Similar oscillations have been theoretically found to occur during the coalescence of two plasmoids in a reconnecting current sheet (e.g., Jelínek et al. 2017). In these mechanisms, the oscillation period is determined by the fast magnetoacoustic transit time across the plasma nonuniformity, e.g., the width of the interaction region in the case of the coalescence oscillation, the size of the magnetic null point, or a plasmoid. The oscillation could cause some asymmetry of nonthermal electron beams propagating downwards along the opposite legs, resulting in the misbalance of the left- and right-hand polarized signals, which we could observe as the time variation of the parameter V. However, in this scenario, it is not clear what the physical mechanism responsible for this misbalance is that causes the QPP with a period that is about two times shorter than the period of the QPP in the intensity signal.
A similar periodicity appears in a sausage oscillation of a coronal loop (e.g., Kopylova et al. 2007; Nakariakov et al. 2012). The sausage oscillation is an axisymmetric variation of the cross-sectional area of a coronal loop, which could also be considered a variation of the absolute value of the magnetic field. In the leaky regime, the oscillation period is also determined by the transverse fast wave transit time across a coronal plasma nonuniformity such as a coronal loop (e.g., Vasheghani Farahani et al. 2014; Chen et al. 2016; Guo et al. 2016). Sausage oscillations have already been used for the interpretation of 9 and 15 s QPP of gyrosynchrotron emission in a flaring loop (Melnikov et al. 2005), and 1 s quasi-periodic wiggles of microwave zebra patterns during a solar flare (Yu et al. 2013; Kaneda et al. 2018).
In the discussed event, the detection of the longer period, 1.4 s QPP simultaneously in the right-hand and left-hand polarizations, and of the shorter, 0.7 s periodicity in their difference could be interpreted as the manifestation of the simultaneous presence in the flaring loop of the fundamental sausage mode and its second harmonic. A sausage oscillation could modulate the concentration of the nonthermal electrons that precipitate at footpoints of the oscillating loop, by the Zaitsev–Stepanov mechanism (Zaitsev & Stepanov 1982; Nakariakov & Melnikov 2009). The mechanism is based on the periodic variation of the ratio of the minor radii of the oscillating loop near the apex and footpoints by a sausage oscillation. This variation modulates the precipitation rate of nonthermal electrons, resulting in QPP of microwave and hard X-ray emission coming from the footpoints. In this scenario, the fundamental sausage mode modulates the emission at the opposite footpoints in phase, while the shorter-period, second sausage harmonic modulates the emission at the opposite footpoints in anti-phase with each other. The period of the second sausage harmonic is present in the apparent right-hand and left-hand polarization signals coming from the opposite footpoints in anti-phase, and is highlighted in the polarization signal V, which is the difference of the L and R polarizations. This interpretation is also consistent with the estimated ratio of the periods: the shorter period is bigger than half of the longer period, as it should be in a sausage mode because of the geometrical dispersion. However, we should stress that the estimation of the period ratios should be taken with caution because of the very poor statistics of the sampling. In this scenario, the irregular nature of the pulsations could be attributed to the contamination of the data by some other dynamical processes and signal undersampling.
Thus, we conclude that the observed QPP in the microflare are likely to be caused by the superposition of the fundamental and second harmonics of sausage oscillations in the flaring loop, while other mechanisms, e.g., the oscillatory regime of loop coalescence or magnetic null point oscillation could not be rigorously excluded.
QPP of the similar, second periodicities has been already detected with RATAN-600. Bogod & Yasnov (2001) studied long-leaving radio microbursts caused by the plasma mechanism. Those microbursts appeared at sites of a prolonged energy release over several days. The duration of an individual microburst was about 1–2 s, the cadence of 3–5 s, and the fluxes of 0.001–0.1 sfu (Bogod et al. 2001; Bogod & Yasnov 2005). Sub-second QPP of the radio emission in a C2.4 flare were simultaneously detected at 3.58 GHz by RATAN-600, and at 48 GHz by the Siberian Solar spectropolarimeter (Kashapova et al. 2013; Zhdanov et al. 2016), while the specific mechanism for the QPP was not discussed. However, the event discussed in this paper is different from those events by the short duration and the low GOES flare class, and the difference between the characteristic times of the intensity and polarization variations. The ongoing upgrade of RATAN-600 (Bogod 2011), which implements the tracking mode of observations, will allow us to increase principally the duration of observations of an active region of interest, and hence the number of the QPP detections in solar microflares.
This work is supported by the Russian state contract No. AAAA-A17-117011810013-4, the Russian Foundation for Basic Research grant No. 18-02-00045 (A.A.S., V.M.B., E.A.K., T.I.K.) and 17-52-80064 BRICS-A (V.M.N., S.A.), the STFC consolidated grant ST/P000320/1 (V.M.N.), and the budgetary funding of Basic Research program II.16.3.2 "Nonstationary and wave processes in the solar atmosphere" (S.A.).
Footnotes
- 6
V. M. Bogod, T. I. Kaltman, A. A. Pervakov, Yu. V. Sotnikova, and S. A. Trushkin (SAO RAS, Russia) Solar powerful short-term flare in NOAA12628 at 3–4 GHz on 2017 January 25, 10:16:43 UT ATel #10011; on 27 Jan 2017; 13:32 UT Credential Certification: Sergei Trushkin (satr@sao.ru).