


Abstract
We present ALMA Cycle 4 observations of CO(1-0), CO(3-2), and 13CO(3-2) line emission in the brightest cluster galaxy (BCG) of RXJ0821+0752. This is one of the first detections of 13CO line emission in a galaxy cluster. Half of the CO(3-2) line emission originates from two clumps of molecular gas that are spatially offset from the galactic center. These clumps are surrounded by diffuse emission that extends 8 kpc in length. The detected 13CO emission is confined entirely to the two bright clumps, with any emission outside of this region lying below our detection threshold. Two distinct velocity components with similar integrated fluxes are detected in the 12CO spectra. The narrower component (60 km s−1 FWHM) is consistent in both velocity centroid and linewidth with 13CO(3-2) emission, while the broader (130–160 km s−1), slightly blueshifted wing has no associated 13CO(3-2) emission. A simple local thermodynamic model indicates that the 13CO emission traces 2.1 × 10⁹ M⊙ of molecular gas. Isolating the 12CO velocity component that accompanies the 13CO emission yields a CO-to-H2 conversion factor of αCO = 2.3 M⊙ (K km s−1)−1, which is a factor of two lower than the Galactic value. Adopting the Galactic CO-to-H2 conversion factor in BCGs may therefore overestimate their molecular gas masses by a factor of two. This is within the object-to-object scatter from extragalactic sources, so calibrations in a larger sample of clusters are necessary in order to confirm a sub-Galactic conversion factor.
Export citation and abstract BibTeX RIS
1. Introduction
The brightest cluster galaxies (BCGs) at the centers of some galaxy clusters are rich in molecular gas (Edge 2001; Salomé & Combes 2003). Gas-rich BCGs also host luminous emission-line nebulae (Heckman et al. 1989; Crawford et al. 1999) and star formation rates rivaling those of starburst galaxies (McNamara & Jaffe 1994; O'Dea et al. 2008; Tremblay et al. 2015). These cooling signatures are observed preferentially when the central cooling time of the hot intracluster gas falls below 1 Gyr (Rafferty et al. 2008), or when the central entropy lies below 30 keV cm2 (Cavagnolo et al. 2008). The implication is that the molecular gas in BCGs is formed from the cooling of the hot atmosphere.
Uninhibited cooling of the hot atmosphere would produce far more cold gas and star formation than is observed. Instead, the rate of cooling is regulated by active galactic nucleus (AGN) feedback (see McNamara & Nulsen 2007, 2012; Fabian 2012 for reviews). Radio jets launched by the AGN inflate buoyant radio bubbles (X-ray cavities), drive shocks, and generate sound waves, heating the gas throughout the cluster core (e.g., McNamara et al. 2000; Blanton et al. 2001; Fabian et al. 2006). The power output by the AGN is correlated with the cooling rate of the cluster gas in a large sample of groups and clusters (Bîrzan et al. 2004; Dunn & Fabian 2006; Rafferty et al. 2006), indicating that AGN are capable of preventing the bulk of the hot gas from cooling. Residual cooling from the hot atmosphere can then form the observed molecular gas reservoirs. Accretion of this gas onto the AGN likely fuels AGN feedback, establishing a feedback loop by connecting gas cooling to heating (Pizzolato & Soker 2005; Gaspari et al. 2013; Li & Bryan 2014).
A growing body of evidence indicates that AGN feedback plays a direct role in shaping the distribution of molecular gas. In the Perseus cluster, filamentary Hα emission extends radially from the BCG (Conselice et al. 2001; Hatch et al. 2006), with two prominent filaments oriented toward an X-ray cavity (Fabian et al. 2003). The nebular emission is coincident with soft X-rays, molecular hydrogen (Lim et al. 2012), and CO emission (Salomé et al. 2006, 2011). Recent ALMA observations of BCGs have also revealed molecular filaments that trail X-ray cavities (McNamara et al. 2014; Russell et al. 2016, 2017; Vantyghem et al. 2016). This gas has either been lifted directly from the cluster core by buoyantly rising radio bubbles, or it has cooled in situ from hot gas that has been uplifted to an altitude where it becomes thermally unstable (Revaz et al. 2008; McNamara et al. 2016). These gas flows comprise a significant fraction of the total molecular gas mass. Redshifted absorption line measurements in other systems imply that molecular clouds are falling toward the central black hole, perhaps indicating that the clouds return to the central galaxy in a circulation flow (David et al. 2014; Tremblay et al. 2016).
The molecular gas in BCGs is observed predominantly using CO10
as a tracer molecule. Converting the measured intensity of the CO rotational line into a molecular gas mass requires the assumption of a CO-to-H2 conversion factor. This conversion factor, also referred to as the X-factor, is defined as the ratio between H2 column density, N(H2) in  , and integrated intensity of the CO(1-0) line, W(CO) in
  :
:

In the Milky Way and nearby spiral galaxies XCO is calibrated to be 2 
 (K
(K  )−1 (for a review, see Bolatto et al. 2013). However, the Galactic XCO is not universal, and independent calibrations within BCGs are not available. Standard practice has been to adopt the Galactic value with a factor of two uncertainty. This approach is generally justified by the near-solar metallicities at the centers of galaxy clusters. The molecular clouds are also expected to be cold (≪100 K; Ferland et al. 1994), resembling those in the Galaxy. The linewidths of the individual clouds seen in absorption (∼5
  ) are similar to giant molecular clouds (GMCs), further indicating that the cold gas in BCGs resembles Galactic clouds.
Significant deviations from the Galactic XCO are observed in ultra-luminous infrared galaxies (ULIRGs) and jet-driven outflows. The physical conditions of the molecular gas in ULIRGs, which exhibit extreme star formation, differ greatly from those in the disks of normal galaxies. The gas is located in an extended warm phase with volume and column densities that are much higher than in normal disks (e.g., Jackson et al. 1995; Ward et al. 2003). This leads to overluminous CO emission, reducing the standard CO-to-H2 conversion factor to XCO = 0.4 
 (K
(K  )−1 (Downes & Solomon 1998).
Massive outflows of molecular gas can be driven by intense radiation or radio jets (Morganti et al. 2005, 2015; Nesvadba et al. 2006; Feruglio et al. 2010; Alatalo et al. 2011; Dasyra & Combes 2011; Rupke & Veilleux 2011; Sturm et al. 2011; Cicone et al. 2014; Tadhunter et al. 2014 ). The high CO (4-3)/(2-1) ratio in IC 5063 implies that the molecular gas along the jet-driven outflow is optically thin (Dasyra et al. 2016). As a result, the CO-to-H2 conversion factor may be reduced in these systems by an order of magnitude. Simulations of molecules forming along fast outflows powered by quasar-driven winds indicate that the conversion factor should be 25 times lower than Galactic (Richings & Faucher-Giguere 2017).
In this work we present an ALMA Cycle 4 observation of the CO(1-0), CO(3-2), and 13CO(3-2) emission lines in the BCG of the RXJ0821+0752 galaxy cluster. This represents one of the first detections of 13CO within a BCG. Previous observations of NGC 1275 in the Perseus cluster detected both the 13CO(2-1) and 13CO(3-2) lines (Bridges & Irwin 1998), while observations of A1835 and A1068 provided only upper limits (Edge 2001). Due to the lower abundance of 13CO relative to 12CO, the 13CO emission is generally optically thin. As a result, the 13CO emission traces the full volume of its emitting region, allowing a direct measure of its column density. We use this to estimate the total H2 column density, and by extension the molecular gas mass. This provides an estimate of the CO-to-H2 conversion factor that can be compared to the Galactic value in order to evaluate previous mass estimates of BCGs.
RXJ0821+0752 is a cool core galaxy cluster with a BCG that contains one of the largest known cold gas reservoirs (Edge 2001). Its luminous CO emission corresponds to a molecular gas mass of 1010  , assuming the standard Galactic CO-to-H2 conversion factor. Despite the large CO luminosity, no significant 1-0 S series of H2 has been detected. Observations of the CO(1-0) and CO(2-1) lines showed that the molecular gas traces the Hα emission, but is not centered on the galaxy (Salomé & Combes 2004). The IR luminosity of 8.47
 corresponds to a star formation rate of 37
  yr−1 (O'Dea et al. 2008; Quillen et al. 2008). The BCG also hosts significant quantities of dust, with a dust mass of 2.2
 assuming a dust temperature of 40 K (Edge 2001). Unlike other BCGs, the optical emission-line ratios resemble those of H ii regions instead of AGN-dominated regions (Crawford et al. 1999).
Throughout this paper we assume a standard ΛCDM cosmology with H0 = 70  , Ωm,0 = 0.3, and ΩΛ,0 = 0.7. At the redshift of RXJ0821+0752 (z = 0.109; Crawford et al. 1995), the angular scale is 1'' = 2.0 kpc and the luminosity distance is 510 Mpc.
2. Observations and Data Reduction
The BCG of the RXJ0821+0752 galaxy cluster (R.A.: 08:21:02.258, decl.: +07:51:47.28) was observed by ALMA Band 3 on 2016 October 30 and November 4 and Band 7 on 2016 October 1 (Cycle 4, ID 2016.1.01269.S, PI McNamara). These observations covered the redshifted CO(1-0) and CO(3-2) lines at 103.848 GHz and 311.528 GHz, respectively. An additional baseband in the Band 7 observation also covered the 13CO(3-2) line at 297.827 GHz. The remaining three Band 3 basebands (91.857, 93.732, and 105.733 GHz) and two Band 7 basebands (299.554 and 309.680 GHz) were used to measure the sub-mm continuum emission. The observations used a single pointing centered on the BCG nucleus with a primary beam of 60 arcsec at CO(1-0) and 20 arcsec at CO(3-2). The total on-source integration time was 86.7 minutes at CO(1-0) and 22.7 minutes at CO(3-2), each split into ∼6 minute long observations and interspersed with observations of the phase calibrator. The observations used 40 antennas with baselines ranging from 18 to 1124 m for Band 3 and 15–3247 m for Band 7. The frequency division correlator mode was used for the CO(1-0) and CO(3-2) spectral line observations, providing a 1.875 GHz bandwidth with 488 kHz frequency resolution. This corresponds to a velocity resolution of 1.4  at CO(1-0) and 0.47
  at CO(3-2), although the data were binned to coarser velocity channels for subsequent analysis. The remaining basebands were configured with the time division correlator mode with a bandwidth of 2 GHz and frequency resolution of 15.625 MHz. For the 13CO(3-2) line, this corresponds to a velocity resolution of 15.7
  .
.
The observations were calibrated in casa version 4.7.0 (McMullin et al. 2007) using the pipeline reduction scripts. Continuum-subtracted data cubes were created using uvcontsub and clean. Additional phase self-calibration could not be performed because of the very faint nuclear continuum source. The calibration of the water vapour radiometers failed for the CO(3-2) observation, so some streaks associated with the phase calibration remain in the image. Images of the line emission were reconstructed using Briggs weighting with a robust parameter of 2. An additional uv tapering was used to smooth the CO(3-2) and 13CO(3-2) images on scales below 0.1 arcsec. The final CO(1-0) data cube had a synthesized beam of 0 61 × 059 (P.A. −70
 4), and the CO(3-2) data cube was smoothed to match the 13CO(3-2) synthesized beam of 021× 0165 (P.A. 372). The CO(1-0), CO(3-2), and 13CO(3-2) images were binned to 3, 5, and 16
  velocity channels, respectively. All images were centered around the line emission, which corresponds to a redshift of z = 0.109. The rms noise in the line-free channels were 0.5, 1.1, and 0.3 mJy beam−1, respectively. Images of the continuum were created by combining line-free spectral channels from each baseband. No continuum emission was detected from the nucleus of the BCG. Instead, the continuum emission is coincident with the molecular gas, which is consistent with the structure at 1.4 and 5 GHz (Bayer-Kim et al. 2002).
3. Results
3.1. Spectra
The full extent of the molecular gas was well-resolved for all observed spectral lines. A spatially integrated spectrum was extracted for each spectral line from a 68 × 5'' (13.6 × 10 kpc) box encompassing all of the significant line emission. The CO(3-2) and 13CO(3-2) images were smoothed to match the resolution of the CO(1-0) image prior to the spectral extraction. Since the extraction region is much larger than either beam size, the smoothing has little impact on the spectrum. The spectra, shown in Figure 1, are expressed as a brightness temperature:

Here λ is the wavelength of the spectral line, k is the Boltzmann constant, and S is the measured flux density. For spatially resolved spectra, Ω is the solid angle of the spectral extraction region, provided it is much larger than the beam.
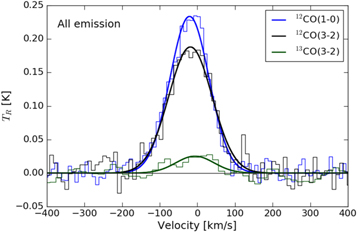
Figure 1. CO(1-0), CO(3-2), and 13CO(3-2) spectra extracted from a 68× 5'' (13.6 × 10 kpc) box encompassing all of the line emission. The CO(1-0) and CO(3-2) spectra have been smoothed to 9  and 10
  , respectively. The spatial resolution of the CO(3-2) and 13CO(3-2) images were degraded to match the CO(1-0) resolution prior to the spectral extraction.
Download figure:
Standard image High-resolution imageThe spectra are all best fit by a single Gaussian velocity component. The 13CO(3-2) spectrum contains a second peak at −80  , but the significance of the second component is below 3σ, so has not been included in these fits. The results of the spectral fitting, including the integrated fluxes (SCOΔv), integrated intensities (
 ), and peak temperatures (Tpeak), are listed in Table 1. The peak temperature is related to the integrated intensity and the line FWHM through Tp = 0.94 WCO/FWHM. The line luminosity,
  , is also included in Table 1. It is defined as (Solomon & Vanden Bout 2005)

where SCOΔv is the flux density in Jy  , DL is the luminosity distance in Mpc, and νobs is the observed frequency in GHz.
Table 1. Spectral Fitting
| Line | Velocity Center | FWHM | SCOΔv | W(CO) | Tpeak |

|
|---|---|---|---|---|---|---|
( ) ) |
( ) ) |
( ) ) |
(K  ) ) |
(K) | ( ) ) |
|
| All emission | ||||||
| CO(1-0) | −20.7 ± 0.6 | 122.1 ± 1.4 | 8.06 ± 0.08 | 30.5 ± 0.3 | 0.235 ± 0.004 | 4.61 ± 0.05 |
| CO(3-2) | −18.3 ± 1.5 | 136.1 ± 3.6 | 65.6 ± 1.5 | 27.3 ± 0.6 | 0.189 ± 0.006 | 4.17 ± 0.10 |
| 13CO(3-2) | −6.4 ± 8.2 | 119 ± 19 | 7.0 ± 1.0 | 3.2 ± 0.4 | 0.025 ± 0.005 | 0.49 ± 0.07 |
| Region tracing 13CO emission | ||||||
| CO(1-0) | 3.2 ± 0.6 | 61.7 ± 2.0 | 1.5 ± 0.1 | 68.5 ± 5.4 | 1.04 ± 0.09 | 0.86 ± 0.06 |
| −19.2 ± 1.3 | 127.2 ± 2.2 | 3.0 ± 0.1 | 137.7 ± 5.4 | 1.02 ± 0.04 | 1.72 ± 0.06 | |
| CO(3-2) | 5.5 ± 1.6 | 60.4 ± 5.3 | 10.4 ± 1.7 | 53.1 ± 8.8 | 0.83 ± 0.15 | 0.66 ± 0.11 |
| −20.5 ± 3.8 | 155.8 ± 7.7 | 24.3 ± 1.8 | 124.1 ± 9.1 | 0.75 ± 0.07 | 1.5 ± 0.1 | |
| 13CO(3-2) | 7.9 ± 1.8 | 84.5 ± 4.3 | 4.09 ± 0.18 | 22.8 ± 1.0 | 0.25 ± 0.02 | 0.285 ± 0.013 |
| Primary clump | ||||||
| CO(3-2) | 24.8 ± 1.6 | 59.0 ± 5.0 | 4.9 ± 0.7 | 65.0 ± 9.6 | 1.04 ± 0.18 | 0.31 ± 0.04 |
| −13.6 ± 4.1 | 152.0 ± 5.7 | 12.5 ± 0.8 | 165 ± 11 | 1.02 ± 0.08 | 0.80 ± 0.05 | |
| 13CO(3-2) | 24.3 ± 2.1 | 86.9 ± 5.0 | 1.96 ± 0.10 | 28.4 ± 1.4 | 0.31 ± 0.02 | 0.136 ± 0.007 |
| Secondary clump | ||||||
| CO(3-2) | −4.7 ± 1.1 | 52.8 ± 3.5 | 6.4 ± 0.7 | 73.1 ± 8.2 | 1.3 ± 0.2 | 0.41 ± 0.04 |
| −42.3 ± 6.7 | 142.5 ± 9.3 | 7.7 ± 0.8 | 87.9 ± 9.3 | 0.58 ± 0.07 | 0.49 ± 0.05 | |
| 13CO(3-2) | −1.8 ± 1.4 | 62.6 ± 3.3 | 1.78 ± 0.08 | 22.1 ± 1.0 | 0.33 ± 0.02 | 0.124 ± 0.006 |
Notes: All linewidths have been corrected for instrumental broadening.
Download table as: ASCIITypeset image
The total integrated CO(1-0) flux, 8.06 ± 0.08  , is consistent within 2σ of the IRAM-30 m single dish measurement of 9.9 ± 1.0
  (Edge 2001; Edge & Frayer 2003). Adopting the Galactic CO-to-H2 conversion factor yields a molecular gas mass of 2
 .
.
In Table 1 we also include the fitted parameters for spectra extracted from a region tracing the 13CO(3-2) emission, which is distributed over smaller spatial scales than the 12CO emission (see Figure 3). This ensures that molecular clouds detected only in 12CO are not biasing the comparisons between 12CO and 13CO. The spectra are shown in Figure 2. Note that the lower resolution of the CO(1-0) image results in some emission lying outside of the extraction region. The resolution of the CO(3-2) images has not been degraded to match the CO(1-0) resolution for these spectra.
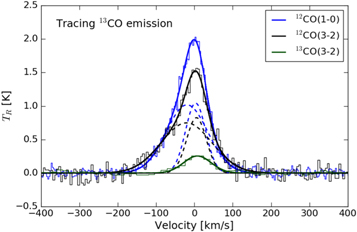
Figure 2. CO(1-0), CO(3-2) and 13CO(3-2) spectra extracted from a region encompassing the two 13CO peaks seen in Figure 3. The 12CO spectra were modeled with two Gaussian velocity components, while the 13CO spectrum was modeled with a single velocity component. The individual components for the 12CO spectra are indicated by dashed lines.
Download figure:
Standard image High-resolution imageThe velocity structure of the CO(1-0) and CO(3-2) lines are very similar. Both spectra have a narrow (60  FWHM) component at approximately 0
  in the adopted frame, as well as a broader (130–160
  ) component that is blueshifted by about 20
  . The linewidths of the narrow components are consistent, while the linewidth of the broader component is larger at CO(3-2) (155.8 ± 7.7
  ) than CO(1-0) (127.2 ± 2.2
  ). The single peak seen in the 13CO spectrum, which is centered at 8 ± 2
  with a linewidth of 84.5 ± 4.3
  , matches well with the narrow 12CO velocity component. No 13CO(3-2) emission corresponding to the broader 12CO line emission has been detected. We refer to these two velocity components seen in the 12CO spectra—one with associated 13CO emission and one without—as 13CO-bright and 13CO-faint.
3.2. Gas Distribution
Maps of integrated flux were created by fitting one or two Gaussian components to the spectrum of each pixel after averaging over the size of the beam. The significance of the line was tested using a Monte Carlo simulation with 1000 iterations, with a detection requiring a significance of 3σ. The integrated flux maps for the CO(1-0), CO(3-2), and 13CO(3-2) transitions are shown in Figure 3. Contours of the CO(3-2) emission are overlaid on an HST WFPC2 F606W image in Figure 4.

Figure 3. Integrated fluxes of the CO(1-0), CO(3-2), and 13CO(3-2) transitions, in units of  . Contours of CO(3-2) emission, ranging from 0.2 to 1.96
  in steps of 0.25
  , have been overlaid on each map. The dashed lines in the center panel indicate the primary (left) and secondary (right) clumps. The dashed line in the bottom panel indicates the region tracing the 13CO emission used to extract the spectra for Table 1. The synthesized beam for each image is shown as the black ellipse in the lower left. Each image shares the same 16.5 × 9.8 kpc field of view.
Download figure:
Standard image High-resolution image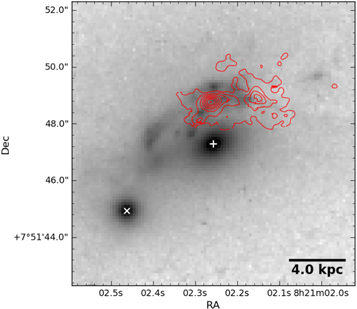
Figure 4. HST WFPC2 F606W imaging of the RXJ0821+0752 BCG overlaid with contours of the CO(3-2) emission obtained from ALMA. The + indicates the BCG nucleus, and the × indicates the centroid of a nearby galaxy that may be interacting with the BCG.
Download figure:
Standard image High-resolution imageThe molecular gas is distributed along an ∼8 kpc long filament, with additional diffuse emission detected in the CO(1-0) map extending toward the northwest. Two clumps of molecular gas are seen in each map, and account for most of the emission. The primary clump, which accounts for 60% of the total CO(1-0) flux, is located at the eastern end of the filament and is 3 kpc north of the BCG nucleus. The secondary clump is 3 kpc west of the primary clump. 13CO emission is only significantly detected near the brightest regions of the primary and secondary clumps. The molecular gas is closely associated with Hα emission (Bayer-Kim et al. 2002; Hamer et al. 2016).
We detect no significant emission centered on the nucleus of the BCG. This spatial offset will be discussed in a forthcoming paper alongside a recent Chandra observation. The 3σ upper limits on integrated flux were computed following McNamara & Jaffe (1994), but using flux instead of intensity:

Here σch is the rms deviation in unsmoothed velocity channels in units of Jy, ΔV is the expected FWHM of the line, which we assume to be 300  , and ΔVch is the velocity width of each channel. Extracting the CO(1-0) spectrum from a 2 kpc × 2 kpc box centered on the optical centroid, we obtain a 3σ upper limit of 0.05
  . This translates to a nuclear molecular gas mass <1.2
 assuming the Galactic CO-to-H2 conversion factor.
The optical imaging shows an arc of excess emission surrounding the northeastern portion of the BCG. The F606W filter covers the wavelength range 4309–6457 Å in the rest frame of the BCG, so does not include Hα or [N ii] emission. The excess emission may originate from bluer emission lines, such as Hβ, or from stellar continuum tracing localized star formation or a tidal event involving a pre-existing stellar population. The arc is oriented toward a galaxy 7.7 kpc to the southeast of the BCG (SDSS J082102.46+075144.9), suggesting a possible interaction.
Bayer-Kim et al. (2002) obtained optical spectra of the BCG along two slits using the Intermediate Dispersion Spectroscopic and Imaging System on the William Herschel Telescope. These slits encompassed two bright blobs along the arc located 1.6 and 4.3 kpc east–northeast of the BCG nucleus. The blobs show elevated blue continuua compared to the surrounding stellar light. The innermost blob, which lies along the inner arc, is best-fitted by an older starburst with mainly A and F stars, while the blob along the outer arc shows a marginal O star component with significant amounts of all other stellar types. These spectra therefore show that the arc of excess emission is associated with recent star formation.
The primary clump of molecular gas and its diffuse extension to the southeast are coincident with small blobs located along the innermost arc. However, the outer arc, which contains the brightest of the optical blobs and extends toward the nearby galaxy, has little to no associated molecular gas. Additionally, the secondary clump extends toward a region with no enhanced optical emission.
3.3. Line Ratios
Important information about the physical state of the molecular gas is encoded in the ratio of brightness temperatures for each of the spectral lines. The CO (3-2)/(1-0) brightness ratio is a function of the gas excitation temperature, Tex, and optical depth (see Equation (6)). The 12CO/13CO (3-2) brightness ratio additionally depends on the relative isotopologue abundances. Throughout this work we adopt the following notation to refer to these line ratios:
In Table 2 we list a number of published measurements of these ratios for comparison. Note that in some cases the published line ratios may be determined from integrated intensities (in units of  ) instead of brightness temperature. For two lines with the same linewidth, these are equivalent. We have opted to use brightness temperature over integrated intensity because brightness temperature is the quantity related directly to Tex and optical depth, and the linewidth of the 13CO-faint component differs between CO(1-0) and CO(3-2).
Table 2. Line Ratios in Other Galaxies
| Object | R10 | R32 | r31 | References |
|---|---|---|---|---|
| RXJ0821.0+0752 | This work | |||
| All emission | ⋯ | 7.6 ± 1.5 | 0.80 ± 0.03 | |
| All emissiona | ⋯ | 8.5 ± 1.1 | 0.895 ± 0.022 | |
| Tracing 13COb | ⋯ | 3.32 ± 0.66 | c0.71 ± 0.15 | |
| Tracing 13COd | ⋯ | >14 | c0.65 ± 0.06 | |
| H ii regions | ||||
| M17 | ⋯ | 3.7 ± 0.9 | 0.76 ± 0.19 | 1 |
| Starburst galaxies | ||||
| M82 | ⋯ | 12.6 ± 1.5 | 0.8 ± 0.2 | 2, 3 |
| NGC 253 | 11.5 ± 1.9 | 11.1 ± 2.2 | 1.08 ± 0.18 | 4 |
| NGC 278 | 8.4 ± 1.3 | 11.4 ± 1.7 | 0.88 | 5 |
| NGC 660 | 15.7 ± 2.0 | 12.8 ± 1.9 | 0.58 | 5 |
| NGC 3628 | 12.2 ± 1.8 | 7.9 ± 1.8 | 0.44 | 5 |
| NGC 4666 | 8.5 ± 1.3 | 11.3 ± 1.7 | 0.49 | 5 |
| NGC 6946 | ⋯ | ∼7 | 1.3 | 6 |
| (U)LIRGs and SMGs | ||||
| Arp 220 | 43 ± 10 | 8 ± 2 | 1.0 ± 0.1 | 7 |
| NGC 6240 | 45 ± 15 | >32 | ≈1 | 7 |
| SMM J2135 | >31 | 20 ± 2 | 0.68 ± 0.03 | 8 |
Notes.
aDetermined using integrated intensity instead of peak temperature. bThe 13CO-bright velocity component. cMeasured from the CO(3-2) image that has been smoothed to match the resolution of the CO(1-0) image. dThe 13CO-faint velocity component.References. (1) Wilson et al. (1999), (2) Petitpas & Wilson (2000), (3) Weißet al. (2005), (4) Harrison et al. (1999), (5) Israel (2009), (6) Wall et al. (1993), (7) Greve et al. (2009), (8) Danielson et al. (2013).
Download table as: ASCIITypeset image
3.3.1. CO (3-2)/(1-0)
From the peak temperatures listed in Table 1, the ratio of CO (3-2)/(1-0) brightness temperatures from the spatially integrated spectra is 0.80 ± 0.03. Using the total integrated intensity instead gives a line ratio of 0.895 ± 0.022. The CO (3-2)/(1-0) intensity ratios in other BCGs that have been observed by ALMA are 0.8–0.9 (McNamara et al. 2014; Russell et al. 2014, 2016; Vantyghem et al. 2016). These are consistent with the ratio observed in RXJ0821, indicating that the excitation of the molecular gas is similar.
For the remaining discussion we restrict the line ratio measurements to the region tracing the 13CO emission. This is to more accurately reflect the excitation conditions of the 13CO-emitting gas, which is used to measure the molecular gas mass in Section 4. The CO(1-0) and CO(3-2) spectral fits for this region, shown in Table 1, were measured at different resolutions. In order to compare these emission lines the CO(3-2) image was first smoothed to the resolution of the CO(1-0) image and the spectrum was re-extracted. The resulting r31 line ratio is 0.71 ± 0.15 for the 13CO-bright velocity component and 0.65 ± 0.06 for the 13CO-faint component. The consistency between these two line ratios implies that the two components share similar gas excitation conditions.
Individual molecular clouds in the Milky Way have mean densities of 300  and temperatures of 10 K, corresponding to a line ratio of r31 = 0.1–0.3 (Scoville & Sanders 1987). The higher line ratio in RXJ0821 is indicative of enhanced molecular excitation, originating from molecular clouds with higher densities and/or temperatures. In external galaxies the intensity ratio is also higher than in individual molecular clouds. Mao et al. (2010) measured r31 in a sample of 125 nearby galaxies, subdividing the sample based on galaxy type. Their mean intensity ratios range from 0.61 ± 0.16 in normal galaxies to 0.96 ± 0.14 in (U)LIRGs. The r31 in RXJ0821, which is derived from peak temperatures instead of integrated intensities, is consistent with the Seyfert and AGN-host galaxy populations. It is also consistent with the r31 measured in H ii regions (e.g., Wilson et al. 1999). The object-to-object scatter in r31 is large, so it cannot be used to unambiguously infer excitation conditions based on galaxies with similar line ratios.
Assuming that the gas is thermalized and the emission is optically thick, the CO (3-2)/(1-0) line ratio can be used to estimate the gas temperature. The Rayleigh–Jeans brightness temperature, TR, for the J  J − 1 transition is given by:

where Tex is the excitation temperature of the transition, ΦA is the area filling factor, Tbg = 2.73(1 + z) K is the background temperature, TJ = hνJ/k = T1J with T1 = 5.3 K for 13CO and 5.5 K for 12CO, and  . If the gas is in local thermodynamic equilibrium (LTE), then each transition will share a common excitation temperature that is equal to the gas kinetic temperature. Provided that the 12CO emission is optically thick,
  and the brightness temperature is independent of optical depth. We also assume that the CO(1-0) and CO(3-2) emission originate from the same regions in the molecular clouds, so the area filling factors are the same.
The ratio of CO (3-2)/(1-0) brightness temperatures for the 13CO-bright component, 0.71 ± 0.14, implies an excitation temperature of Tex ≈ 15 K. Substituting this Tex into Equation (6) for the CO(3-2) line with its original resolution gives an area filling factor of ΦA ≈ 0.1. The excitation temperature is a steep function of the line ratio, particularly when r31 approaches unity. The ±1σ limits on r31, 0.85 and 0.57, give excitation temperatures of 29 K and 9.3 K, respectively.
An excitation temperature of 15 K is comparable to the low values observed in Galactic clouds. However, it is important to note that Tex determined under the assumption of LTE is a lower limit to the actual kinetic temperature of the gas. The two temperatures are equal only when the gas densities exceed the critical density for each transition, which are ∼103  for CO(1-0) and 3
 for CO(3-2). At lower densities the collision rate is too low to thermalize the gas. Reproducing the same line ratio with subthermal gas requires higher temperatures.
3.3.2. 12CO/13CO (3-2)
Studies of the 12CO/13CO intensity ratio are primarily conducted using the J = 1−0 transition (e.g., Solomon et al. 1979; Aalto et al. 1995). Individual GMCs have intensity ratios of R10 = 3–5 (Solomon et al. 1979). In external galaxies, the disks of spiral galaxies exhibit the lowest intensity ratios, with R10 ≈ 6–8. Intermediate ratios (R10 ≈ 10–15) are observed in starburst galaxies, while extreme ratios (R10 > 20) are seen in merging systems (Aalto et al. 1995).
If the 12CO and 13CO emission lines are both thermalized and originate from the same physical region in the molecular gas, then R32 should be comparable to R10. Israel (2009) measured R10, R21, and R32 in a sample of five starburst galaxies, and found that R32 and R10 are consistent to within 50% (see Table 2). The measured R32 in starbursts range from roughly 8–13. Several merging systems also exhibit R32 ratios that are comparable to R10 (e.g., Greve et al. 2009; Danielson et al. 2013). A notable exception is Arp 220, where R10 = 43 ± 10 but R32 = 8 ± 2 (Greve et al. 2009). This difference is attributed to a multi-component molecular gas distribution. The 13CO is primarily located in dense clumps while the bulk of the 12CO emission originates from an envelope of lower-density gas with moderate optical depth (τ ≈ 1) (Aalto et al. 1995).
Considering only the total integrated intensities derived from the spatially integrated spectra, the 12CO/13CO (3-2) line ratio is 8.5 ± 1.1. This global ratio is comparable to the lowest values observed in starburst galaxies. It is also consistent with the R32 seen in Arp 220. However, the molecular gas in gas-rich mergers, such as Arp 220, is generally channeled into warm, dense regions at the center of the galaxy, which is not the case in RXJ0821. Thus the global 12CO/13CO (3-2) intensity ratio in RXJ0821 is most closely matched to the conditions of starburst galaxies.
As noted in Section 3.1, the 13CO emission is only associated with one of the two observed velocity components. Furthermore, the 13CO emission is confined to a much smaller spatial region than the 12CO emission. In the 13CO-bright velocity component extracted from the region tracing the 13CO emission, the 12CO/13CO (3-2) brightness temperature ratio is 3.32 ± 0.66. This R32 is similar to those seen in H ii regions (e.g., Wilson et al. 1999), as well as the R10 in individual GMCs.
The other velocity component detected in 12CO shows no significant 13CO emission. With an rms noise of 0.018 K in the 13CO(3-2) spectrum from Figure 2, the 3σ upper limit on peak 13CO(3-2) brightness temperature corresponds to a 12CO/13CO (3-2) line ratio of >14. The high R32 in the 13CO-faint component implies either a higher 12CO/13CO abundance ratio, a reduced optical depth, or extreme conditions from a gas-rich merger.
The isotopologue ratio is controlled by several processes. (i) 12C is produced primarily in massive stars, while 13C is a secondary product from a later stage of stellar processing. Young stellar ages would therefore enrich the interstellar medium with more 12C than 13C, leading to an increased [12CO]/[13CO] ratio. A top-heavy initial mass function would similarly favor 12C production over 13C. (ii) The lower optical depth of 13CO is less effective at self-shielding from incident UV radiation. This can lead to selective photodissociation, where 13CO is photodissociated throughout a larger fraction of the cloud's volume than 12CO (Bally & Langer 1982). (iii) In cold environments, ionized carbon atoms are exchanged with the CO isotopologues through chemical fractionation (Watson et al. 1976):

where ΔE = 35 K. For clouds below about 30 K the forward reaction is favored and 12CO is converted into 13CO. In hotter environments the reaction reaches an equilibrium. In starburst galaxies the elevated line ratios are attributed to the age of the stellar population. C18O, which is produced alongside 12CO in young stars, is present at normal levels, and only the 13CO is depleted (e.g., Casoli et al. 1992). Early-type galaxies, on the other hand, show boosted 13CO/12CO ratios due to their older stellar populations, which have had time to produce 13C in low-mass stars (Alatalo et al. 2015).
A reduction in optical depth, assuming a constant isotopologue abundance ratio, leads to an increase in R32. Since τ ∝ NCO/Δv, the 12CO optical depth is related to the 13CO optical depth simply through the 12CO/13CO abundance ratio. Evaluating the optical depth from the ratio of 12CO to 13CO brightness temperatures (Equation (6)), an R32 > 14 implies an 12CO optical depth <3.5, assuming Tex = 15 K. Optically thin 12CO emission (τ < 1) would require R32 > 31.
In gas-rich mergers the 12CO/13CO intensity ratio is elevated by turbulent motions introduced by the merger (e.g., Aalto et al. 1995). The turbulent motions increase the linewidth, decreasing optical depth and leading to an increase in the line ratio. Dissipation of this turbulence also heats the molecular gas. The combination of increased linewidth, higher temperatures, and selective photodissociation caused by the decreased 13CO optical depth leads to elevated R32 in merging systems. In RXJ0821 this is unlikely to be the case, as the narrow linewidths (<150  ) are not indicative of turbulence introduced by a merger.
3.3.3. Spatial Variation in Line Ratios
To investigate the spatial variation of the molecular line ratios, we first extract spectra from the two main gas features: the primary and secondary clumps. Both CO(3-2) spectra exhibit the same velocity structure as the composite region tracing the 13CO emission—a narrow peak is located at the systemic velocity and a broader component is blueshifted by about 30  from the narrower peak. The CO(1-0) spectra were not extracted from these regions because the lower resolution moves a significant fraction of the flux outside of the region.
The R32 ratio for the 13CO-bright components of the primary and secondary clumps are 3.4 ± 0.6 and 3.9 ± 0.7, respectively. The main difference between these clumps is the significance of the broad, blueshifted wing. In the primary clump the wing accounts for 70% of the total integrated flux, while in the secondary clump it accounts for only 55%. Computing R32 in these clumps from the total intensity ratio, without isolating the 13CO-bright component, would lead to an artificially high value in the primary clump because of its large linewidth. Instead, the peak temperature ratio of the 13CO-bright component is relatively constant between these two clumps.
A map of the 12CO/13CO (3-2) peak temperature ratio was created using the maps discussed in Section 3.2. The temperature ratio was computed from the CO(3-2) velocity component that was closest in velocity to the 13CO(3-2) emission. When two velocity components are detected, this is generally the more redshifted peak. The map is shown in the top panel of Figure 5. On the finer spatial scales used in the R32 map, the line ratio in the primary clump is slightly elevated relative to the secondary clump. In the primary clump R32 varies from roughly 4–7, with an upward deviation to 12 near the edge of the 13CO(3-2) detection. The secondary clump hosts an R32 that ranges from 3.5 to 5.
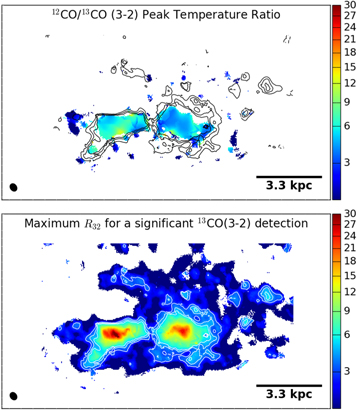
Figure 5. Top: map of the 12CO/13CO (3-2) brightness temperature ratio. The 12CO emission has been modeled by two velocity components. The component used in this map is that with a velocity closest to the 13CO emission. Bottom: the largest R32 that would be detected in these observations, determined from the ratio of 12CO brightness temperature to 3× the rms variation in the 13T32 spectrum. Gas with an R32 below this threshold can be detected at 3σ. The contours in both images correspond to R32,max of 3, 4, and 5.
Download figure:
Standard image High-resolution imageAs the significantly detected 13CO(3-2) emission is confined to the regions that are brightest in CO(3-2), it is important to determine whether 13CO throughout the rest of the gas is undetected because of an anomalously high R32, or if an R32 similar to the rest of the gas would also lie below our detection threshold. To this effect we have created a map of the maximum R32 that would be detectable given the observed 12CO brightness temperature and 13CO noise, R32,max = 12T32/313Trms. This map is shown in Figure 5. Since 12CO emission in the fainter regions cannot be uniquely attributed to the 13CO-bright component, we have computed R32,max for both velocity components and taken the larger value. Gas with an R32 below this threshold would have a peak 13CO temperature large enough to be detected by our imaging.
Overlaid on both images in Figure 5 are contours corresponding to an R32,max of 3, 4, and 5. These are roughly in line with what has been detected throughout the rest of the gas. The primary and secondary clumps fill the majority of a contour of R32,max = 5. Gaps within this contour may indicate slightly elevated line ratios. Outside of the two main clumps, very few regions reach an R32,max of 5. In these outer regions our observations are only sensitive to 13CO(3-2) intensities large enough to yield R32 ≲ 3. As this is smaller than the line ratios observed in the rest of the gas, any 13CO located outside of the two main clumps lies below our detection threshold.
4. CO-to-H2 Conversion Factor
The CO-to-H2 conversion factor, XCO, relates the integrated intensity of a CO line to the H2 column density (see Equation (1)). It can equivalently be expressed in terms of integrated properties:

where the conversion factor αCO is now a mass-to-light ratio relating the total molecular gas mass (which includes a factor of 1.36 to account for heavier elements) to the CO line luminosity in units of  . In the Milky Way and normal galaxies this conversion factor is XCO = 2
 (K
(K  )−1, or equivalently αCO = 4.3
  (
( )−1 (Bolatto et al. 2013).
Here we use the 13CO(3-2) emission line to estimate αCO under the assumption of LTE. We restrict this analysis to the spatial region encompassing the two bright clumps, which is shown in the bottom panel of Figure 3. Additionally, only the 13CO-bright velocity components of the 12CO spectra from this region (Figure 2) are considered. These restrictions ensure that the 12CO and 13CO considered originate from the same molecular gas. As a result, this LTE analysis is only sensitive to a fraction of the total molecular gas mass.
The total 13CO column density can be estimated from the intensity of a single transition 13CO( ) according to (Mangum & Shirley 2015):
Here μ = 0.11 Debye = 0.11  esu is the 13CO dipole moment,
  is the energy of rotational level J, νJ is the frequency of the
  transition, τJ is the optical depth of the transition, and Δv is the full linewidth. Assuming that the population in each rotational level is described by a Boltzmann distribution at a common temperature Tex, the partition function is Q(Tex) ≈ 2Tex/T1 + 1/3, where T1 ≡ hν1/k = 5.3 K. For the 13CO(3-2) transition, this expression becomes
In the limit of optically thin 13CO emission (1 − e−τ ≈ τ), the optical depth τJ can be determined from Equation (6):
This approximation begins to break down at τ ≳ 0.1. In this regime the optical depth derived from Equation (11) must be multiplied by a factor of  . From Section 3.3.1, the excitation temperature and area filling factor are Tex = 15 K and ΦA = 0.1. The corresponding 13CO(3-2) optical depth obtained from Equation (11) is τ3 = 0.30, and the finite optical depth correction evaluates to ≈1.16.
The optical depth can also be determined from the ratio of 12CO and 13CO brightness temperatures:

Note that the dependence on ΦA has reduced out of this expression, as it is assumed that both 12CO and 13CO originate from the same area. This method yields an optical depth of 0.36, which is consistent with Equation (11) after the  correction.
The resulting column density in the optically thin limit, expressed now in terms of integrated intensity (WJ = TR/0.94 Δv), is

and the corrected optical depth is  . For Tex = 15 K, ΦA = 0.1, and 13W32 = 22.8
  , the total 13CO column density is 1.74
 . Assuming the abundance ratios
 ![${[}^{12}\mathrm{CO}]/{[}^{13}\mathrm{CO}]=50$](https://content.cld.iop.org/journals/0004-637X/848/2/101/revision1/apjaa8fd0ieqn78.gif) and [12CO]/[H2] = 10−4 (Dickman 1978; Frerking et al. 1982) yields an H2 column density of
and [12CO]/[H2] = 10−4 (Dickman 1978; Frerking et al. 1982) yields an H2 column density of  = 8.7
= 8.7 
 . The total molecular gas mass is then computed from Mmol = 1.36
 Asource, where Asource = ΦAAreg is the surface area of the molecular gas and Areg = 11.2 kpc2 is the area of the region used to extract the spectra. This gives a total molecular gas mass of 2.1
 .
.
The CO-to-H2 conversion factor is calibrated using CO(1-0) luminosity. Since some CO(1-0) emission is spread outside of this region from its lower resolution, it is estimated from the CO(3-2) luminosity (0.66 
 ; see Table 1) assuming a constant r31 of 0.71. The inferred CO(1-0) luminosity for the 13CO-bright velocity component is
  , giving a CO-to-H2 conversion factor of αCO = 2.26
  (
( )−1. This is half of the Galactic value.
The total luminosity of both CO(1-0) components from within the region tracing the 13CO emission, assuming an r31 of 0.7, is 3 
 . Adopting this total luminosity in place of that from the 13CO-bright component only yields a CO-to-H2 conversion factor of αCO = 0.7
  , which is six times lower than the Galactic value. This is comparable to the standard value of αCO = 0.8
  in ULIRGs and starburst galaxies (Downes & Solomon 1998; Bolatto et al. 2013). However, this conversion factor uses the molecular gas mass that was measured from the single 13CO velocity component, whereas two distinct components were detected at 12CO. Any mass in the 13CO-faint velocity component has therefore been neglected in this measurement.
In order to investigate the dependence of the molecular gas mass measurement on the spatial region used to extract the spectra, we repeat this analysis for the region containing all of the line emission. The line ratio throughout the entire gas distribution is r31 = 0.80 ± 0.03, corresponding to Tex = 22 K and ΦA = 0.0126. The 13CO(3-2) optical depth computed from Equation (12) is 0.14. The total 13CO column density is 1.3 
 , which is slightly lower than the column density obtained from the smaller region. This implies a molecular gas mass of 2.47
 over the 13.6 × 10 kpc box used to obtain the spectra. The corresponding CO-to-H2 conversion factor, using the full CO(1-0) luminosity, is 0.53
  (
( )−1, in close agreement with the smaller region when both velocity components are included in the line luminosity. From these measurements, about 85% of the molecular gas mass traced by 13CO is contained within the primary and secondary clumps.
The absence of 13CO emission from the broad, blueshifted wing implies that the measured molecular gas mass does not trace the entire supply of molecular gas. The molecular gas mass that is traced by the 13CO-bright velocity component is 2.1 
 . Assuming that the CO-to-H2 conversion factor in this parcel of gas is the same as the remainder of the gas, the total CO(1-0) luminosity gives a total molecular gas mass of 1.1
 .
.
4.1. Underlying Assumptions
LTE models are highly simplistic in nature. Several assumptions, both direct and indirect, have been required to enable this analysis. Here we discuss the major assumptions, and comment on how they may affect our results.
4.1.1. 13CO Abundance
Without a direct probe of the H2 content of the molecular gas, converting the measured 13CO column density into an H2 column density requires the assumption of a 13CO abundance. We assumed a CO abundance of [12CO]/[H2] = 10−4 and an isotopologue abundance ratio of [12CO]/[13CO] = 50. The estimated CO-to-H2 conversion factor depends linearly on the assumed [13CO]/[H2]. In many extragalactic observations these quantities are not measured directly, so these assumptions are common.
For cloud metallicities above ∼0.1  the CO/H2 abundance ratio varies linearly with metallicity (Bialy & Sternberg 2015). In cool core clusters the molecular gas is likely formed from the cooling of the hot atmosphere, so the cloud abundance should be related to the metallicity of the hot atmosphere. In RXJ0821 the metallicity is ∼0.4
  within the central 10 kpc of the cluster core, and peaks at ∼0.8
  at about 30 kpc (Bayer-Kim et al. 2002; A. N. Vantyghem et al. 2017, in preparation). If the abundance in the molecular clouds reflects the central metallicity, then the CO/H2 abundance ratio would be overestimatedand, and the CO-to-H2 conversion factor underestimated, by a factor of 2.5. A declining metallicity profile is also observed in Perseus, where Panagoulia et al. (2013) suggested that the missing metals near the core are locked up in cold dust. The molecular clouds may therefore be more metal-rich than the central atmosphere, implying an abundance ratio closer to solar.
The isotopologue ratio of 50 was chosen to represent the midpoint of this observed range in the Milky Way, which increases radially from 24 in the Galactic center to >100 at large radii (Langer & Penzias 1990; Milam et al. 2005). Variations in the isotopologue ratio are controlled by stellar processing, selective photodissociation, and chemical fractionation (see Section 3.3.2). The data available for extragalactic sources seem to indicate that the isotopologue ratio increases with redshift, with values of ∼40 in local starbursts and 100 or higher in ULIRGs (Henkel et al. 2014). An elevated isotopologue ratio in RXJ0821 would bring the measured conversion factor closer to the Galactic value. Reconciling the two would require 12CO/13CO ≈ 100.
4.1.2. 13CO-emitting Area
Throughout this analysis we have assumed that the 12CO and 13CO emission originate from the same emitting area, thus sharing a common area filling factor. This assumption can break down in two ways. First, differences between the 12CO and 13CO optical depths can lead to selective photodissociation of 13CO in the lower-density outskirts of individual molecular clouds. As a result, 13CO will be confined to the central regions of the clouds, while 12CO extends throughout the cloud and is well-mixed with H2. This would decrease the 13CO filling factor, and the measured optical depth must be modified by the ratio of the areas. The true 13CO optical depth would then be underestimated in our analysis, leading to an underestimate in the conversion factor. For significant selective photodissociation, the 13CO emission will originate from a portion of the cloud with different physical conditions than the 12CO emission. The temperature, density, and column density for the gas containing 12CO and 13CO would need to be measured independently.
Second, the 12CO and 13CO may be distributed over different spatial regions in the entire cloud ensemble. In these observations 13CO is detected only in the two bright clumps, while diffuse 12CO encompasses a larger envelope. This may indicate that the diffuse emission contains little 13CO, from little stellar processing, significant selective photodissociation, or other processes that enhance the 12CO/13CO abundance ratio. However, as shown in Section 3.3.3, we can only detect 13CO outside of the two main clumps if the 13CO abundance is abnormally large. By restricing the LTE analysis to the region tracing the 13CO emission (see Figure 3, bottom), we ensure that the 12CO and 13CO emission trace the same cloud ensemble.
4.1.3. Thermal Equilibrium
The fundamental assumption of the LTE model is that each rotational transition can be described by a common excitation temperature that is equal to the kinetic temperature of the molecular gas. This approximation is only satisfied if the density of the molecular gas exceeds the critical density for the transition, which is ∼103  for CO(1-0) and 3
 for CO(3-2). In this regime, collisions with H2 occur rapidly enough to thermalize the CO molecules.
The CO (3-2)/(1-0) peak temperature ratio of 0.71 for the 13CO-bright component implies thermalized emission only if the gas temperature is 15 K. Alternatively, the gas may be hotter and subthermally excited. Subthermal excitation of the CO(3-2) line modeled under LTE conditions can lead to an underestimate in column density. For example, Nishimura et al. (2015) performed an LTE analysis using both 13CO(1-0) and 13CO(2-1) in the Orion GMC. The column density derived using 13CO(2-1) was a factor of three lower than that derived using 13CO(1-0), which they attributed to subthermal excitation.
Within the central 10 kpc of the RXJ0821 galaxy cluster, the pressure of the hot atmosphere is 2 
 (M. T. Hogan et al., private communication). This confining pressure sets the minimum pressure of the molecular clouds. If the gas is in pressure balance, then a kinetic temperature of 15 K corresponds to a density of 9
 , which exceeds the CO(3-2) critical density by a factor of three. The molecular gas should then be thermalized for any temperature up to ∼50 K. Additionally, the pressure in self-gravitating clouds exceeds the confining pressure, indicating that the molecular gas in this system is likely thermalized.
5. Discussion
In the subset of the molecular gas traced by 13CO emission, the CO-to-H2 conversion factor is αCO = 2.26  , or equivalently XCO = 1.04
 (
( )−1. This is the first measurement of XCO in a BCG. Previous works have simply adopted the Galactic value, justifying the decision based on the high metal abundances at the centers of galaxy clusters and the low expected temperature of gas condensing from the hot atmosphere. Our results indicate that XCO in RXJ0821 is half of the Galactic value. Given the high scatter in extragalactic determinations of XCO, this measurement is broadly consistent with the Galactic value. Continuing to adopt the Galactic value in other BCGs may lead to an overestimate of Mmol, but is likely accurate to within a factor of two.
Accurate measurements of the molecular gas mass in BCGs are crucial in understanding the gas origin and its role in AGN feedback. In particular, molecular flows trailing X-ray cavities have been detected in several BCGs (Salomé et al. 2011; McNamara et al. 2014; Russell et al. 2016, 2017; Vantyghem et al. 2016), with the cold gas either lifted directly by the cavities or cooled in situ from uplifted, hot gas. By Archimedes' principle, the maximum mass of uplifted gas is limited by the mass displaced by the X-ray cavities. Each of the observed outflows requires a high coupling efficiency between the cavities and uplifted gas, with the displaced mass exceeding the uplifted molecular gas mass by factors of a few. For example, 1010  of cold gas in A1835 trails the X-ray cavities, which have displaced 3
 of hot gas (McNamara et al. 2014). Reducing the CO-to-H2 conversion factor alleviates the requirement of a high coupling efficiency.
In jet-driven molecular outflows, the outflowing gas may become optically thin while the gas in the disk remains optically thick (Dasyra et al. 2016). In RXJ0821 the 12CO/13CO line ratios in the 13CO-bright component imply 12CO optical depths ≫1, indicating that its molecular gas, which is spatially offset from the galactic nucleus, does not resemble the gas in jet-driven outflows. The 13CO-faint component is also consistent with moderate 12CO optical depths. Extending these results to the gas flows observed in other BCGs implies a gentler lifting process than in fast, jet-driven outflows.
6. Conclusions
We have presented new ALMA Cycle 4 observations of the CO(1-0), CO(3-2), and 13CO(3-2) emission lines in the BCG of the cool core cluster RXJ0821+0752. The is the first detailed study of a 13CO emission line in a BCG. We have used the optically thin 13CO emission to estimate the molecular gas mass without relying on the Galactic CO-to-H2 conversion factor. Our results are summarized as follows.
- 1.The molecular gas is primarily situated in two clumps located 3 kpc north to northwest of the galactic nucleus, with <1.2
 coincident with the BCG nucleus. These clumps and their surrounding diffuse emission are part of an 8 kpc long filament. 13CO(3-2) emission is only detected within the two bright clumps. Any 13CO emission located outside of these clumps lies below our detection threshold.
 - 2.Both of the 12CO spectra extracted from a region tracing the 13CO emission contain two velocity components. The narrower component (∼60 FWHM) is consistent in both velocity centroid and linewidth with the 13CO(3-2) emission. The broader (130–160 ), slightly blueshifted (∼30 ) wing has no associated 13CO(3-2) emission.
- 3.Assuming that the molecular gas is in LTE at a temperature of 15 K, the molecular gas mass traced by the 13CO emission is 2.1 . Isolating the 12CO velocity component that accompanies the 13CO emission yields a CO-to-H2 conversion factor of αCO = 2.26 , which is a factor of two lower than the Galactic value.


Adopting the Galactic conversion factor in BCGs, as is currently the common practice, may lead to slight overestimates of Mmol. However, the factor of two difference between the the measured and Galactic CO-to-H2 conversion factors is comparable to object-to-object variations (Bolatto et al. 2013). Continuing to adopt the Galactic conversion factor in BCGs should be reasonable until this analysis, or a complete excitation analysis, can be conducted in other systems.
We thank the anonymous referee for helpful comments that improved the paper. Support for this work was provided in part by the National Aeronautics and Space Administration through Chandra Award Number G05-16134X issued by the Chandra X-ray Observatory Center, which is operated by the Smithsonian Astrophysical Observatory for and on behalf of the National Aeronautics Space Administration under contract NAS8-03060. A.N.V. and B.R.M. acknowledge support from the Natural Sciences and Engineering Research Council of Canada. B.R.M. further acknowledges support from the Canadian Space Agency Space Science Enhancement Program. A.C.E. acknowledges support from STFC grant ST/P00541/1. A.C.F. and H.R.R. acknowledge support from ERC Advanced Grant Feedback 340442. This paper makes use of the following ALMA data: ADS/JAO.ALMA 2011.0.00735.S, 2012.1.00988.S, and 2016.1.01269.S. ALMA is a partnership of the ESO (representing its member states), NSF (USA) and NINS (Japan), together with NRC (Canada), NSC and ASIAA (Taiwan), and KASI (Republic of Korea), in cooperation with the Republic of Chile. The Joint ALMA Observatory is operated by ESO, AUI/NRAO, and NAOJ. This research made use of APLpy, an open-source plotting package for Python hosted at http://aplpy.github.com.
Footnotes
- 10
When referring to individual transitions, we refer to the most common 12C16O isotopologue as simply CO.