


Abstract
We present multi-wavelength follow-up campaigns by the AstroSat CZTI and GROWTH collaborations in search of an electromagnetic counterpart to the gravitational wave event GW 170104. At the time of the GW 170104 trigger, the AstroSat CZTI field of view covered 50.3% of the sky localization. We do not detect any hard X-ray (>100 keV) signal at this time, and place an upper limit of  , for a 1 s timescale. Separately, the ATLAS survey reported a rapidly fading optical source dubbed ATLAS17aeu in the error circle of GW 170104. Our panchromatic investigation of ATLAS17aeu shows that it is the afterglow of an unrelated long, soft GRB 170105A, with only a fortuitous spatial coincidence with GW 170104. We then discuss the properties of this transient in the context of standard long GRB afterglow models.
Export citation and abstract BibTeX RIS
1. Introduction
The direct detection of gravitational waves (GW) by advanced detectors has commenced the era of GW astronomy (Abbott et al. 2016a). Astronomers from around the world teamed up with the LIGO and Virgo collaborations in the first observing run (O1) to search for electromagnetic (EM) counterparts to the GW candidates (Abbott et al. 2016b, 2016c). Systematic searches for EM counterparts to GW 150914, LVT 151012, and GW 151226 did not find conclusive EM emission associated with them (see, for instance, Aab et al. 2016; Abe et al. 2016; Ackermann et al. 2016; Adriani et al. 2016; Annis et al. 2016; ANTARES Collaboration et al. 2017; Bhalerao et al. 2016; Cowperthwaite et al. 2016; Evans et al. 2016; Kasliwal et al. 2016; Morokuma et al. 2016; Palliyaguru et al. 2016; Racusin et al. 2017; Savchenko et al. 2016; Smartt et al. 2016a, 2016b; Soares-Santos et al. 2016; Tavani et al. 2016, but also note a possible counterpart detected by Fermi GBM, Connaughton et al. 2016). This partnership continues in the ongoing second observing run (O2) of these advanced detectors, and EM partners have been sent several GW candidates for follow-up. The scientific goals of an EM-GW search are to obtain precise source positions to break GW parameter degeneracies, measure source distance and redshift, study the host environment, characterize afterglow evolution, study ejecta composition and nucleosynthesis, and understand source energetics. Detection of EM counterparts can even extend GW detector reach by lowering false alarm rates.
On 2017 January 04 10:11:58.599 UTC, the LIGO Scientific Collaboration and Virgo (LVC) detected a candidate event G268556 and alerted partner astronomers (LIGO Scientific Collaboration & Virgo 2017a). The alert suggested that this was likely the merger of two stellar-mass black holes and provided an event localization with a 50% (90%) credible region spanning 400  (1600
(1600  ). The false alarm probability was lower than one per six months. Offline analysis accounting for calibration uncertainties revised the localization area to a 50% (90%) credible region of about 500
  (2000
(2000  ). Further detailed analysis confirmed the astrophysical nature of this event—now christened GW 170104—with black hole masses of
  and
and  and a redshift of
  . The resultant
  black hole is the second heaviest stellar-mass black hole known to date, exceeded only by GW 150914 (Abbott et al. 2017).
Time-coincident searches for an X-ray counterpart to GW 170104 yielded no significant detections (Section 2.1). Searches for a spatially coincident optical counterpart yielded many candidates, which is unsurprising given the dynamic nature of the optical sky (Jinzhong et al. 2017; Kasliwal et al. 2017b; Lipunov et al. 2017a, 2017b; Singer et al. 2017; Smartt et al. 2017; Tonry et al. 2017; Tyurina et al. 2017). While advances in wide-field optical imaging have overcome the challenge of mapping the coarse localizations of GW triggers, such efforts continue to be plagued by the challenge of false positives i.e., astrophysical events that appear to be both spatially and temporally coincident with the GW trigger but are unrelated (Abbott et al. 2016b and references therein).
Most optical transients discovered in such large-area searches evolve slowly on many-day to week timescales (e.g., supernovae, AGNs). Thus, the report of ATLAS 17aeu (Tonry et al. 2017) fading by 0.7 mag hr−1 caused a ripple of excitement through the EM-GW community.
The GROWTH collaboration24
promptly imaged ATLAS 17aeu with the Large Format Camera (LFC) mounted on the Palomar 200-inch Hale Telescope (P200), the Large Monolithic Imager (LMI) on the Discovery Channel Telescope, the GMG telescope at Lijiang Observatory, and the MITSuME telescope at Akeno Observatory (Section 2.2). We detected the transient and fit a power-law temporal decay of the form  . Intriguingly, the statistically robust power-law fit suggested an explosion time (t0) that was offset from the GW trigger time by 21.5 ± 1.0 hr (Kasliwal et al. 2017a). The prospect of this event being an unrelated, untriggerred or off-axis gamma-ray burst (GRB) was rather small, as there had only been two such optical reports to date: PTF 11agg (Cenko et al. 2013) and iPTF 14yb (Cenko et al. 2015). Nonetheless, we decided to trigger the Swift satellite (Section 3.3), the Karl G. Jansky Very Large Array (VLA) (Section 3.4), and the Arcminute MicroKelvin Imager—Large Array (Section 3.4), and detected both an X-ray and radio counterpart.
With these motivations, upon checking data from the AstroSat Cadmium Zinc Telluride Imager (CZTI) and high-energy archives, we found that a GRB had actually been detected that would be consistent with the explosion time of ATLAS 17aeu (Section 3). Furthermore, AstroSat's localization confirmed that the spatial coincidence was also consistent with this hypothesis (Section 3.2). In this paper, we report the efforts of the AstroSat CZTI and GROWTH collaborations to establish that the panchromatic properties of ATLAS17aeu are simply explained as the afterglow of GRB 170105A, unrelated to GW 170104.
2. GW 170104: The Search for EM Counterparts
2.1. No X-Ray Counterpart
We undertook an offline search for a hard X-ray counterpart to GW 170104 in AstroSat CZTI data. CZTI is a hard X-ray coded aperture mask instrument that functions as an open detector above ∼100 keV (Bhalerao et al. 2017). CZTI has high sensitivity to hard X-ray transients and has detected over 100 GRBs in 18 months of operation.25 Coincidence between the four identical, independent quadrants of CZTI serves as an excellent discriminant between astrophysical transients and instrumental noise.
Based on the refined localization map (LIGO Scientific Collaboration & Virgo 2017b), CZTI covered 50.3% of the GW 170104 probability region at the time of the trigger (Figure 1, top panel). The rest of the localization was obscured by the earth or behind the focal plane. Following typical GRB search procedures for CZTI, data were first reduced with the CZTI pipeline to suppress noisy pixels and to generate event files. We then calculated "dynamic spectra" by binning data in 20 keV, 1 s time bins. The resultant two-dimensional distributions, effectively consisting of light curves in successive energy bins, were scrutinized for any transients. We normalized the light curve at each energy by subtracting the mean count rate and dividing by the standard deviation at that energy. The process was also repeated with 0.1 and 10 s binning. In searches at all three timescales, no transient was detected in a 100 s window centered on the time of GW 170104.

Figure 1. Upper panel: the LIGO sky position probability map for GW 170104, masked to show only the sky visible to CZTI. The red cross marks the boresight of CZTI. Parts of the sky obscured by Earth or by satellite elements are shown in white. The visible area encloses a 50.3% probability of containing the GW source. Lower panel: the upper limits on hard X-ray emission from GW 170104, from a search for 1 s transients. The variation of upper limits with position for other timescales is identical modulo an overall scaling factor.
Download figure:
Standard image High-resolution imageNext, we calculated upper limits on hard X-ray emission from GW 170104. CZTI count rates show slow variations with the longitude of the satellite. The detectors occasionally have flickering pixels, which can create false positives in a transient search. As a result, we used data from neighboring orbits to calculate the minimum counts required for a secure detection. For GW 170104, we measured these noise properties using data from five orbits before and after the trigger (orbit 6867 to 6878). After default data reduction steps, we calculated light curves using events from 20 to 200 keV. These light curves were de-trended using a second order Savitzky Golay filter with a 100 s window. We then calculated a cutoff rate for each quadrant such that the probability of getting counts above that rate in any 100 s window is 10%. Events where the count rates in all quadrants are above the respective cutoff rates in the same time bin are considered secure transient detections, with a false alarm probability of 0.01%. We repeated this process for timescales of 0.1 and 10 s as well, to calculate the respective count rate upper limits. We assumed that the transient spectrum is described by a Band function with GRB-like parameters:  ,
,  , and
, and  . With this spectral model, count rates were converted to direction-dependent upper limits on flux (Figure 1) using a ray tracing code (Rao et al. 2016). Weighting these flux upper limits with the probability of finding the GW counterpart in the respective directions, the effective flux limits over the sky visible to CZTI are
  ,
,  , and
, and  for searches at 0.1 s, 1 s, and 10 s timescales, respectively. For reference, upper limits from other high-energy instruments are given in Table 1.
Table 1. X-Ray and Gamma-Ray Searches for a Counterpart to GW 170104
| Instrument | Search | Search | Search | Energy Range | Flux Limit | Probability | Reference |
|---|---|---|---|---|---|---|---|
| Start | End | Timescale | (keV) |

|
Coverage | ||
| AstroSat CZTI | −50 s | +50 s | 0.1 s | 20–200 |

|
0.50 | This work |
| 1 s |

|
||||||
| 10 s |

|
||||||
| Fermi GBM | −30 s | +30 s | 0.265 s–8.192 s | ⋯ | ⋯ | 0.82 | Burns et al. (2017) |
| INTEGRAL (SPI/ACS) | −100 s | +100 s | 0.1 s |

|

|
0.90 | Savchenko et al. (2017) |
| 1 s |

|
||||||
| 10 s |

|
||||||
| Fermi LAT | 0 s | +10 ks | ⋯ |

|
⋯ | 0.55 | Vianello et al. (2017) |
| AGILE-MCAL | −11.2 s | +1.4 s | 1 s |

|
|
0.37 | Tavani et al. (2017a) |
| Super-AGILE | −100 s | +100 s | 1 s | 20–60 |

|
||
| AGILE-GRIDa | −500 s | +500 s | 2 s |

|

|
0.4 | Tavani et al. (2017b) |
| 100 s |

|
||||||
| CALET HXM | −60 s | +60 s | ⋯ | 7–1000 | ⋯ | 0.37 | Sakamoto et al. (2017) |
| CALET SGM | −60 s | +60 s | ⋯ |

|
⋯ | 0.4 | Sakamoto et al. (2017) |
| CALET CAL | −60 s | +60 s | ⋯ |

|
⋯ | 0.3 | Sakamoto et al. (2017) |
| Lomonosov | −10 hr | +10 hr | 1 s | 20–800 |

|
∼0.5 | Bogomolov et al. (2017) |
| Swift-BATb | −100 s | +100 s | 1 s | 15–350 |

|
0.48 | Lien et al. (2017) |
| MAXI GSCc | 0 s | + 92 minutes | ⋯ | 2–20 |

|
0.80 | Serino et al. (2017) |
| 0 s | + 24 hr | ⋯ |

|
0.86 | |||
| Konus-WIND | −100 s | +100 s | 2.944 |

|
 (5σ) (5σ) |
⋯ | Svinkin et al. (2017a) |
Notes. The probability coverage is the total probability of the gravitational wave source being located in the sky region observed by any instrument. Note that for most instruments, the reported numbers are based on earlier versions of the gravitational wave localization sky map. The probability for CZTI is based on the revised LIGO Scientific Collaboration & Virgo (2017b) sky map.
aTavani et al. (2017b) analyzed data in energy range from 30 MeV to 10 GeV, in timescales from 2 to 1000 s centered on the trigger time. We denote this search range as −500 s to +500 s. bLien et al. (2017) report 4σ upper limits for Swift-BAT. cWe convert upper limits from Svinkin et al. (2017a) to flux by assuming a spectrum with slope −1.1 and normalization at 1 keV.
Download table as: ASCIITypeset image
2.2. ATLAS17aeu: A Candidate Optical Counterpart
ATLAS17aeu was discovered by the Asteroid Terrestrial-impact Last Alert System (ATLAS, Tonry 2011; Tonry et al. 2017) as a fast-fading optical transient in the error region of GW 170104. To determine the nature of the source and any possible association with GW 170104, the GROWTH collaboration undertook the following observations with various telescopes worldwide.
We imaged the position of ATLAS17aeu with the LFC (Simcoe et al. 2000) on the Palomar 200-inch Hale telescope (P200). The LFC data were reduced with standard IRAF tasks and PSF photometry was performed using DAOPHOT. Photometric calibration was done relative to Pan-STARRS DR1 (Chambers et al. 2016; Flewelling et al. 2016). We imaged the location of ATLAS17aeu with the Large Monolithic Imager (LMI) mounted on the 4.3 m Discovery Channel Telescope (DCT) in Happy Jack, AZ. The LMI images were processed using a custom IRAF pipeline for basic detrending (bias subtraction and flat-fielding) and individual dithered images were combined using SWarp (Bertin et al. 2002). Transient photometry was measured using aperture photometry with the inclusion radius matched to the FWHM of the image point-spread function. Photometric calibration was performed relative to point sources from the Sloan Digital Sky Survey (SDSS; SDSS Collaboration et al. 2016).
We observed the optical transient ATLAS17aeu with the 2.4 m GMG telescope at the Lijiang Observatory in Yunnan, China. We obtained an R-band image with the Yunnan Faint Object Spectrograph and Camera (YFOSC) on 2017 January 07 14:55:35 UT. ATLAS17aeu was not detected with a 3σ limit of  mag.
mag.
We undertook optical  , Rc, and Ic band photometric observations of ATLAS17aeu on MJD 57760 with the 50 cm MITSuME telescope at Akeno Observatory, Japan (Kotani et al. 2005). Data were reduced using standard CCD photometry procedures in PYRAF.
We also observed ATLAS17aeu on 2017 January 17.4 with the Wide Field Infrared Camera (WIRC; Wilson et al. 2003) on P200. We obtained a sequence of 52 well-dithered 45 s exposures to allow for accurate subtraction of the sky background, for a total integration time of 2340 s in the J-band. Imaging reductions, including flat-fielding, background subtraction, astrometric alignment, and stacking of individual frames were performed using a custom pipeline. The photometric zero-point of the final image was measured using the aperture photometry of 37 isolated 2MASS stars spread across the field, with the aperture radius set to match the typical seeing in the image. We convert the Vega system magnitudes to AB magnitudes following Blanton & Roweis (2007). We detected nothing at the position of the transient to a 5σ point source limiting magnitude of  mag.
mag.
We summarize all available optical and infrared photometry on the transient in Table 2. For non-detections, we report 5σ upper limits. The early observations of ATLAS17aeu were in the ATLAS cyan band.26
To account for the different bandpasses, we convert our P200/LFC and DCT/LMI multi-band photometry to the cyan filter assuming a power-law spectrum,  , at each epoch. We then jointly fit these two data points along with the ATLAS photometry to a power-law model of the form
  . We refine the measurements of Kasliwal et al. (2017a) and obtain
  and
and  (Figure 2). This is 21.1 ± 1.1 hr after the GW 170104 trigger time (MJD 57757.425), which prompted us to search for any possible high-energy event at this t0.

Figure 2. Left panel: the dashed red lines show a power-law fit of the form  , with α and t0 as free parameters, to the cyan band data of ATLAS17aeu. We measure
  and
and  (MJD), 21.1 ± 1.1 hr after GW 170104. This calculated explosion time is consistent with GRB 170105A, which occurred at MJD 57758.260. The solid black line shows a power-law fit with t0 fixed to the GRB time, and the X-axis shows days since MJD 57758.260. Right panel: all optical and infrared photometry of ATLAS17aeu overplotted with the same power-law fit as the left panel. The X-axis is the time since GW 170104. The solid blue vertical line marks the time of GRB 170105A. Points with downward-pointing arrows are upper limits.
Download figure:
Standard image High-resolution imageTable 2. Optical Observations of GRB 170105A
| Time |
 a
a
|
 b
b
|
Filter | Magc | Telescope | Fluxd | Reference |
|---|---|---|---|---|---|---|---|
| (MJD) | (days) | (days) | (μJy) | ||||
| 57758.0595 | 0.6345 | −0.2003 | g | >17.7 | SWASP/GOTO | <340 | Steeghs et al. (2017) |
| 57758.0595 | 0.6345 | −0.2003 | r | >17.0 | SWASP/GOTO | <580 | " |
| 57758.0920 | 0.6670 | −0.1678 | g | >17.6 | SWASP/GOTO | <370 | " |
| 57758.0920 | 0.6670 | −0.1678 | r | >16.9 | SWASP/GOTO | <640 | " |
| 57758.2100 | 0.7850 | −0.0498 | g | >17.0 | SWASP/GOTO | <650 | " |
| 57758.2100 | 0.7850 | −0.0498 | r | >16.3 | SWASP/GOTO | <1120 | " |
| 57758.3816 | 0.9566 | 0.1218 | i | 18.18 ± 0.04 | Pan-STARRS1 | 207 ± 6 | Chambers et al. (2017) |
| 57758.4130 | 0.9880 | 0.1532 | cyan | 18.05 ± 0.09 | ATLAS | 242 ± 17 | Tonry et al. (2017) |
| 57758.4145 | 0.9895 | 0.1547 | cyan | 18.18 ± 0.1 | ATLAS | 214 ± 17 | " |
| 57758.4267 | 1.0017 | 0.1669 | cyan | 18.22 ± 0.1 | ATLAS | 207 ± 17 | " |
| 57758.4419 | 1.0169 | 0.1821 | cyan | 18.58 ± 0.13 | ATLAS | 148 ± 15 | " |
| 57758.4469 | 1.0219 | 0.1871 | cyan | 18.45 ± 0.11 | ATLAS | 167 ± 15 | " |
| 57758.4479 | 1.0229 | 0.1881 | cyan | 18.34 ± 0.11 | ATLAS | 185 ± 16 | " |
| 57758.4550 | 1.0300 | 0.1952 | cyan | 18.39 ± 0.11 | ATLAS | 177 ± 15 | " |
| 57758.4620 | 1.0370 | 0.2022 | cyan | 18.90 ± 0.18 | ATLAS | 148 ± 24 | " |
| 57759.4647 | 2.0397 | 1.2049 | i | 20.90 ± 0.12 | Pan-STARRS1 | 17 ± 2 | Chambers et al. (2017) |
| 57759.9130 | 2.4880 | 1.6532 | r | >21.7 | Asiago | <8 | Berton et al. (2017) |
| 57760.3181 | 2.8931 | 2.0583 | g' | 22.29 ± 0.03 | LFC/P200 | 4.9 ± 0.1 | This work, Kasliwal et al. (2017a) |
| 57760.3412 | 2.9162 | 2.0814 | i' | 22.05 ± 0.06 | LFC/P200 | 5.8 ± 0.3 | " |
| 57760.4154 | 2.9904 | 2.1556 | g' | >16.6 | Akeno/MITSuME | <590 | This work |
| 57760.4184 | 2.9934 | 2.1586 |

|
>16.5 | Akeno/MITSuME | <530 | " |
| 57760.4556 | 3.0306 | 2.1958 | g' | 22.47 ± 0.05 | DCT | 4.3 ± 0.2 | This work, Cenko & Troja (2017) |
| 57760.4556 | 3.0306 | 2.1958 | r' | 22.10 ± 0.04 | DCT | 5.4 ± 0.2 | " |
| 57760.4556 | 3.0306 | 2.1958 | i' | 21.96 ± 0.04 | DCT | 6.4 ± 0.3 | " |
| 57760.5597 | 3.1347 | 2.2999 |

|
>17.8 | Akeno/MITSuME | <200 | This work |
| 57760.6215 | 3.1965 | 2.3617 | V | >20.0 | Nanshan | <40 | Xu et al. (2017) |
| 57760.6219 | 3.1969 | 2.3621 | R | >21.5 | YFOSC | <4.3 | Kong et al. (2017) |
| 57761.5197 | 4.0947 | 3.2599 | r | 22.77 ± 0.17 | Gemini+GMOS | 2.9 ± 0.4 | Chambers et al. (2017) |
| 57761.5917 | 4.1667 | 3.3319 | I | 22.5 ± 0.3 | TNG/DOLORES | 4 ± 1 | Melandri et al. (2017b) |
| 57761.7681 | 4.3431 | 3.5083 | White | >18.8 | 0.6/0.9 m Schmidt | <110 | Xu et al. (2017) |
| 57770.3790 | 12.9540 | 12.1192 | J | >22.3 | WIRC/P200 | <10 | This work |
| 57785.4027 | 27.9777 | 27.1429 | r' | 23.99 ± 0.06 | DCT | 0.90 ± 0.05 | This work |
| 57828.1296 | 70.7046 | 69.8698 | r' | >24.43 | DCT | <0.5 | This work |
| 57828.1432 | 70.7182 | 69.8834 | i' | >24.05 | DCT | <0.7 | This work |
| 57828.1569 | 70.7319 | 69.8971 | z' | >23.25 | DCT | <1.3 | This work |
Notes. LFC data around MJD 55760.32 are best fit with a power law,  where h is the Planck constant and ν is frequency in Hz. This yields
  and
and  . DCT data around MJD 55760.46 are best fit with a power law,
  , giving
  and
and  .
.
 , using (Schlegel et al. 1998) values from the IRSA extinction calculator at http://irsa.ipac.caltech.edu/applications/DUST/.
Download table as: ASCIITypeset image
3. GRB 170105A: Observations
3.1. X-Ray Detection
We searched AstroSat CZTI data for any transients in the 3σ window given by our preliminary power-law fits to ATLAS and LFC data, and found a burst peaking at 2017 January 05 06:14:06 UT (Sharma et al. 2017). This event was independently discovered and reported as GRB 170105A by the POLAR collaboration (Marcinkowski et al. 2017). This trigger time, MJD 57758.260, is consistent within a 1σ range of the explosion time calculated for ATLAS17aeu in Section 2.2. Inspection of CZTI data showed GRB 170105A had no photons above ∼100 keV—making it much softer than typical GRBs detected by CZTI. T90 measured from quick CZTI analysis27
was 2.86 s, slightly longer than  reported by Marcinkowski et al. (2017). Careful reanalysis of the data allowed us to attain a lower noise floor, leading to detection of longer duration emission from the GRB. We measure
  , and detect 1070 photons in quadrants A and B. The soft spectrum and long T90 confirm that GRB 170105A is a long soft burst (Kouveliotou et al. 1993).
3.2. Localization
GRB 170105A was outside the primary field of view of CZTI, and could not be localized using standard pipelines. A precise position was not available from other high-energy missions either. This motivated us to undertake localization of the GRB from CZTI data using various satellite elements as an effective coded aperture mask.
GRB 170105A was clearly detected in two of the four CZTI quadrants, with some scattered radiation seen in a third quadrant. The fact that we detected soft X-ray photons, but no signal above ∼100 keV, indicates that the photons had a relatively obscuration-free line of sight to quadrants A and B. However, the lack of photons in quadrants C and D suggests obscuration by some satellite component in the line of sight, likely by the CZTI collimators themselves. Based on our experience with similar diagnostics for other GRBs, these criteria allow us to narrow down the GRB location to an octant of the sky. To further refine the localization, we used our raytrace code to calculate the ratio of count rates in quadrants A and B for photons incident at a representative energy of 50 keV. We selected the sky region where the counts ratio from these simulations is within  of the measured background-subtracted counts ratio. This constraint localizes the GRB to a 1148
  area of the sky (Figure 3).
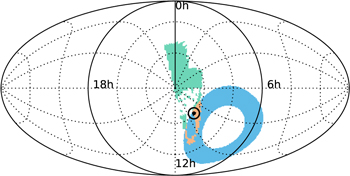
Figure 3. Localization of GRB 170105A by CZTI and IPN. The 2σ CZTI localization (green) spans 1148  , while the IPN annulus (blue) covers ∼2600
  on the sky. The 192
  common region (light brown) includes the location of ATLAS17aeu (black bullseye).
Download figure:
Standard image High-resolution imageSvinkin et al. (2017b) used the Interplanetary Network (IPN) to localize GRB 170105A to a 2600  annulus on the sky. The CZTI and IPN localization regions have an overlap of 192
  . These regions also have some area in common with the LIGO localization of GW 170104. The probabilities that the GW source is contained in the CZTI, IPN and common regions are 6.0%, 20.1%, and 5.5%, respectively.
The position of ATLAS17aeu is consistent with the joint CZTI + IPN localization of GRB 170105A. Based on the temporal (Section 2.2) and spatial coincidence, we conclude that ATLAS17aeu is indeed the afterglow of GRB 170105A.
3.3. X-Ray Properties
GRB 170105A was outside the CZTI primary field of view, so we could not use the standard pipeline for spectral analysis. However, we can calculate some spectral properties of a GRB whose exact position is known by estimating obscuration and scattering by various satellite elements along the line of sight. Based on the arguments in Section 3.2, we now use the position of ATLAS17aeu to calculate the GRB properties.
We modeled the entire satellite in GEANT4 (S. Mate et al. 2017, in preparation), and simulated photons incident from the direction of ATLAS17aeu. GEANT4 accounts for absorption, fluorescence, and coherent and incoherent scattering to give the spatial and energy distribution of observed photons. We repeat these simulations for a range of energies from 20 keV to 2 MeV, taking note of photons in the final range of interest: 20–200 keV. Since the GEANT4 model does not include the intrinsic resolution of the detector, we broaden the derived spectra by a Gaussian kernel with a full width at half maximum of 6 keV. We note that in this method we currently overestimate the flux in various fluorescence lines in the 50–70 keV range, so we ignore this region in further analyses.
Figure 4 shows the observed spectrum of this GRB. The ∼1070 photons are not enough for a detailed spectral analysis. Instead, we define a hardness ratio (HR) as the ratio of counts in 70–200 keV to the counts in 20–50 keV. Using these bands, the HR of GRB 170105A is 1.6 ± 0.3. To put this in the context of other GRBs, we have to take into account the direction-dependent response of CZTI. The T90 and HR analysis of all GRBs detected by CZTI will be reported elsewhere. Here, we take the more straightforward route of comparing it to the simulated HR of other GRBs, assuming they were in the same direction as GRB 170105A in the CZTI reference frame. Our sample comprises GRBs from the GRB Web Service28 (Aguilar 2011) in the time period from 2010 January 1 to 2017 March 9. This service conveniently tabulates the T90 values and Band function spectral parameters for all GRBs. On examining the spectral properties, we find a large number of GRBs with peak energies of exactly 200, 205, or 1000 keV, likely default values in the fit. We also find GRBs with negative values for T90. We omit all these from further consideration, to get a final reference sample of 578 GRBs. We divide the remaining GRBs into short and long based on a cutoff value T90 = 2.0 s. We then simulate the Band model spectra of these GRBs, fold them through our GEANT4 response, and calculate the HR for each. The resultant distribution of HRs shows that GRB 170105A is softer than most GRBs (Figure 5), as noted in the raw spectrum itself. Such a soft spectrum is consistent with the expectations from a long GRB.
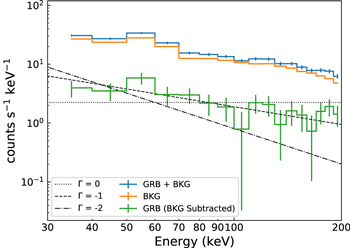
Figure 4. CZTI spectrum of GRB 170105A. The total GRB + background spectrum (top, blue line) was extracted from a time window from T0 −1 s to T0 +20 s. The background spectrum (orange line) was extracted from a larger time window from T0 −596 s to T0 −96 s, where T0 is the GRB 170105A trigger time (2017 January 05 06:14:06 UT). The difference (bottom, green line) shows the GRB spectrum, binned in 10 keV bins. The dotted, dashed and dot-dashed lines show power-law spectra with photon indices  , −1, and −2 respectively.
Download figure:
Standard image High-resolution image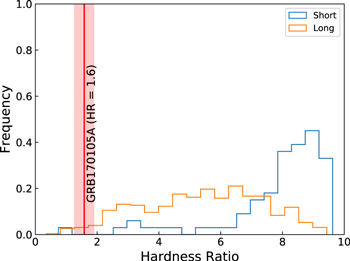
Figure 5. Simulated (70–200 keV)/(20–50 keV) hardness ratio distributions for our GRB sample. We use GRB spectral parameters from the IceCube GRB Web, and simulate CZTI hardness ratios assuming that these GRBs were at the same position as ATLAS17aeu in the CZTI instrument reference frame. The red line and the shaded red region mark HR = 1.6 ± 0.3 for GRB 170105A. We see that it is softer than most long and short GRBs. In particular, only one simulated short hard burst has a smaller hardness ratio than GRB 170105A.
Download figure:
Standard image High-resolution image3.4. Radio Observations
We observed the position of ATLAS17aeu with the VLA in its most extended configuration (A configuration) on three epochs (Corsi et al. 2017), under our approved target of opportunity program.29
Our first two observations of ATLAS17aeu were carried out in the C-band (nominal central frequency of  GHz). Our third and last observation spanned three bands (the S–X–Ku-bands) covering the frequency range 2.8–14 GHz. We used J0921+6215 as the phase calibrator, and 3C286 or 3C48 as the flux density and bandpass calibrators. VLA data were calibrated using the automated VLA calibration pipeline available in the Common Astronomy Software Applications package (CASA; McMullin et al. 2007), and imaged using the CLEAN algorithm. Additional flagging was performed where needed after visual inspection of the calibrated data. Flux errors were calculated as the quadrature sum of the map rms noise, plus a ≈5% fractional error on the measured flux, which accounts for systematics in the absolute flux calibration. Combining all observations, we obtain the source position as R.A. = 09:13:13.91, decl. = +61:05:33.6—consistent with the optical position (R.A. = 09:13:13.89, decl. = +61:05:33.6; Tonry et al. 2017). The source is point-like even at the highest resolution of 0
 23 full width at half power.
ATLAS17aeu was also observed with the AMI-LA (Zwart et al. 2008) radio telescope between 2017 January 08 and 24. Observations were made with the new digital correlator having 4096 channels across a 5 GHz bandwidth between 13 and 18 GHz. The nearby bright source J0921+6215 was observed every ∼10 minutes for complex gain calibration. The AMI-LA data were binned to 8 × 0.625 GHz channels, and subsequently flagged for RFI excision and calibrated with a fully automated pipeline, AMI-REDUCE (cf. Davies et al. 2009; Perrott et al. 2013). Daily measurements of 3C48 and 3C286 were used for the absolute flux calibration, which is accurate to about 10%. The calibrated and RFI-flagged data were then imported into CASA and imaged on a 512 × 512 square pixel grid (4 arcsec pix−1), and flux densities were measured using the pyfits module in Python.
The results of our VLA and AMI follow-up of ATLAS17aeu are given in Table 3 and Figure 6.
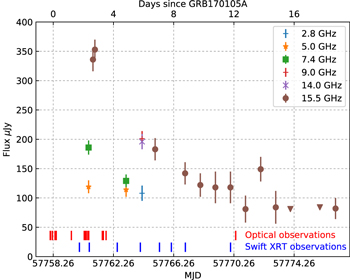
Figure 6. Radio evolution of the afterglow of GRB 170105A. Data are given in Table 3. The bottom axis is in MJD, while the top axis shows the time elapsed since GRB 170105A (MJD 57758.25980). The short red lines at the bottom indicate the epochs of optical observations (Table 2). The short blue lines indicate the epochs of Swift-XRT observations.
Download figure:
Standard image High-resolution imageTable 3. VLA and AMI Observations of ATLAS17aeu
| Time | Instru- | Freq | Flux | Reference |
|---|---|---|---|---|
| (MJD) | ment | (GHz) | (μJy) | |
| 57760.61 | VLA | 5.0 | 119 ± 11 | Corsi et al. (2017)a |
| " | VLA | 7.4 | 186 ± 12 | Corsi et al. (2017)a |
| 57760.90 | AMI | 15.5 | 336 ± 20 | Mooley et al. (2017) |
| 57761.03 | AMI | 15.5 | 353 ± 17 | This work |
| 57763.10 | VLA | 5.0 | 114 ± 12 | " |
| " | VLA | 7.4 | 129 ± 11 | " |
| 57764.16 | VLA | 2.8 | 108 ± 13 | " |
| " | VLA | 9.0 | 201 ± 13 | " |
| " | VLA | 14 | 196 ± 13 | " |
| 57765.03 | AMI | 15.5 | 183 ± 19 | " |
| 57767.02 | AMI | 15.5 | 142 ± 19 | " |
| 57768.03 | AMI | 15.5 | 122 ± 20 | " |
| 57769.03 | AMI | 15.5 | 118 ± 27 | " |
| 57770.03 | AMI | 15.5 | 118 ± 27 | " |
| 57771.03 | AMI | 15.5 | 81 ± 23 | " |
| 57772.04 | AMI | 15.5 | 149 ± 21 | " |
| 57773.04 | AMI | 15.5 | 84 ± 28 | " |
| 57774.01 | AMI | 15.5 | <81 | " |
| 57775.97 | AMI | 15.5 | <84 | " |
| 57777.01 | AMI | 15.5 | 82 ± 18 | " |
Note.
aThese are updated values compared to the 6 GHz flux reported by Corsi et al. (2017).Download table as: ASCIITypeset image
3.5. Host Galaxy
On UT 2017 January 07.5, two days after the explosion, we obtained a low-resolution spectrum of ATLAS17aeu with the Palomar 200-inch Double Beam Spectrograph (Oke & Gunn 1982) covering the wavelength range from 3300 to 10000 Å. The spectrum, with an integration time of 60 minutes, shows no significant absorption or emission features. Specifically, there is no Galactic Hα emission around 6563 Å to a 3σ flux limit of  erg s−1 cm−2 Å −1, disfavoring a cataclysmic variable outburst as the origin. A continuum is detected at least as far blue as 3800 Å, placing an upper limit on the redshift of
  from the absence of a Lyman break. This is consistent with the Gemini/GMOS spectrum reported by Chambers et al. (2017).
With the late-time imaging LMI on the DCT, we did not detect any emission at the location of ATLAS17aeu—limits directly underlying the transient location measured with a 1'' aperture are provided in Table 2. However, we identify a faint source offset from the location of ATLAS17aeu by ≈15 to the east, and measure magnitudes of  and
and  . Using the formalism described in Perley et al. (2012) and galaxy count rates from Hogg et al. (1997), we estimate an a posteriori probability of chance alignment for this source
  . Thus, it is a reasonable host candidate for ATLAS17aeu (see also Melandri et al. 2017a). However, the measured offset of 15 is much larger than is typical for GRB hosts at cosmological distances (Bloom et al. 2002; Blanchard et al. 2016), as GRB host galaxies tend to be quite compact. Stalder et al. (2017) detect a fainter source ("Galaxy A,"
  ) at the exact location of ATLAS17aeu, which may be the host galaxy. Our late-time DCT imaging provides a marginal detection of this source, with magnitudes
  , and
, and  . However, the measurements are low-confidence (2.5σ), and we do not consider it a firm detection. Instead, we provide upper limits in Table 2.
Deep imaging of the afterglow location was obtained with the J-band filter on the NIRC2 camera on Keck II, utilizing laser guide star adaptive optics corrections and obtaining 12 dithered 300 s exposures. We do not detect the galaxy and measure a 5σ point source limiting magnitude of J > 22.8 (Vega mag) or J > 23.7 (AB mag). We caution, however, that this J-band limit is calculated for an unresolved point-spread function—brighter extended sources could be resolved out and remain undetected in our data.
3.6. Afterglow Properties
Light curves of ATLAS17aeu derived from radio (AMI), optical, and Swift-XRT data are shown in Figure 7. The broadband properties of the afterglow appear similar to those of other long GRBs (see Kann et al. 2011; Evans et al. 2009; Chandra & Frail 2012, respectively for optical, X-ray, and radio afterglow studies). The optical flux decays rapidly in the beginning, but appears to slow down significantly after ∼3 days. Radio and X-ray light curves, covering mostly this later period, also show similar, shallow decay slopes. There could be many possible reasons for the flattening of the decay slope, including multi-component jets (Berger et al. 2003), spine-sheath emission (Ramirez-Ruiz et al. 2002), late energy injection (Zhang & Mészáros 2002), enhancement in ambient density (Geng et al. 2014), etc., but the available data do not provide enough information to distinguish between them. There is no obvious signature of a jet break (Rhoads 1999) caused by the sideways expansion of the beamed afterglow.
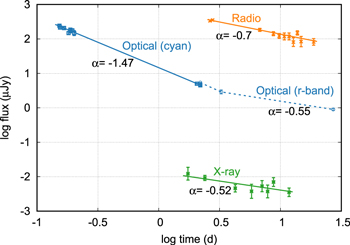
Figure 7. Flux evolution of ATLAS17aeu, the afterglow of GRB 170105A. Radio (AMI) data are shown in orange. In green are shown X-ray fluxes at 1 keV, calculated from publicly available Swift-XRT data, adopting a count-rate to flux scaling from Evans et al. (2017). Optical data are displayed in blue, with the cyan band shown as squares and the r-band as circles. The solid line through each data set represents the best-fit power-law decay with T0 fixed to the time of GRB 170105A (MJD 57758.259803). The slopes of the fitted lines are quoted next to them. The dashed line is not a fit, but just joins the r-band data points.
Download figure:
Standard image High-resolution imageSpectral energy distributions constructed from the VLA data, along with contemporaneous fluxes at higher frequencies evaluated from the light curves in Figure 7, are shown in Figure 8. The overall spectral shape resembles that of synchrotron emission from a GRB afterglow. However, the relatively sparse spectral and temporal coverage of our data cannot rule out the possibility of physically distinct emission regions (for example, a forward and a reverse shock) being involved at different bands.

Figure 8. Broadband spectral energy distributions (SED) of ATLAS17aeu, the afterglow of GRB 170105A. The different colors show the SED evaluated at the three epochs of VLA observations (Table 3). The 15.5 GHz, optical, and X-ray points in this figure are obtained from the light-curve fits shown in Figure 7. The optical flux at the first epoch is evaluated from the cyan band fit, while those as the latter two epochs are from the line joining the r-band points. To guide the eye, dotted black lines with indicated spectral slopes are shown alongside the SED.
Download figure:
Standard image High-resolution image
4. Summary
AstroSat CZTI covered 50.3% of the GW 170104 probability region on sky, but did not detect any temporally coincident excess hard X-ray emission. We calculate a flux upper limit of  for any emission from this event, at 1 s timescales.
We collected data from various optical telescopes worldwide and fit a power law to the optical light curve of ATLAS17aeu to discover that the explosion time of this transient is offset from the gravitational wave trigger by 21.1 ± 1.1 hr, but temporally consistent with GRB 170105A. Combining this information with AstroSat CZTI and IPN localizations of the GRB, we conclude that ATLAS17aeu is the afterglow of GRB 170105A. We examine the multi-wavelength observations of ATLAS17aeu in the context of standard afterglow models, and conclude that the observations are broadly consistent with typical long GRB afterglows.
Our effort demonstrates the advantage of having a wide network of instruments for EM follow-up of gravitational wave candidates. GRB 170105A was not detected by the sensitive Swift, Integral, or Fermi satellites—but this keystone of our inference was obtained from the relatively new AstroSat CZTI and POLAR instruments. This underscores the importance of developing more broadband, truly all-sky monitors, lest we risk missing any interesting transients or EM counterparts to gravitational wave sources.
The extensive multi-wavelength data obtained from this source demonstrates the efficacy of the GROWTH network for transient follow-up. In future observing runs of advanced gravitational wave detectors, such active collaboration among a geographically well-distributed network of telescopes with diverse capabilities should play a key role in the detection and characterization of EM counterparts to GW sources.
The CZT Imager is built by a consortium of Institutes across India. The Tata Institute of Fundamental Research, Mumbai, led the effort with instrument design and development. Vikram Sarabhai Space Centre, Thiruvananthapuram provided the electronic design, assembly, and testing. ISRO Satellite Centre (ISAC), Bengaluru provided the mechanical design, quality consultation, and project management. The Inter-University Centre for Astronomy and Astrophysics (IUCAA), Pune did the Coded Mask design, instrument calibration, and Payload Operation Centre. The Space Application Centre (SAC) at Ahmedabad provided the analysis software. The Physical Research Laboratory (PRL) Ahmedabad provided the polarization detection algorithm and ground calibration. A vast number of industries participated in the fabrication and the university sector pitched in by participating in the test and evaluation of the payload. The Indian Space Research Organisation funded, managed, and facilitated the project.
This work was supported by the GROWTH project funded by the National Science Foundation under grant No. 1545949. GROWTH is a collaborative project between California Institute of Technology (USA), Pomona College (USA), San Diego State University (USA), Los Alamos National Laboratory (USA), University of Maryland College Park (USA), University of Wisconsin Milwaukee (USA), Tokyo Institute of Technology (Japan), National Central University (Taiwan), Indian Institute of Astrophysics (India), Inter-University Center for Astronomy and Astrophysics (India), Weizmann Institute of Science (Israel), The Oskar Klein Centre at Stockholm University (Sweden), Humboldt University (Germany). The authors acknowledge the support of the Science and Engineering Research Board, Department of Science and Technology, India.
These results made use of the Discovery Channel Telescope at Lowell Observatory. Lowell is a private, non-profit institution dedicated to astrophysical research and the public appreciation of astronomy, and operates the DCT in partnership with Boston University, the University of Maryland, the University of Toledo, Northern Arizona University, and Yale University. The Large Monolithic Imager was built by Lowell Observatory using funds provided by the National Science Foundation (AST-1005313). The author(s) also acknowledge the support of the Japan Society for the Promotion of Science. We acknowledge support for the MITSuME Telescope at Akeno by the Inter-University Research Program of the Institute for Cosmic Ray Research, the University of Tokyo. We thank Yoichi Yatsu, Yutaro Tachibana, Yoshihiko Saito, and Kotaro Morita for help with the Akeno observations. The AMI telescope team gratefully acknowledges support from the European Research Council under grant ERC-2012-StG-307215 LODESTONE, the UK Science and Technology Facilities Council (STFC) and the University of Cambridge.
A.C. acknowledges support from the National Science Foundation under CAREER grant No. 1455090. V.B. acknowledges support from the INSPIRE program of the Department of Science and Technology, Government of India. J. Mao is supported by the National Natural Science Foundation of China 11673062, 11661161010, the Hundred Talent Program of the Chinese Academy of Sciences, the Major Program of the Chinese Academy of Sciences (KJZD-EW-M06), and the Oversea Talent Program of Yunnan Province.
This research has made use of the NASA/ IPAC Infrared Science Archive, which is operated by the Jet Propulsion Laboratory, California Institute of Technology, under contract with the National Aeronautics and Space Administration. PyRAF is a product of the Space Telescope Science Institute, which is operated by AURA for NASA.
Software: Python (van Rossum 1995), Astropy (The Astropy Collaboration et al. 2013), Numpy (van der Walt et al. 2011), Scipy (Jones et al. 2001), DAOPHOT (Stetson 1987), FTOOLS (Blackburn 1995), GEANT4 (Agostinelli et al. 2003), CASA (McMullin et al. 2007), AMI-REDUCE (Davies et al. 2009; Perrott et al. 2013), IRAF (Tody 1986, 1993).
Footnotes
- 24
Global Relay of Observatories Watching Transients Happen; http://growth.caltech.edu/.
- 25
CZTI GRB discoveries are distributed as GCN circulars and reported online at http://astrosat.iucaa.in/czti/?q=grb.
- 26
ATLAS filter details are available at http://www.fallingstar.com/specifications.php.
- 27
T90 is defined as the interval during which 90% of the counts from the GRB are received, starting from the instant when 5% of the total counts are observed (Koshut et al. 1995).
- 28
- 29
VLA/16A-206; PI: A. Corsi.