


Abstract
We report the detection of the 1.3 mm continuum and the molecular emission of the disks of the young triple system SR24 by analyzing ALMA (The Atacama Large Millimeter/Submillimter Array) subarcsecond archival observations. We estimate the mass of the disks (0.025 M☉ and 4 × 10⁻⁵ M⊕ for SR24S and SR24N, respectively) and the dynamical mass of the protostars (1.5 M☉ and 1.1 M☉). A kinematic model of the SR24S disk to fit its C18O (2-1) emission allows us to develop an observational method to determine the tilt of a rotating and accreting disk. We derive the size, inclination, position angle, and sense of rotation of each disk, finding that they are strongly misaligned ( ) and possibly rotate in opposite directions as seen from Earth, in projection. We compare the ALMA observations with 12CO SMA archival observations, which are more sensitive to extended structures. We find three extended structures and estimate their masses: a molecular bridge joining the disks of the system, a molecular gas reservoir associated with SR24N, and a gas streamer associated with SR24S. Finally, we discuss the possible origin of the misaligned SR24 system, concluding that a closer inspection of the northern gas reservoir is needed to better understand it.
Export citation and abstract BibTeX RIS
1. Introduction
Multiple stellar and protostellar systems are commonly found in the Galaxy (e.g., Duchêne & Kraus 2013; Tobin et al. 2016, and references therein). Given the low probability of the stellar encounter and capture scenario in the average stellar density galaxy (Thies et al. 2005; Salyk et al. 2014), multiple systems primarily form via either turbulent fragmentation of the molecular cloud (e.g., Offner et al. 2010), fragmentation of an initially inhomogeneous rotating and infalling core (e.g., Boss & Keiser 2014), or fragmentation of a protostellar disk through gravitational instability (e.g., Stamatellos & Whitworth 2009; Vorobyov & Basu 2010; Kratter & Murray-Clay 2011).
If the multiple system is formed in a rotating core or a fragmenting massive disk, aligned co-rotating disks are expected, while in the case of turbulent fragmentation, a multiple system with misaligned disks can be formed (Bate 2000). A misaligned system can also be formed in a denser, more clustered environment, where gravitational interactions between its members or even captures of passing-by (proto)stars can become relevant. The infall of material with an odd angular momentum onto one of the protostellar disks of the multiple system may also produce a tilt on its inclination, leaving the system misaligned. Therefore, studying disk alignment can provide answers on how a young multiple system has formed.
A number of these misaligned young multiple systems have been observed. Optical polarimetric observations (e.g., Monin et al. 2006), misaligned outflows (e.g., Lee et al. 2016), direct imaging of disks (Stapelfeldt et al. 1998; Kang et al. 2008; Ratzka et al. 2009; Roccatagliata et al. 2011), and more recently, high-angular resolution of a disk's gas kinematics (Jensen & Akeson 2014; Salyk et al. 2014; Williams et al. 2014) constitute the evidence for misaligned circumstellar disks in multiple systems. In addition, most of these systems are wide binaries (separations  au), suggesting the necessity of turbulent gas motions or gravitational interactions in their formation. In this contribution, we present ALMA millimeter observations toward the triple system SR24, showing that disks in this system are strongly misaligned and possibly counter-rotating in projection.
SR24 is a hierarchical triple system situated on the outskirts of the Ophiuchus molecular cloud (d = 120 pc, Loinard et al. 2008), southwest of clump E of L1688 (Struve & Rudkjøbing 1949). The system comprises three T Tauri protostars (SR24S, SR24Nb, and SR24Nc, following the notation by Correia et al. 2006) with estimated spectral types and masses of K2, K4-M4, and K7-M5, and  , 0.6, and 0.3 M☉, respectively (Correia et al. 2006). Their ages range
  (Potter 2003). When convenient, we use SR24N to refer to the Northern close binary system, which, from 1991 to 2004, changed the projected separation between SR24Nb and SR24Nc from
  to
to  , rotating in a clockwise direction (proper motions measurements along four epochs can be found in Figure A.2 of the appendix A of Correia et al. 2006, and see also references therein). Likewise, SR24N is separated from SR24S by
  (Reipurth & Zinnecker 1993) in a north–south direction. Infrared excesses (Greene et al. 1994), Hα emission and Li absorption (Martin et al. 1998), and 10 μm silicate emission (Nuernberger et al. 1998), all found toward SR24N and SR24S, are clear signposts of the presence of circumstellar accretion disks. Moreover, HST and H-band polarization intensity images (Potter 2003), along with a coronograph IR image of SR24 (Mayama et al. 2010) showed the emission due to the scatter of the stellar light in the circumstellar dust and gas of the SR24N and SR24S disks, with measured radii of
  and
and  , respectively. At millimeter wavelengths, only the continuum emission from SR24S has been detected (Reipurth et al. 1993; Andre & Montmerle 1994; Nuernberger et al. 1998; Pinilla et al. 2017), suggesting that only the warm dust at the inner part of the SR24N disk is still present while lacking the cold circumstellar dust of the outer part. Recent high-angular resolution (sub)millimeter observations of the SR24S circumstellar disk (Andrews & Williams 2005; Patience et al. 2008; Isella et al. 2009; Andrews et al. 2010; Ricci et al. 2010; Pinilla et al. 2017) unveiled the presence of an
  cavity at its center, making it a good candidate for an insight study on transitional disks. Molecular CO observations also detected the emission from the SR24S disk (Andrews & Williams 2005; Patience et al. 2008; Isella et al. 2009). The detected width of the CO (2-1) disk line is ∼2 km s−1, indicating the presence of a moderately inclined disk (Isella et al. 2009). Additionally, slightly north of the SR24N position, there is a CO molecular extended source, which probably covers the molecular emission from the SR24N disk. Interestingly, this source is stronger than the CO emission coming from the SR24S position (Andrews & Williams 2005). Other environmental features that have been reported via optical and infrared scattered light observations (Potter 2003; Mayama et al. 2010) include: (i) a bridge between the two disks that expands and bifurcates into a filamentary structure, and (ii) a proposed spiral arm southwest of the SR24S disk.
The paper is organized as follows. In Section 2, we describe the ALMA observations. In Section 3, we present the main results obtained from the ALMA observations. In Section 4, we discuss our findings. Finally, in Section 5, we make a summary of this work.
2. Observations
2.1. ALMA Archive Observations
The data analyzed here come from two observations taken in the ALMA Cycle 1 (projects 2013.1.000912.S and 2013.1.00498.S). These projects focused on the study of the SR24S disk properties as inferred from the 1.3 mm (227 GHz) continuum and several CO isotopologues. Here, we explain the geometry of the disks using the continuum emission and the 12CO (2-1) and C18O (2-1) lines. We also discuss the nature of the 12CO (2-1) extended emission in the SR24 triple system.
We built a 1.3 mm continuum image and a C18O (2-1) velocity cube using the data collected on 2015 September 26 (project 2013.1.000912.S). The time on source was 23.3 minutes. At that time, ALMA had 34 operative antennas with baselines ranging up to 2270 m. During the observations, the median system temperature was about 70 K. The phase center was at  ), and the FWHM of the primary beam of the telescope was
  at the observing frequency. The ALMA digital correlator was set to have two continuum windows (2000 MHz width) and two additional spectral windows (1875 MHz width), most of which where line-free and were hence added to the continuum after removing the line channels. The four windows were centered at 219.550, 220.383, 234.507, and 232.987 GHz. Observations of the asteroid Pallas were used to set the absolute scale for the flux density calibration. The quasar J1517–2422 was used to correct for bandpass and the quasar J1617–2537, observed every 10 minutes, was used to extract the time-dependent gains and calibrate the phases and amplitudes. We self-calibrated and cleaned the final continuum image three times and applied a mask surrounding the two main sources detected in SR24. The data were calibrated, imaged, and analyzed using CASA (McMullin et al. 2007), KARMA (Gooch 1996), MIRIAD (Sault et al. 1995), and GILDAS4
packages. The final 7.5 GHz continuum image was obtained using natural weighting. Its synthesized beam is
at the observing frequency. The ALMA digital correlator was set to have two continuum windows (2000 MHz width) and two additional spectral windows (1875 MHz width), most of which where line-free and were hence added to the continuum after removing the line channels. The four windows were centered at 219.550, 220.383, 234.507, and 232.987 GHz. Observations of the asteroid Pallas were used to set the absolute scale for the flux density calibration. The quasar J1517–2422 was used to correct for bandpass and the quasar J1617–2537, observed every 10 minutes, was used to extract the time-dependent gains and calibrate the phases and amplitudes. We self-calibrated and cleaned the final continuum image three times and applied a mask surrounding the two main sources detected in SR24. The data were calibrated, imaged, and analyzed using CASA (McMullin et al. 2007), KARMA (Gooch 1996), MIRIAD (Sault et al. 1995), and GILDAS4
packages. The final 7.5 GHz continuum image was obtained using natural weighting. Its synthesized beam is  with a
  and its rms noise level is 44 μJy beam−1. The C18O (2–1) velocity cube was obtained after applying the selfcal solution. The synthesized beam of the C18O data is
  with a
  and an rms noise level of 1.2 mJy beam−1 per 1.35 km s−1 channel.
The 12CO (2-1) data set was obtained on 2015 July 21 (project 2013.1.00498.S). SR24 was observed with 44 ALMA 12 m antennas for 12.6 minutes, with 946 baselines ranging from 15.1 to 1600 m. During the observations, the median system temperature was about 95 K. The phase center was at  ). The ALMA correlator setup included eight spectral windows ranging in frequency from 215 to 233 GHz. One of these windows, centered at 230.714 GHz, covers 469 MHz and contains the 12CO (2-1) transition (
 GHz). This spectral window has 1920 channels, providing a spectral resolution of 244 kHz, which results in 0.3 km s−1 at the observing frequency. In this case, Saturn's moon Titan was used as the absolute flux calibrator and the quasars J1517–2422 and J1627–2426 were used to get the bandpass and the gains corrections, respectively. CASA, KARMA, and Miriad were again used to calibrate, image, and analyze the 12CO data. Two 12CO velocity cubes were obtained. The first velocity cube was obtained after applying a uv-taper to stress the extended 12CO emission. This image has a synthesized beam size of
  with a
  , and it has an rms noise level of 4.6 mJy beam−1 in the binned channels of 0.6 km s−1. A second velocity cube was made with a natural weighting, which results in a
  with a
  synthesized beam and an rms noise level of 5.2 mJy beam−1 per 0.6 km s−1 channel.
2.2. SMA Archive Observations
The observations were obtained with the Submillimeter Array5
during 2004 August 2, when the array was in its compact configuration. The data were taken with seven antennas and double-sideband receivers with an IF frequency of 225.494 GHz. The zenith opacity (τ at 230 GHz) measured with the NRAO tipping radiometer located at the Caltech Submillimeter Observatory was ∼0.1, which indicates good weather conditions. The 12CO(2-1) millimeter line at a frequency of 230.538 GHz was centered in the upper sideband. The digital correlator of the SMA was configured with 2 GHz bandwidth in each sideband and a spectral resolution of 1.06 km−1 (∼0.8 MHz) per channel. The phase center was at  . Both objects SR24S and SR24N fall well inside of the SMA FWHM (
 ) for this wavelength. The total on-source integration time for SR 24 was 1.7 hr.
Observations of Uranus provided the absolute scale for the flux density calibration. The gain calibrators were the quasars J1743−038 and J1733−130, while Callisto was used for bandpass calibration. The uncertainty in the flux scale is estimated to be between 15% and 20%, based on the SMA monitoring of quasars.
The data were analyzed in the standard manner using the IDL-based MIR software package6
and MIRIAD. We used the ROBUST parameter of CLEAN set to 2 in order to obtain a better sensitivity, losing some resolution. The resulting line-image rms was 40 mJy beam−1 per channel at an angular resolution of  with
with  .
.
3. Results
3.1. Continuum Emission from the Disks
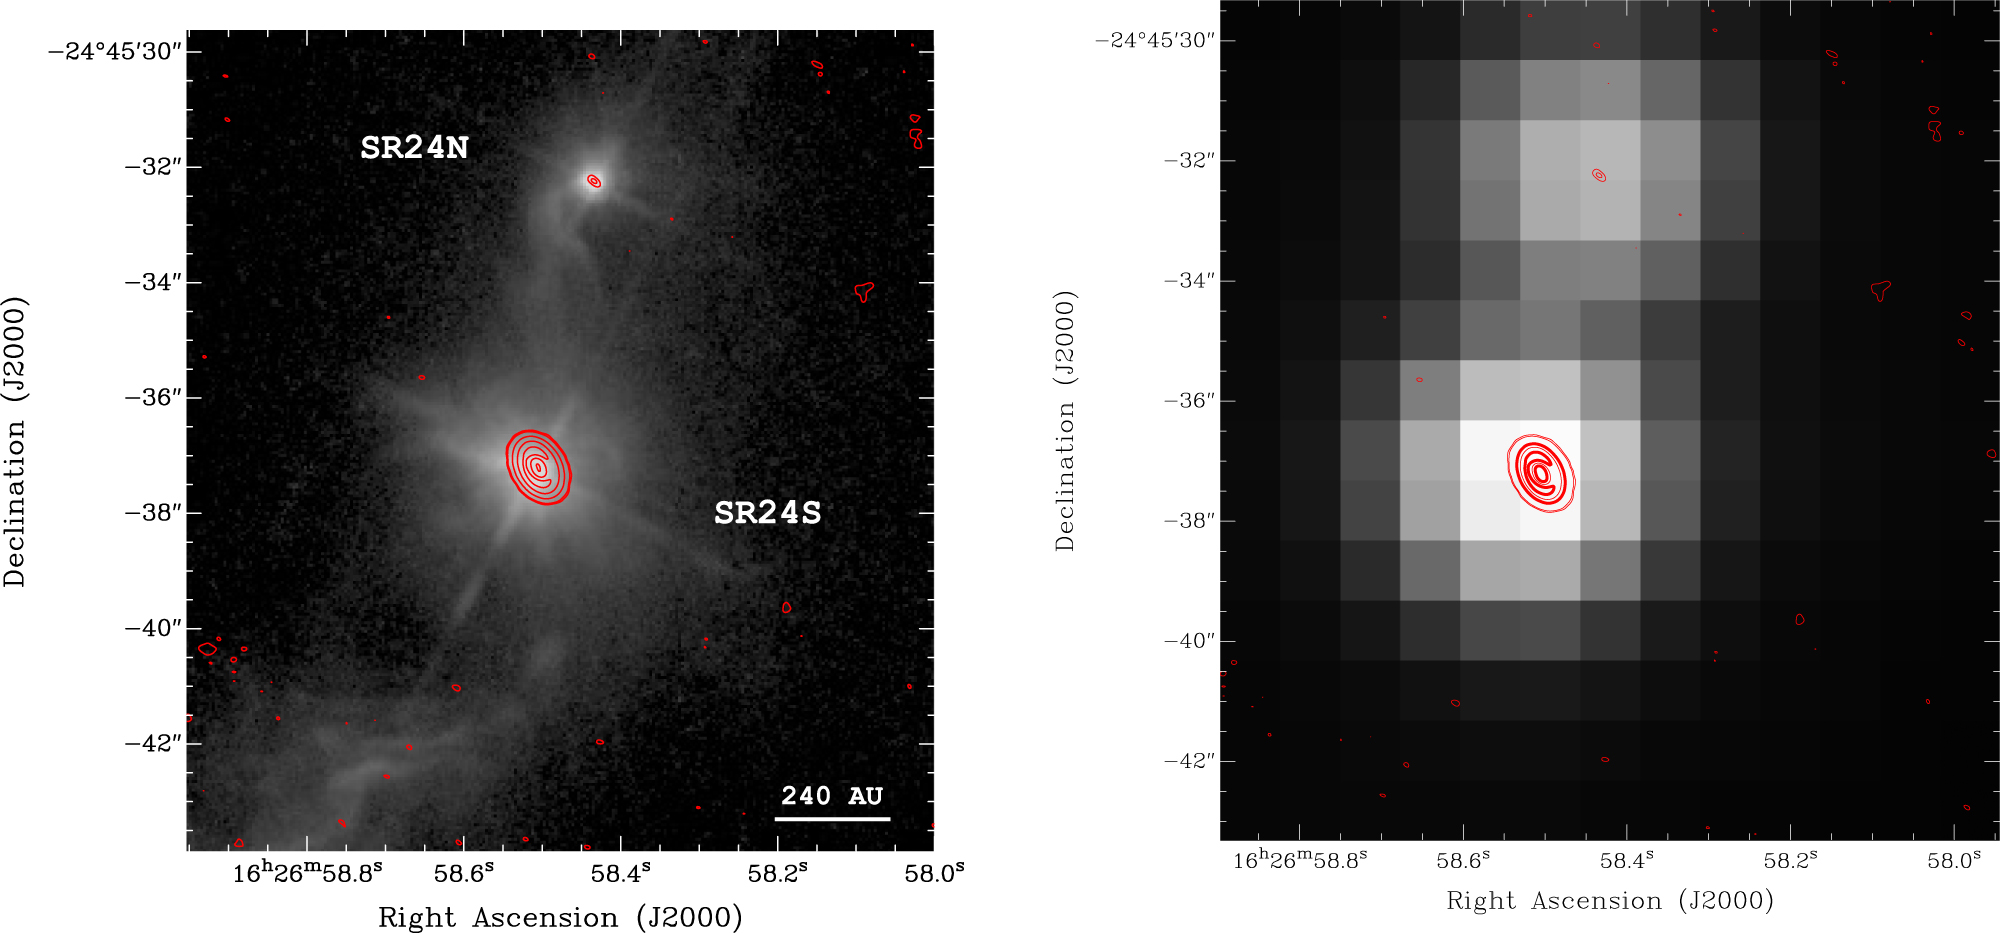
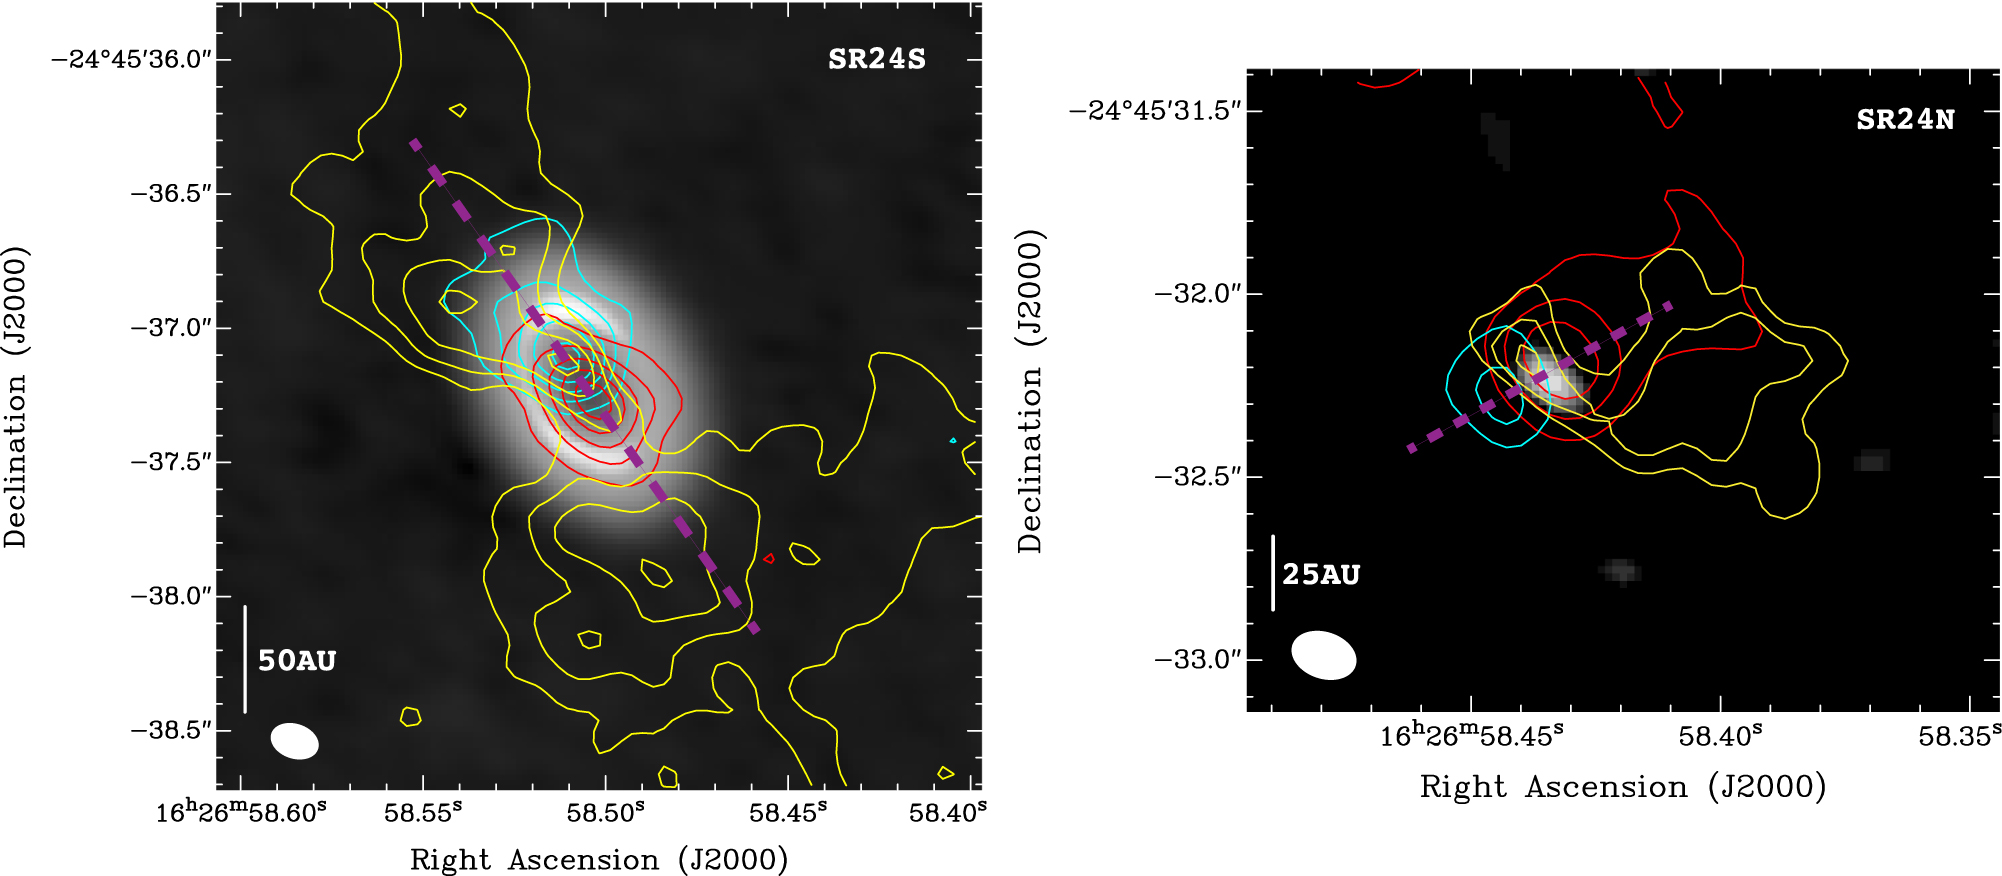
The left panel of Figure 1 shows the spatial distribution of the ALMA 1.3 mm continuum emission contours overlapped with an archival HST ACS 6000 Å image.7
As previously reported, the system SR24 consists of two circumstellar disks (SR24N and SR24S) imaged, for instance, at infrared wavelengths (Mayama et al. 2010). While SR24S is associated with a well-known millimeter continuum source (e.g., Andrews & Williams 2005; Pinilla et al. 2017), here we report for the first time the detection of SR24N in this wavelength domain. ALMA shows SR24S having a well-defined annular morphology. This ring of dust is seen as an annular ellipse in projection (see Table 1), with two brighter parts toward the Northwest and the Southeast. SR24N is unresolved with the ALMA resolution ( ) and its position coincides with the position of the 2MASS disk within the positional uncertainty (
 , see right panel of Figure 1). We measured a peak flux of 314 μJy beam−1 (that is a
  detection) for the SR24N millimeter source, which has a size of the order of the angular separation of the binary contained in it (as measured by Correia et al. 2006). For comparison, an M or K spectral type star at the distance of the Ophiuchus molecular cloud would have a flux density8
of
detection) for the SR24N millimeter source, which has a size of the order of the angular separation of the binary contained in it (as measured by Correia et al. 2006). For comparison, an M or K spectral type star at the distance of the Ophiuchus molecular cloud would have a flux density8
of  μJy beam−1.
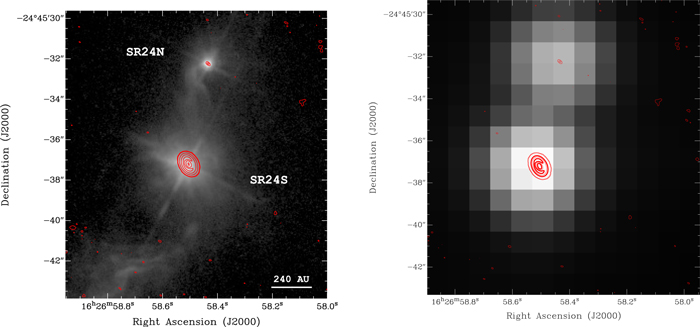
Figure 1. Left: 1.3 mm ALMA continuum image (red contours) on top of an f606w HST archive image (gray scale). Contours are 0.15, 0.30, 4, 7, and 10 mJy beam−1. The rms noise level is 0.044 mJy beam−1. The synthesized beam is 
 . Right: same as for the left panel but with a 2MASS J-band image instead of the HST image. Note the good positional agreement (the astrometry uncertainty for the 2MASS data is about
  ) of the two disks seen at IR (gray scale) and mm wavelengths (red contours).
Download figure:
Standard image High-resolution imageTable 1. Characteristics of the 1.3 mm Continuum Sources
| Source | R.A. | Decl. | Flux Density | Semiajor Axisa | Semiminor Axisa | P.A. | ib | Mdiskc |
|---|---|---|---|---|---|---|---|---|
| J2000 | J2000 | (mJy) | ('') | ('') | (°) | (°) | ( ) ) |
|
| SR24S |

|
−24°45'37 21 21 |
211 ± 4 | 0.70 ± 0.06 | 0.50 ± 0.06 | 212 ± 3 | 44 ± 6 | 0.025 ± 0.001 |
| SR24N |

|
−24°45'3224 |
0.34 ± 0.07 | ⋯d | ⋯ | ⋯ | ⋯ | 4 × 10⁻⁵ ± 1 × 10⁻⁵ |
Notes.
aDeconvolved semimajor and semiminor axis of the ring-shaped disk. bEstimated from the major and minor axis lengths as the .
cThe disk mass is estimated assuming a typical gas-to-dust ratio of 100.
dThis disk is unresolved with the present ALMA resolution.
.
cThe disk mass is estimated assuming a typical gas-to-dust ratio of 100.
dThis disk is unresolved with the present ALMA resolution.
Download table as: ASCIITypeset image
Therefore, the detected millimeter source in SR24N is probably due to the dust emission from the protostellar disk(s). Assuming optically thin isothermal dust emission, a gas-to-dust ratio of 100, a dust opacity of 1.1 cm2 g−1 at 1.3 mm appropriate for dust with thin ice mantles (Ossenkopf & Henning 1994), an opacity spectral index with an exponent  for both sources (Isella et al. 2009; Ricci et al. 2010; Pinilla et al. 2014), and a dust temperature of 30 K, we estimate a mass associated with the SR24N millimeter source of 4 × 10⁻⁵ M☉ or 13 ± 7 M⊕ (where we have estimated the statistical error based on the uncertainty of the flux density and a 5 K uncertainty for the temperature). Using the same approximate values, for SR24S we obtain a mass of 0.025 ± 0.007 M☉, which is in good agreement with previous estimates (e.g., Isella et al. 2009; Andrews et al. 2010, 2011).
3.2. 12CO Molecular Emission from the Disks
The 12CO molecular emission observed by ALMA in the SR24 system shows the kinematics of two gaseous rotating disks at the positions of SR24S and SR24N (Figure 2). The gas content and kinematics of the SR24N disk is reported here for the first time.9 Table 2 presents a summary of the properties of the disks found through the 12CO emission.

Figure 2. Left: 12CO integrated emission from SR24S. Redshifted emission is integrated from 7.3 to 12.4 km s−1 (red contours at 27%, 42%, 69%, and 96% of the peak emission); near zero-velocity emission is integrated from 2.2 to 4.1 km s−1 (yellow contours at 50%, 65%, 80%, and 95% of the peak emission); blueshifted emission is integrated from −6.0 to 1.6 km s−1 (blue contours, same as redshifted contours). Contours are overlapped on top of a 1.3 mm continuum emission (gray scale) and the beam is shown in the bottom left corner. Right: same display as in left panel for SR24N. In this case, redshifted emission is integrated from 6.6 to 10.5 km s−1 (red contours at 20%, 30%, and 40% of the map peak emission located at SR24S); zero-velocity emission is integrated from 5.3 to 6.0 km s−1 (yellow contours at 50% and 60% of the map peak emission); blueshifted emission is integrated from −0.3 to 2.2 km s−1 (blue contours at 50% and 60% of the map peak emission).
Download figure:
Standard image High-resolution imageTable 2. 12CO Disks Properties
| Column | 2 | 3 | 4 | 5 | 6 | 7 | 8 |
|---|---|---|---|---|---|---|---|
| Source | Size | P.A. | i | Vcentera | Vrangea | Vpeaksa | Vabsorptiona |
( ) ) |
(°) | (°) | (km s−1) | (km s−1) | (km s−1) | (km s−1) | |
| SR24S | 050 ± 006 × 017 ± 002; 41° |
218 ± 2 | 70 ± 5 | 4.4 ± 0.3 | [−3.5, 12.4] | −0.3/6.0 | [2.2, 4.1] |
| SR24N | 060 ± 010 × 031 ± 006; 111° |
297 ± 5 | 121 ± 17 | 5.6 ± 0.3 | [−0.3, 10.5] | 1.6/7.3 | [2.2, 4.8] |
Note. Column 2: deconvolved FWHM of the semimajor and semiminor axis and position angle estimated from a 2D-Gaussian fit to the moment 0 image produced using the Vrange specified in column 5. Column 3: estimated using a linear fit to the peak of the red- and blueshifted high-velocity channels. Column 4: derived from the semimajor and minor axis obtained in column 2. Column 5: measured from a Gaussian fit to the wings of the line profile integrated along the disk. Column 6: measured until no 3σ emission is detected in a velocity channel at the disk position. Column 7: velocities of the disk's double-peak spectrum. Column 8: velocity range of the self-absorption feature.
aVelocities are VLSR and are not corrected by the cloud velocity.Download table as: ASCIITypeset image
A southwest–northeast (red- to blueshifted emission, respectively) velocity gradient indicative of rotation is observed in SR24S at a position angle,10
 , ranging for about 16 km s−1. The disk rotation is centered at 4.4 km s−1 and the spectrum integrated over the disk shows a double peak, as it is stronger the redshifted one (Figure 3). In addition, four slightly blueshifted spectral channels close to the cloud velocity (which we found to be the channel at
  km s−1, because it shows the typical interferometric pattern when extended emission is missed) show a significant absorption over the SR24S ring disk. This radial velocity range coincides exactly with the kinematics of the cloud 33 of the ρ-Ophiuchus region in which the SR24 system is embedded (de Geus et al. 1990). This absorption is possibly affecting the results of our 2D-Gaussian fit, which would explain the different inclination obtained,
  , with respect to that obtained by analyzing the continuum emission,
  .
.
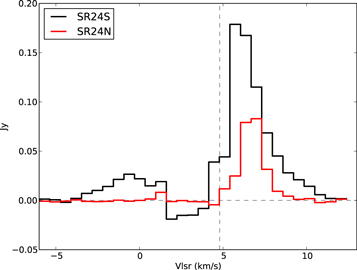
Figure 3. 12CO integrated spectra over the two SR24 disks. The foreground cloud velocity at 4.8 km s−1 is marked by a vertical line. The spectra show a skewed asymmetric double-peak profile with the stronger redshifted peak, possibly due to foreground absorption.
Download figure:
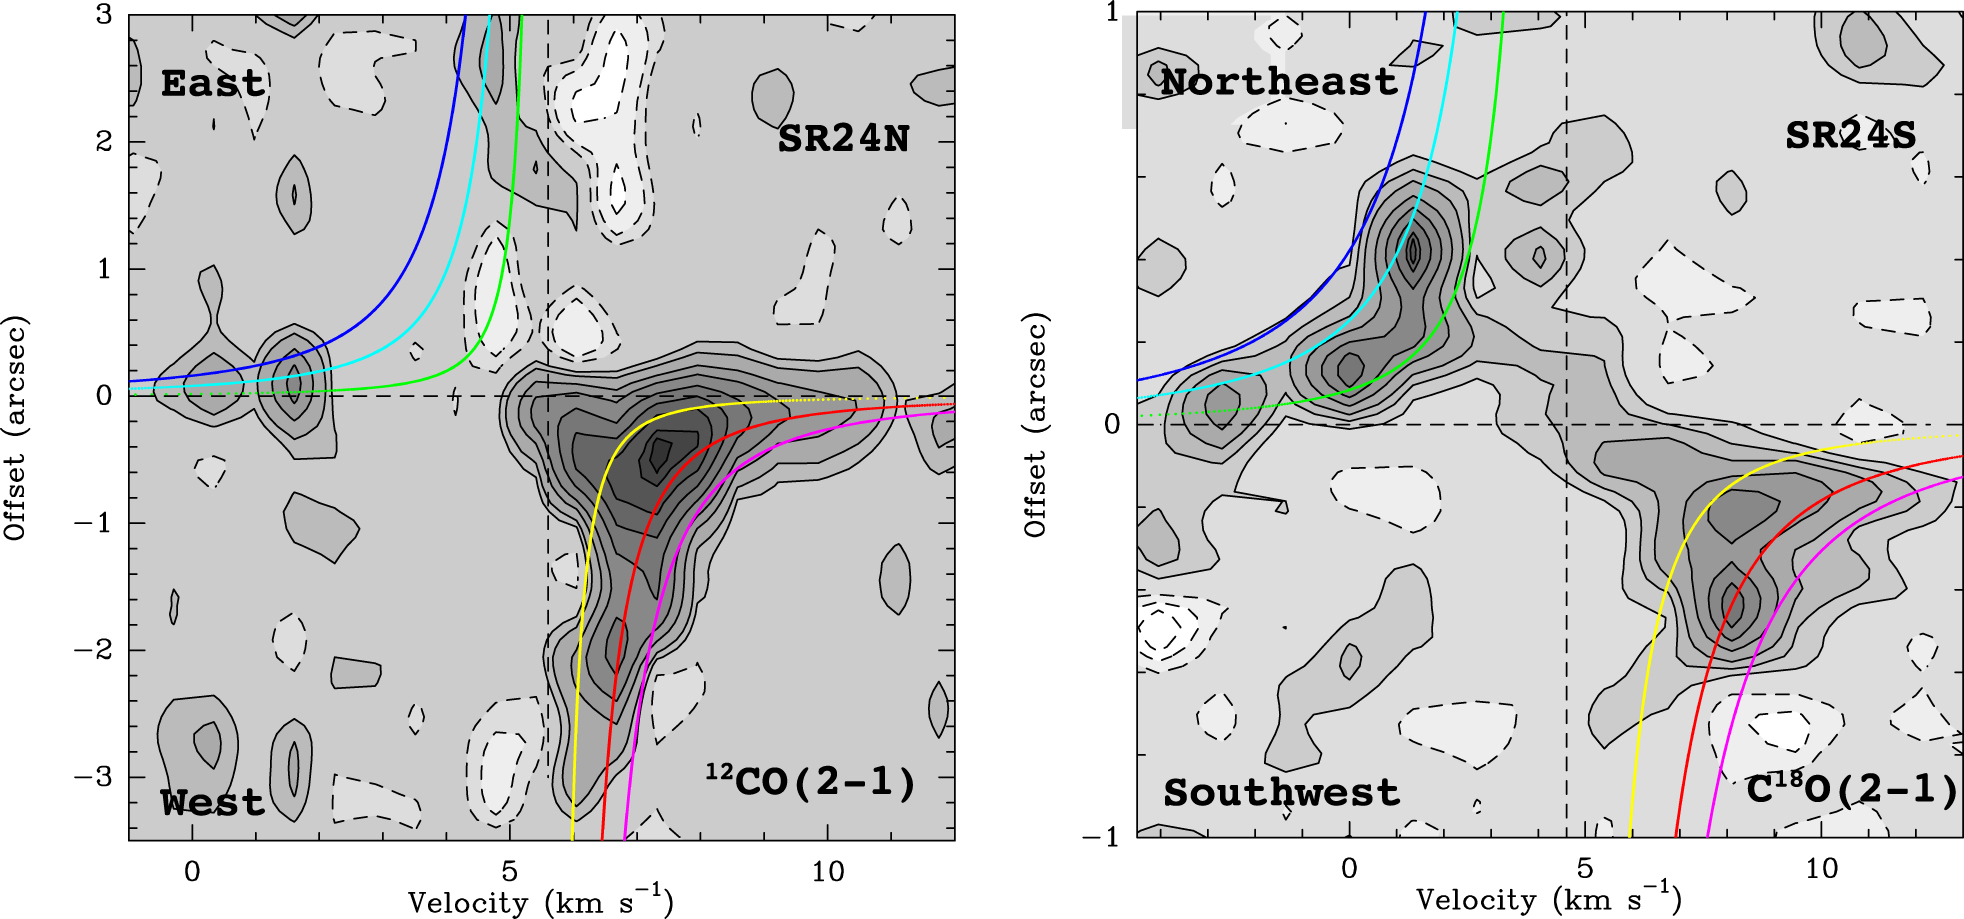
Standard image High-resolution imageCentered at a different velocity (5.6 km s−1, that is 1.2 km s−1 away from that of SR24S), the fainter SR24N 12CO emission presents a velocity gradient. The red- to blueshifted emission gradient (west–east, respectively; Figure 3) goes along the  with a velocity range of about 11 km s−1. The integrated spectrum over the northern disk also presents a skewed double-peaked profile, with a stronger redshifted peak most probably due to the cloud absorption as in SR24S. Because the SR24N disk is not detected in less optically thick molecular tracers, we used the available 12CO information to make an order-zero estimate of the dynamical mass of the system. The left panel of Figure 4 shows a position–velocity diagram taken along the major axis of the SR24N disk. For comparison, we overlapped three Keplerian rotation curves produced with central masses ranging between 0.1 M☉ and 1 M☉, which encompass the emission from the disk. Another crude estimate of the dynamical mass for SR24N can be made by using the expression
  , where the parameters are
  and r is equal to the geometric mean of the sizes given in Table 2. The resulting mass, 0.8 M☉, is in good agreement with the total mass of the close binary system (0.95 M☉, Correia et al. 2006). Compared with it, the mass of the SR24N disk is negligible.

Figure 4. Left: position–velocity diagram built from the 12CO emission along a cut with  centered on SR24N. Contours are at −30%, −20%, −10%, −5%, 5%, 10%, 20%, 30%, 45%, 60%, 75%, 90%, and 96% of the maximum peak emission. Keplerian curve profiles following the expression
  are overlapped for different masses: green/yellow, 0.1 M☉; cyan/red, 0.5 M☉; blue/magenta, 1.0 M☉. Dashed lines are drawn at the center of the disk in position and velocity (5.6 km s−1). Right: same as in the left panel but showing a velocity cut along the major axis of the C18O (2-1) emission of the SR24S disk (
 ) and located at its central position. The masses for the overlapped Keplerian curves are: green/yellow, 0.5 M☉; cyan/red, 1.5 M☉; blue/magenta, 2.5 M☉. The central velocity in this case is 4.6 km s−1.
Download figure:
Standard image High-resolution image3.3. Simple Modeling of the SR24S Disk Kinematics
The C18O (2-1) line emission is only detected toward SR24S and not SR24N. Although fainter than the 12CO line, its emission is more optically thin and is less affected by the cloud absorption (Pinilla et al. 2017). This is the reason why the C18O (2-1) line is the best molecular proxy available to study the kinematics of the SR24S disk. We made a simple model of a rotating and accreting thin disk, which does not include radiative transfer, as the goal is to study the disk kinematics and geometry. The surface density is described by a tapered power law consistent with the theoretical predictions for accretion disks (Lynden-Bell & Pringle 1974; Hartmann et al. 1998; Facchini et al. 2017; Factor et al. 2017):
where  is proportional to the disk mass, rc informs about the radial extent of the gas disk, and γ is the power law index that we fixed to 0.8 following Andrews et al. (2010). We implemented the kinematics of the rotating and accreting disk using the Miriad tasks velmodel and velimage and convolved the model with a 2D-Gaussian to match the observed synthesized beam. To build up the velocity cube with velimage, we assumed that both the rotation and the infall velocity have an
  radial dependence. Our model of the velocity cube has nine free parameters: peak intensity, disk center
  , inclination with respect to the line of sight i, the characteristic radius rc, the position angle P.A. (measured from north to east), the LSR velocity vLSR, the rotation velocity vrot, and the accretion velocity vinfall at a fiducial radius of
  (120 au for the adopted distance). We used an optimization algorithm based on the AGA method developed by Cantó et al. (2009) to fit the observed velocity cube and ran it a 100 times in order to extract a standard deviation for the averaged parameters (Table 3).
Table 3. C18O Fit Disk Parameters
| Parameter | Fit Value |
|---|---|
| x0a | 002 ± 002 |
| y0a | −130 ± 003 |
| i | 46° ± 8° |
| rc | 13 ± 02 |

|
212° ± 6° |
| vLSRb | 4.6 ± 0.2 |
| vrotb | 3.2 ± 0.5 |
| vinfallb | 0.3 ± 0.2 |

|
4 ± 1 |
Notes. Results from the C18O velocity cube fitting to the SR24S disk.
aThese offsets set the modeled disk center at 16:26:58.507, −24:45.37.17. bVelocities are in km s−1.Download table as: ASCIITypeset image
Figure 5 shows the good agreement between the simple model and the C18O (2–1) observed velocity cube, which displays the typical butterfly-shaped emission along the velocity channels, proper of a Keplerian disk. The blueshifted emission is located preferentially toward the Northeast, while the redshifted emission is found toward the Southwest, with the velocity center estimated at 4.6 ± 0.2 km s−1. The inclination and position angle match the values found in Section 3.1 from the continuum emission, while the radius of the gaseous disk seems to be almost a factor of two larger than the radius of the dusty disk, which may be explained by differences in the optical depth of the CO line and the continuum emission (Facchini et al. 2017). The rest of the resulting parameters of the fit are summarized in Table 3. The model included the rotation velocity of the disk at a fiducial radius of 120 au ( km s−1), which we use to estimate the dynamical mass of the protostar (
 ) of 1.5 ± 0.5 M☉. This mass makes a good fit to the position–velocity diagram taken along the disk's major axis (at
  ) shown in the right panel of Figure 4. Additionally, it is similar to the value of 2 M☉ reported by Andrews et al. (2010).

Figure 5. Velocity cube of the ALMA C18O (2-1) emission of the SR24S disk (color scale) overlapped with a simple rotating and accreting disk model (white contours, see the text). Color tones range from 20% to 90% of the peak flux (10.3 mJy beam−1 km s−1) in steps of 10%, while contours are 3, 6, 9, 12, and 15 times the rms noise level of the observed emission. The vLSR of every velocity channel is indicated at the top right corner and the synthesized beam of the observations ( ,
,  ) is shown at the bottom right corner of the last velocity channel.
Download figure:
Standard image High-resolution image3.4. Molecular Extended Emission
The 12CO (2-1) ALMA and SMA velocity cubes show several regions of extended emission. The SMA data set has shorter baselines than the ALMA data set and therefore is more sensitive to extended emission; although, on the contrary, it has a coarser spectral resolution. We present both velocity cubes overlapped in Figure 6. There are three main features that we point out: (i) a gas reservoir extending north–northwest of SR24N, (ii) a bridge of gas connecting SR24N with the SR24S disks, and (iii) an elongated and blueshifted feature due southwest of SR24S.
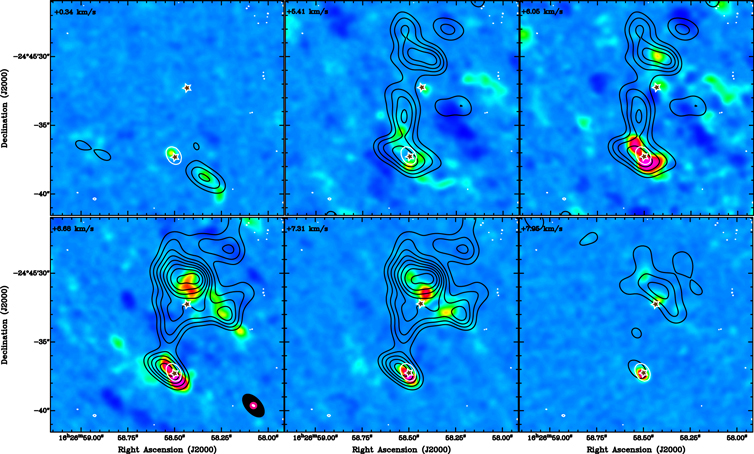
Figure 6. 12CO (2-1) emission velocity channels observed with the SMA (black contours ranging from 0.22 to 1.1 Jy beam−1 km s−1 in steps of 0.1 Jy beam−1 km s−1) and 1.3 mm continuum emission from ALMA (white contours at 0.20 mJy beam−1) on top of the 12CO (2-1) emission velocity channels taken with ALMA (color image) toward the SR24 system. The central velocity of the channels is shown at the top left corner of each panel. The synthesized beams are shown in the bottom left panel and share the same color code with the contours and stars mark the position of SR24N and SR24S
Download figure:
Standard image High-resolution imageThe northern gas reservoir spreads out  east–west and extends for about
  north of SR24N. It embraces the SR24N disk and is probably associated with it, as it is detected from 5.4 to 7.9 km s−1, part of the redshifted velocities at which the SR24N disk is seen. The elongated 12CO bridge connecting SR24N and SR24S disks extends for
  north–south. It is mainly detected between 5.4 and 6.0 km s−1 with the SMA, although the ALMA observations also show a faint arc-like structure linking the northeast part of the SR24S ring-like disk, with the east edge of the SR24N disk and the Northern gas reservoir. There is another 12CO linearly elongated source due southwest from SR24S that is detected at blueshifted velocities ranging from −0.9 to 0.9 km s−1.
We estimate the mass of the Northern gas reservoir and the gas bridge between the disks using the 12CO (2-1) SMA emission, assuming that the gas is in local thermodynamic equilibrium and its emission is optically thin. We derive them with the following expression:
in which we adopt an excitation temperature  K, the partition function for the 12CO
  , the energy of the upper level of the 12CO (2-1) transition is Eu = 16.596 K, the fractional abundance
  , the distance is d = 0.12 kpc, the rest frequency
  , the molecular dipolar momentum
  D, and the integrated flux density
  goes in Jy km s−1. The resulting masses, 13 × 10−7 M☉ and 2 × 10⁻⁷ M☉ (see Table 4), for the Northern reservoir and the bridge, respectively, are of the order of half the mass of the planet Earth.
Table 4. SMA 12CO Extended Emission
| Source | Flux Density | Size |

|
|---|---|---|---|
| (Jy km s−1) | (arcsec2) | (×10−7  ) ) |
|
| Northern reservoir | 11.3 ± 0.3 | 16.5 | 13 |
| Bridge | 3.0 ± 0.1 | 37.5 | 3 |
| Southern streamer | 1.6 ± 0.1 | 7.0 | 2 |
Note. Column 2: integrated 12CO (2-1) flux densities from SMA observations with a synthesized beam of  ;
;  . Column 3: approximated size of the source taken from the SMA data set. Column 4: mass of the gas estimated from the SMA integrated flux measurements.
Download table as: ASCIITypeset image
4. Discussion
4.1. Geometry of the Disks
Having measured the P.A. and the inclination of a disk, the only information that is missing to completely characterize its geometry is to know the tilt of the protostellar disk (i.e., which end of the disk's minor axis is the nearest to the observer). This could be addressed indirectly by putting together the information about the approaching–receding side of the disk and the sense of the disk's rotation (an analogous problem to distinguish between leading and trailing spiral arms in galaxies, e.g., de Vaucouleurs 1958; Repetto et al. 2017).
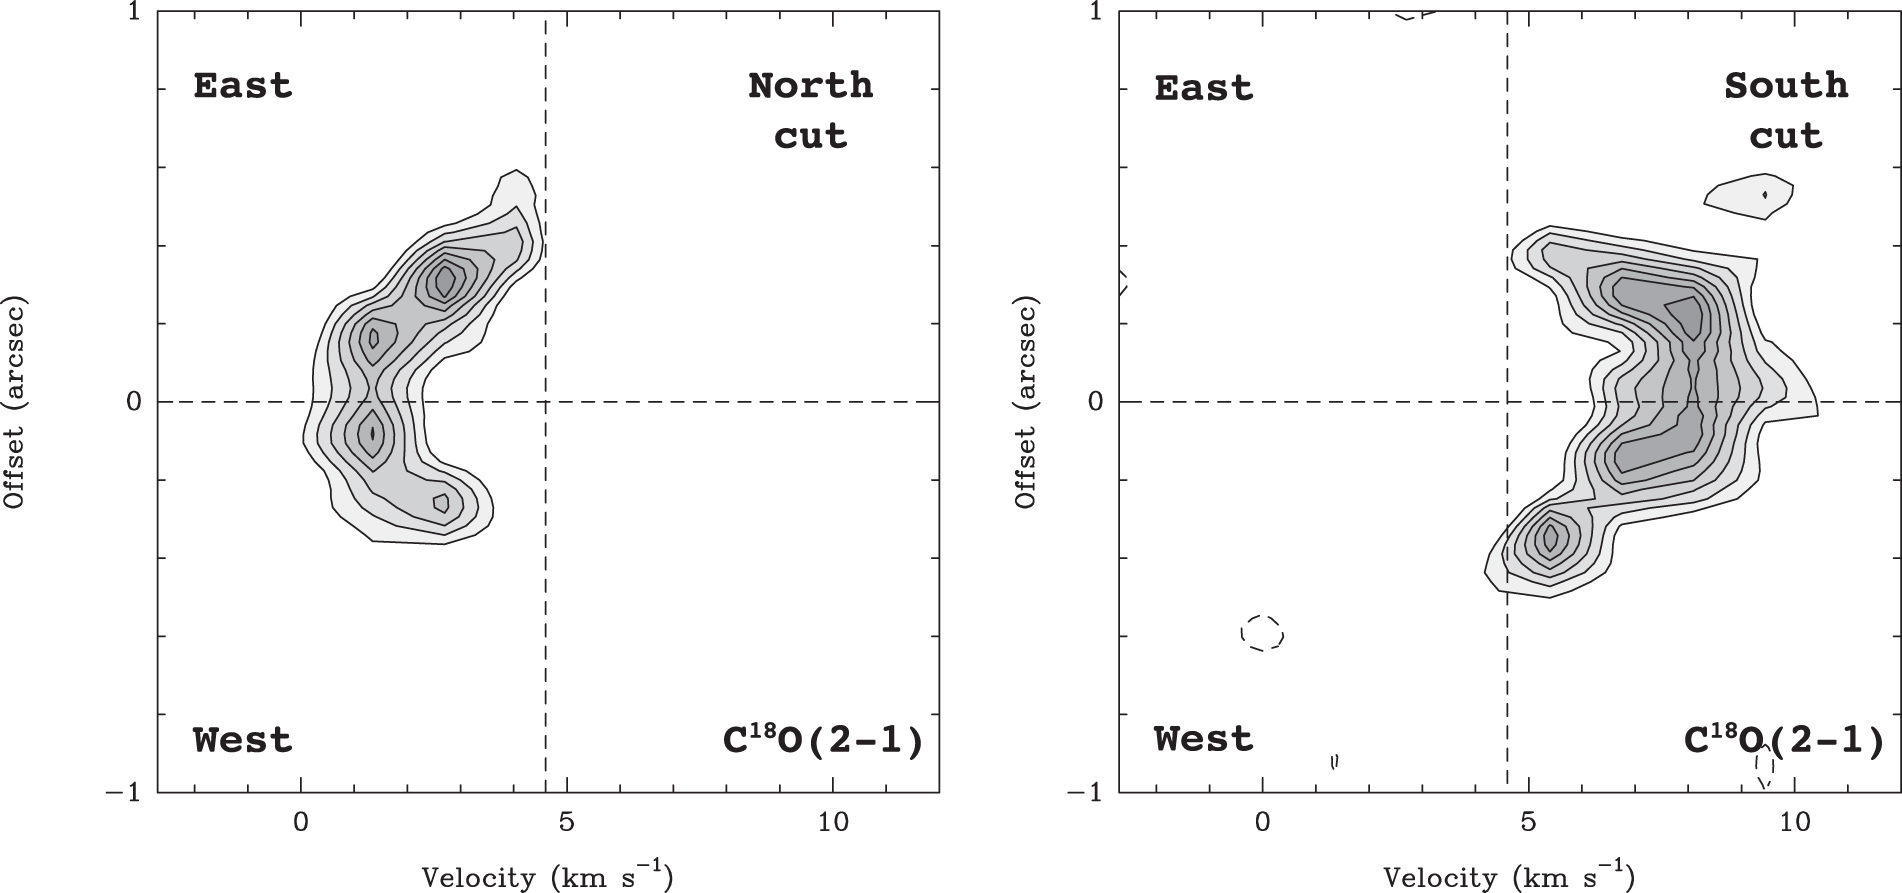
For SR24S, the southwest side of the disk is receding (redshifted), while the northeast side is approaching (blueshifted). We can now derive the sense of rotation (and hence the tilt of the disk) in three ways. The first is achieved by admitting the indications of previous coronograph IR observations (Mayama et al. 2010), which show an extended arc of emission reported as a spiral arm of the SR24S disk. The curvature of the spiral arm would indicate that the disk is rotating counterclockwise (as seen in projection), which implies that the east side is its near side. Second, the same infrared observations show brighter emission toward the east side of the SR24S disk, which lead Mayama et al. (2010) to conclude that the near side is the east side (the same applies also for the SR24N disk). Along with the approaching/receding kinematic information, this implies a counterclockwise rotation for the SR24S disk. The third evidence supporting this sense of rotation comes from a close inspection of the velocity field of the C18O disk. Figure 7 presents two different velocity cuts perpendicular to the major axis of the SR24S disk. A subtle asymmetric pattern can be noticed in both position–velocity diagrams. On one hand, the northern pv-cut shows the blueshifted emission in a boomerang-shaped feature originated by the rotation, but the west arm of the boomerang is shorter than the east arm. On the other hand, the southern pv-cut shows the redshifted emission in another boomerang-shaped feature, but this time, the east arm is slightly shorter and fainter. The asymmetric length of the boomerang arms in both pv-diagrams is due to the non-zero infall velocity as supported by the following study that we present using some synthetic models. Actually, the asymmetry is more pronounced as the infall velocity is larger and the disk is closer to edge-on. Note that if outflow rather than infall motions are considered, the asymmetry would be reversed. In the case of the SR24 system, we assume infall motions based on the evidence of accretion provided by Paschen hydrogen recombination lines observations by Natta et al. (2006).

Figure 7. SR24S position–velocity diagrams of the C18O (2-1) emission made with two cuts perpendicular to the disk's major axis ( ). Velocity is in LSR and positional offsets are with respect to the major axis of the disk. Contours are at −20%, 20%, 30%, 40%, 50%, 60%, 70%, 80%, and 90% of the maximum peak emission. The left panel shows the cut taken north of the central position and the right panel shows the cut taken south of it. The asymmetric boomerang-like features displayed are due to gas rotation and accretion.
Download figure:
Standard image High-resolution imageIn Figure 8, we show sketches for two rotating and accreting disks with inclinations separated by  and a third rotating disk with no accretion (Cases I, II, and III, respectively). We simulated the kinematics of these disks using the toy model described in Section 3.3 for SR24S but changing the inclination and the accretion velocity while keeping the receding and approaching sides of the observations fixed. Two position–velocity cuts perpendicular to the major axis of the disks are presented for each case. Case I and III disks have their nearest side to the east (inclination
  ) and differ only in the accretion velocity:
  km s−1 and
  km s−1. Case II disk has
  ,
,  km s−1 and its nearest side is west. Case I and II disks rotate in opposite directions (as seen in projection) so that they keep the receding and approaching sides the same. The pv-cuts perpendicular to the major axis of the disks show similar boomerang-shaped features as the SR24S observations. The boomerang shapes appear due to the gas rotation (Case III), but the asymmetries in the length of the boomerang arms are related to the accretion or infall motions (Cases I and II). Indeed, in the case of an accreting disk, the asymmetry pattern is also related with the inclination of the disk with respect to the plane of the sky. As evidenced by Figured 8, when
  (Case I) the infall motions make the nearest blueshifted quarter of the disk to reach less blueshifted velocities, while the opposite applies for the farthest blueshifted quarter of the disk. Analogously, the farthest redshifted quarter appears less redshifted than the nearest redshifted quarter. On the contrary, when
  (Case II) the asymmetries are just reversed, making it possible from the kinematic observations to determine which is the nearest side, the true inclination and the sense of rotation of the disk, given that the disk has infall motions. All of this analysis leads us to derive the sense of rotation (counterclockwise) and the location of the near edge (east edge) of the SR24S disk.
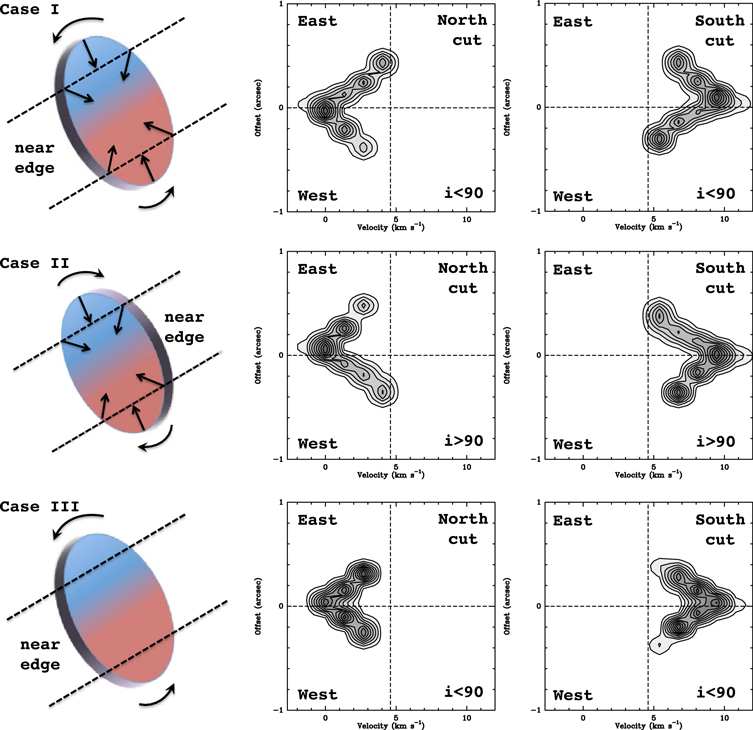
Figure 8. Three cases of disks with different inclinations with respect to the plane of the sky and kinematics (sense of rotation and infall). We took the synthetic model for the SR24S disk, changed some parameters, and produced two associated position–velocity cuts perpendicular to its major axis (that is, with a P.A. =  ) and centered north and south of the disk center. The pv-diagrams are displayed to the right of the corresponding disk sketch. In all three cases, the blueshifted emission is produced in the Northeast and the redshifted emission is in the Southwest. In Case I, the disk has an inclination of
  (
( ), the near edge due east, a counterclockwise rotation (
 km s−1), and an infall velocity of 1.0 km s−1. In Case II, the disk inclination is
  (
( ), the near edge is due west, it is rotating clockwise, and has an infall velocity of 1.0 km s−1. Finally, Case III shows the same disk as for Case I but without infall velocity. For all three models,
  km s−1.
Download figure:
Standard image High-resolution imageFor the SR24N disk, the lower signal-to-noise ratio and the foreground cloud absorption of the 12CO data prevent a similar analysis. Therefore, we assume that the sense of the disk rotation matches that of the close binary systems SR24Nb and SR24Nc (i.e., clockwise, see section Section 1 and Correia et al. 2006). Although there are examples of disks hosting counter-rotating stars (Bate et al. 2010; Vorobyov et al. 2016, and references therein), the simplest hypothesis is that both binary and disk rotate in the same sense.
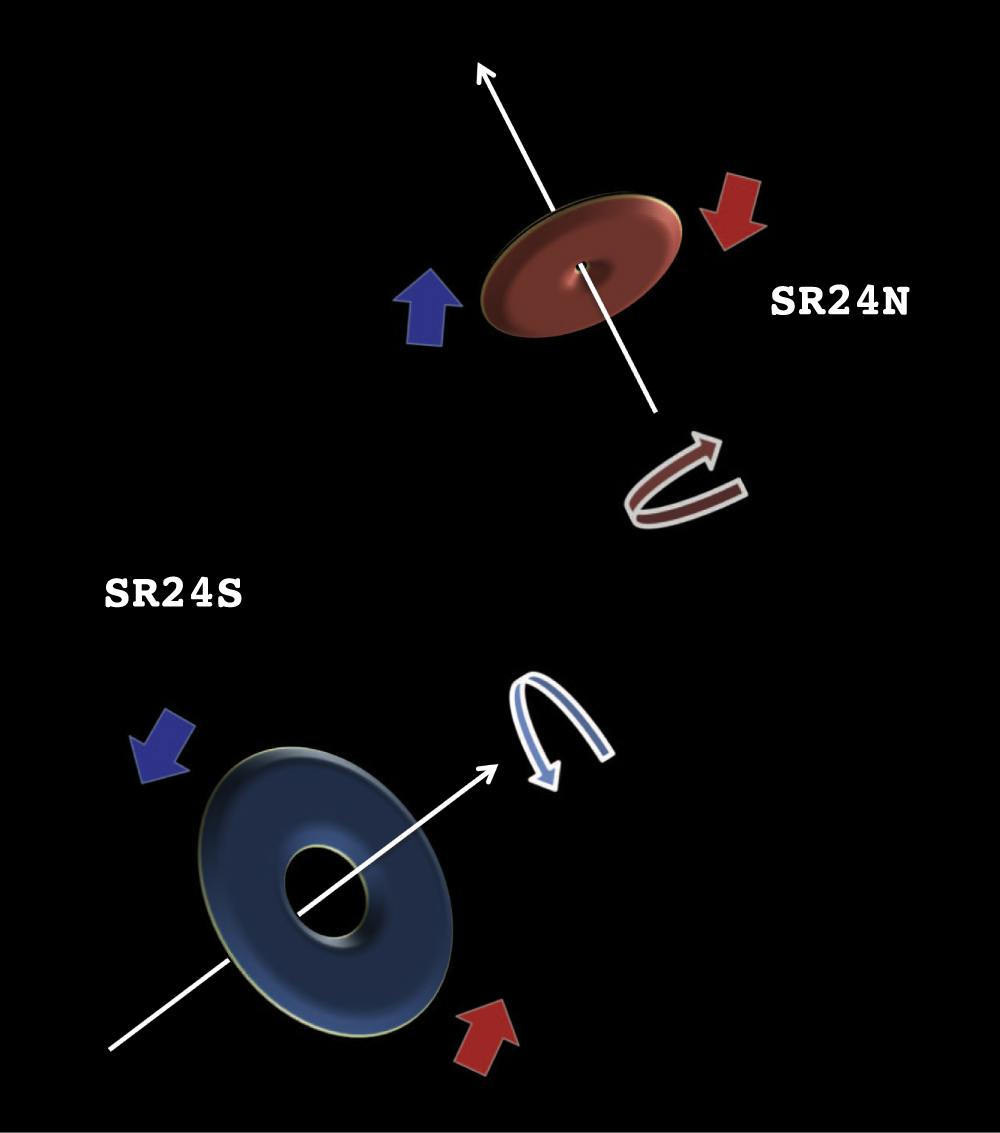
Figure 9 sketches the SR24 system (note that it is not to scale and the gaps of the disks are not real), with the binary system SR24N rotating clockwise and with an inclination  , while the SR24S disk is rotating counterclockwise with an inclination
  . Given the measured position angles and the inclinations of both disks (Tables 1–3), we derive an angle between the angular momentum vectors of the two disks11
of
. Given the measured position angles and the inclinations of both disks (Tables 1–3), we derive an angle between the angular momentum vectors of the two disks11
of  . Even considering that the SR24N disk rotates in the opposite direction (it would have
  ) the disk's angular momentum vectors would be
  away from each other. Therefore, there is strong evidence suggesting that the SR24 system has two highly misaligned disks.

Figure 9. Cartoon explaining the geometry and kinematics of the SR24 triple system. The picture is not intended to be a scaled version of the system, nor to display the morphological details of the disks. The inclinations and position angles are just roughly approximated.
Download figure:
Standard image High-resolution image4.2. Extended Gas Features
Inspecting the HST optical emission of Figure 1, it is noticeable the bridges and/or streamers produced by light scattered in dust and gas (Potter 2003). There is a twisted bifurcation in the bridge joining the SR24N and SR24S disks, and a prominent curved arc south of SR24S thought to be a spiral arm (Mayama et al. 2010). The present 12CO (2-1) observations from ALMA and SMA do not perfectly match these structures. For instance, the southern optical/infrared spiral arm has no 12CO counterpart. The location of the molecular bridge between the two disks (Figure 6) is slightly east of the HST bifurcated bridge, but both seem to join the two disks of the system. The nature of this bridge is unknown, although it is well known from numerical simulations that multiple systems have bridges of material like the one observed here (e.g., Gabbasov et al. 2017). We have also noticed that the optical bridge between the disks of the system has a curvature and joins the west side of SR24S with the east side of SR24N. Models including two disks with the same sense of rotation (see Figure 1 in Mayama et al. 2010) seem to predict a reversed orientation of the linking bridge, and this is a point for further investigation of the geometry and kinematics of the system.
Regarding the Northern gas reservoir seen in the 12CO (2-1) maps (Figure 6), it is possible that it is connected (in space and velocity) with the bridge. It could be part of a spiral structure due to gravitational instabilities of the system (see, e.g., Tobin et al. 2016), the remnant of a circumbinary structure, or a reservoir of material found by SR24N in its orbital path. More sensitive ALMA observations are needed to further interpret the nature of this feature.
4.3. Origin of the SR24 System
The ALMA observations and the previous work on the SR24 system make it clear that the two disks are misaligned, making this one more of a small sub-population of multiple systems with large separations (Jensen & Akeson 2014; Salyk et al. 2014; Williams et al. 2014). However, SR24 has another peculiarity: the two disks possibly rotate in opposite directions as seen from Earth (i.e., in projection, one rotates clockwise and the other counterclockwise). How this system originated is not a trivial question, and here we introduce a few suggestions into the discussion.
It is known that a highly misaligned multiple system is hardly formed via the collapse of a non-turbulent rotating cloud, and this has been previously stated by numerical simulations (e.g., Bate et al. 2010). Such non-turbulent clouds may produce disks that can undergo further fragmentation due to gravitational instabilities, being the most recent and clear example the triple system L1448 IRS3B (Tobin et al. 2016). Therefore, a cloud would need some degree of initial turbulent motions as to fragment into (at least two) pieces that would finally rotate in highly misaligned, or even opposite directions (i.e., antiparallel spins Offner et al. 2010; Tokuda et al. 2014).
Another possible explanation for the formation of a system with two strongly misaligned disks is the event of a close encounter of two previously isolated protostellar disks. However, in the thorough analysis by Salyk et al. (2014), adapting the expressions of Thies et al. (2005) to the Ophiuchus molecular cloud, they estimate a low encounter probability ( ) for impact parameters under 500 au.
Whatever the multiple system formation mechanism was, at some point, one of the protostellar disk companions may undergo an event of external accretion from a reservoir of material (Vorobyov et al. 2016), which may impinge a tilt in this particular disk, resulting in a tilt with respect to its original inclination. Regarding the existence of a gas reservoir north of SR24N, this may provide a plausible explanation for the misalignment in SR24, which may erase the memory of the formation mechanism in this system.
5. Summary and Conclusions
By using archival ALMA observations, we report the detection at 1.3 mm of the two protostellar disks toward the SR24 system, both in continuum and molecular emission (12CO and C18O 2-1 lines). We estimate the disk masses for SR24S and SR24N (0.025 M☉ and 4 × 10⁻⁵ M⊕, respectively) and the dynamical masses for both protostars (1.5 M☉ and 1.1 M☉). We implemented a simple kinematic model to fit the velocity cube of the SR24S C18O disk emission and completely determine the geometry of the disks, and we derive the possible sense of rotation and the angle between their angular momentum vectors. The disks are highly misaligned ( ) and are probably rotating in opposite directions, as seen from Earth.
We also use archival 12CO (2-1) SMA observations to show the extended molecular emission distribution. We detect a bridge of gas joining both disks (other bridge is observed in optical/infrared as well) and a gas reservoir north of SR24N. The true nature of this gas reservoir may be the key for interpreting the formation of this system. If it is a remnant of a circumbinary disk or part of a spiral structure associated with SR24N, then the large misalignment between the disks may suggest a turbulent origin of the system; contrarily, if the gas reservoir is external to the system, it could well have been accreted by SR24N, tilting its original orientation, and thus erasing all of the information about the formation of this system (whether it was from the turbulent fragmentation of a cloud or the fragmentation of a disk).
We thank the anonymous referee for the thoughtful and dedicated comments and suggestions with which the manuscript was substantially improved.
This paper makes use of the following ALMA data: 2013.1.000912.S and 2013.1.00498.S. ALMA is a partnership of ESO (representing its member states), NSF (USA), and NINS (Japan), together with NRC (Canada) and NSC and ASIAA (Taiwan) and KASI (Republic of Korea), in cooperation with the Republic of Chile. The Joint ALMA Observatory is operated by ESO, AUI/NRAO, and NAOJ.
The Submillimeter Array is a joint project between the Smithsonian Astrophysical Observatory and the Academia Sinica Institute of Astronomy and Astrophysics and is funded by the Smithsonian Institution and the Academia Sinica.
Facilities: ALMA - Atacama Large Millimeter Array, SMA - .
Footnotes
- 4
GILDAS data reduction package is available at http://www.iram.fr/IRAMFR/GILDAS.
- 5
The Submillimeter Array (SMA) is a joint project between the Smithsonian Astrophysical Observatory and the Academia Sinica Institute of Astronomy and Astrophysics and is funded by the Smithsonian Institution and the Academia Sinica.
- 6
- 7
The astrometry of the downloaded HST image was wrong, so we applied an offset to the center of that image in order to match the position of the SR24N disk with its optical counterpart.
- 8
Assuming an effective temperature of
 K and a radius of it is possible to derive the flux density at for a typical M or K star in the Ophiuchus cloud ( pc) using
For small circular sources
, where θ is the angular size of the star and is the specific intensity. In this case,and, using the Rayleigh–Jeans approximation,
With all of these values, the derived flux density is 0.43 μJy.
- 9
Note that Andrews & Williams (2005) reported the detection of the SR24N disk in 12CO with the SMA, but a closer inspection of the coordinates of this source make it clear that the SMA emission stems from an extended source north of SR24N position.
- 10
Throughout this work, we have adopted the convention typically used in visual binary orbit determination (Heintz 1978; Jensen & Akeson 2014). The position angle (P.A.) is counted in degrees from North (0°) through East (90°), ranging from
to , pointing to the redshifted edge of the disk (ascending node). The inclination of the disk (orbit) with respect to the plane of the sky ranges from to , being that of an edge-on disk. If the disk rotates clockwise the inclination is if it rotates counterclockwise, the inclination is . - 11
We follow the expression given in (Jensen & Akeson 2014):
, where i1 and i2 are the disk inclinations.


