


Abstract
We present an analysis of near-infrared, high-resolution spectroscopy toward the flat-spectrum young stellar object (YSO) ESO Hα 279a (∼1.5M⊙) in the Serpens star-forming region at a distance of 429 pc. Using the Immersion GRating INfrared Spectrometer (IGRINS; R ≈ 45,000), we detect emission lines originating from the accretion channel flow, jet, and inner disk. Specifically, we identify hydrogen Brackett series recombination, [Fe ii], [Fe iii], [Fe iv], Ca i, Na i, H2, H2O, and CO overtone emission lines. By modeling five bands of CO overtone emission lines and the symmetric double-peaked line profile for Na i emission lines, we find that ESO Hα 279a has an actively accreting Keplerian disk. From our Keplerian disk model, we find that Na i emission lines originate between 0.04 and 1.00 au, while the CO overtone emission lines are from the outer part of the disk, in the range between 0.22 and 3.00 au. The model reveals that the neutral atomic Na gas is a good tracer of the innermost region of the actively accreting disk. We derive a mass accretion rate of  M⊙ yr−1 from the measured Brγ emission luminosity of 1.78(±0.31) × 1031 erg s−1.
Export citation and abstract BibTeX RIS
1. Introduction
The inner disk of a young stellar object (YSO) is crucial to terrestrial planet formation and is also the site of hot Jupiters. However, the deficiency of gas in the inner disk makes it unlikely that massive planets could have formed there. Instead, Lin et al. (1996) argued that the inner disk plays a main role in halting the migration of exoplanets and establishing their stable orbits. It is, therefore, important to identify tracers of the inner disk, investigate the temperature and density distributions, and study its dynamics to understand how it works. The inner disk is also closely related to accretion and ejection processes, which affect the formation and evolution of the central star. In a magnetospheric accretion model, material close to the corotation radius, 0.03–0.08 au, accretes to a central star following magnetic field lines bridging the star and the disk (Königl 1991; Calvet & Hartmann 1992; Shu et al. 1994). In addition, the predicted launching place of a jet is either at the truncation inner disk radius or in the range of 0.5–5 au disk radius based on the magnetocentrifugal wind models (Königl & Pudritz 2000; Shu et al. 2000). With the Immersion GRating INfrared Spectrometer (IGRINS), we are able to study all of these factors in a single spectrum.
A high-resolution, near-infrared spectroscopic study of inner gaseous disks is one of the best methods to derive the properties of the inner disks at ≲1 au. Ro-vibrational transitions of CO molecules are good tracers of the warm (1500–5000 K), high-density (>109 cm−3) region of disks (Scoville et al. 1983; Carr 1989; Calvet et al. 1991, Najita et al. 2000, 2003, 2007). In particular, broad CO overtone emission profiles suggest that CO gas is found close to the central star at the range of ∼0.04 to ∼0.3 au in low-mass stars (Chandler et al. 1993; Najita et al. 2000, 2003) and, further out, at the range of ∼0.1 to ∼5.0 au in both intermediate-mass Herbig Ae/Be stars and massive YSOs (Wheelwright et al. 2010; Cowley et al. 2012; Ilee et al. 2014).
Water emission lines at ∼2.3 μm are also good tracers of the inner disk where the temperature falls in the range of 100–2500 K. Narrower line widths and a lower excitation temperature for H2O gas tell us that H2O emission comes from relatively further out in the disk than where the CO emission arises. These warm water emission lines have only been detected in a few YSOs, such as SVS 13 (Najita et al. 2000; Carr et al. 2004), DG Tau (Najita et al. 2000), V1331 Cyg (Najita et al. 2009), and IRAS 08576−4334 (Thi & Bik 2005).
In addition to CO and H2O molecules, the neutral atomic gases of Na and Ca are found in the hot inner disk regions. For example, Na i emission lines at 2.206 and 2.209 μm in the near-infrared wavelength have been detected toward Class I/flat-spectrum YSOs HH 100IR (TS 2.6), RCrA IRS2 (TS 13.1; Doppmann et al. 2005; Nisini et al. 2005), ESO Hα 279a (Aspin et al. 1994; Aspin & Greene 2007), ISO 159, SVS 20N (Eiroa et al. 2008), and IRAS 03220+3035N (Connelley & Greene 2010). Ca i emission lines at 1.978 and 1.987 μm have also been detected toward the embedded protostars and suggested to be disk tracers (e.g., SVS 13, HH 26-IRS, HH 34-IRS, HH 72-IRS, HH 300-IRS (IRAS 04239+2436), HH 999-IRS (IRAS 06047−1117), and EX Lup; Davis et al. 2011; Kóspál et al. 2011). Yet none of these previous observations have had their kinematics studied in detail, primarily due to the lower spectral resolution of those studies, R(=λ/Δλ) = 1200–18,000.
ESO Hα 279a is a YSO in the Serpens molecular cloud region at a distance of 429 pc (Dzib et al. 2010, 2011). We classified it as a flat-spectrum YSO based on the extinction-corrected spectral index of −0.06 in the range of 2–24 μm provided by Dunham et al. (2015). This object is the source of the Herbig-Haro objects HH 106 and HH 107 that have a separation of 1.75 pc (Reipurth & Eiroa 1992; Aspin et al. 1994). Despite being found a distance of 5' away, ESO Hα 279a shows a clear connection with the main cloud based on its consistent systemic velocity of  km s−1, measured from C18O (1−0) and N2H+ (1−0) molecular line observations (McMullin et al. 2000; Lee et al. 2014).
With velocity-resolution spectra of ∼15 km s−1, Aspin & Greene (2007) showed the CO overtone emission and the double-peaked Na i emission lines in the spectrum of ESO Hα 279a. Based on the sharp uprising shape of the features and a small broadening in the blueshifted part of the CO bandhead at 2.3 μm, they interpreted the emission lines originating from a wind or an accretion funnel flow rather than a circumstellar disk. They also suggested that the small broadened part of the bandhead of the first CO overtone lines, called a shoulder (e.g., Najita et al. 1996), is not due to the broadening by disk kinematics but rather to the contribution of the H2O emission lines at 2.293 μm. However, the broad shoulder of the CO bandhead is not the crucial factor to determine whether CO emissions originate from a wind or the disk. For example, disk models work very well for the CO overtone emission lines of some YSOs lacking broad shoulders, such as MWC 349 (Kraus et al. 2000), IRAS 08576−4334, IRAS 11097−6102 (Bik & Thi 2004), SVS 13 (Carr et al. 2004), and V1331 Cyg (Najita et al. 2009). It is the symmetric double-peaked line profile that is the crucial evidence of a Keplerian rotating disk. Therefore, the shapes of resolved line profiles are necessary for judging the origin of the CO emission. In this paper, we use the advantage of high spectral resolution to examine the individually resolved R-branch lines of CO ( ) in the range of 2.30–2.32 μm. We fit them with the symmetric double-peaked line profiles, which are characteristic of a Keplerian disk.
We present observations of ESO Hα 279a using IGRINS, which provides a velocity resolution of ∼7 km s−1 at 2 μm. Specifically, this velocity resolution allows us to study the kinematics of the inner disk by resolving disk tracer atomic and molecular emission lines of Ca i at 1.978 and 1.987 μm, Na i emission lines at 2.206 and 2.209 μm, and CO overtone emission lines in the range of 2.29–2.45 μm.
In Section 2, we describe the IGRINS observations and data reduction. We also briefly address the identification of stellar absorption and ionized iron forbidden lines and the basic properties of the central star and jet based on the kinematical information of these spectral lines. In addition, we examine the molecular hydrogen emission line as a possible disk tracer in this source. Section 3 presents our estimates of the mass accretion rate toward the central star using the Brγ emission line. In Sections 4 and 5, we show that disk models fit the overall line profiles of CO and Na i/Ca i emission very well; then, using the best-fit disk models, we drive the inner disk properties of ESO Hα 279a. In Section 6, we discuss the strengths and weaknesses of our CO model, as well as different interpretations of the symmetric double-peaked line profile of Na i. We summarize our results on the inner warm disk properties of the flat-spectrum YSO ESO Hα 279a in Section 7.
2. Observation and Data Reduction
Near-infrared H- and K-band spectra of ESO Hα 279a (R.A. =  , decl. =
  (J2000)) were obtained using IGRINS mounted on the 2.7 m Harlan J. Smith Telescope of the McDonald Observatory (see Figures 1 and 2). IGRINS has two separate 2048 × 2048 pixel Teledyne HAWAII-2RG detectors that simultaneously obtain H- and K-band spectra. The slit size is 1'' × 15'', and the plate scale is 0
 27 pixel−1. IGRINS H- and K-band spectra cover the entire wavelength range from 1.50 to 2.45 μm with a resolving power of R = 45,000 with ∼3.5 pixel sampling, corresponding to the velocity resolution of 7 km s−1 at 2 μm (Park et al. 2014).
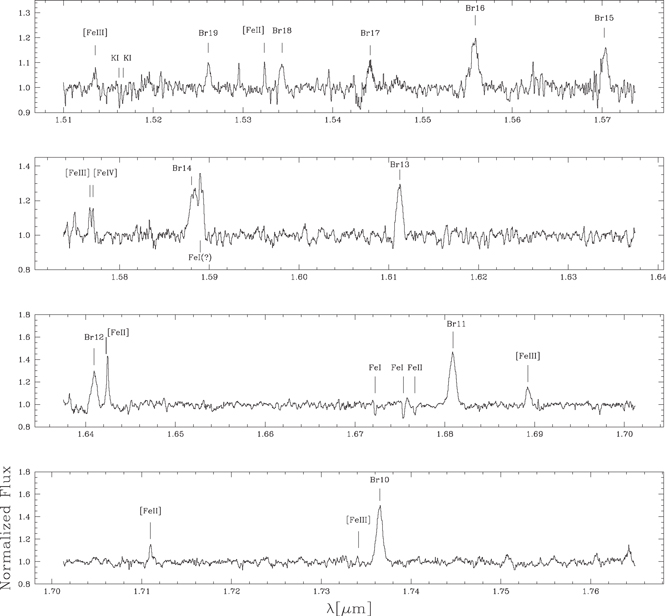
Figure 1. Telluric-corrected and normalized IGRINS spectrum of the flat-spectrum ESO Hα 279a covering the full H-band from 1.510 to 1.765 μm. The identified lines are also listed in Table 1. We adopt a normalized flux level of 6.40 × 10⁻¹⁰ erg s−1 cm−2 μm−1.
Download figure:
Standard image High-resolution imageThe observation of ESO Hα 279a was carried out during IGRINS commissioning on 2014 May 26 (UT 2014 May 27). We employed a nod-on-slit observational mode in an ABBA sequence, such that the telescope is nodded 7'' along the slit in the east–west direction, to remove background sky emission from AB-subtracted pairs. Total exposure time was 4 × 300 s, yielding a continuum signal-to-noise ratio of ∼120 at 2.2 μm. The spectra were calibrated using flat frames of a halogen lamp, and the wavelength solution was derived from a Th–Ar arc lamp spectrum with a Python-based data reduction pipeline package (Lee 2015). A standard star with spectral type A0V, V1431 Aql, was observed at the same air mass as ESO Hα 279a to correct for telluric absorption lines. We removed the telluric lines from the spectrum of our target source by dividing with the spectrum of the A0 standard star. We eliminated strong intrinsic photospheric hydrogen absorption lines from the standard spectrum, which results in a blackbody spectrum with telluric lines. The following is a detailed description of how we got the standard-star spectrum with only telluric lines. (1) We made a spectrum by cutting the hydrogen absorption lines in the standard-star spectrum. (2) We made another spectrum by cutting the telluric lines only in the range of the hydrogen absorption lines from the original standard-star spectrum. (3) We divided the original standard-star spectrum by the one made in step (2). (4) We finally multiplied the spectrum made in step (1) by the one made in step (3). In addition, we manually removed some of the remaining abnormal spike features of the telluric lines in the edges of some of the orders. Overall, the robustness of our telluric correction is seen in the range of CO overtone emission lines where most of the CO R- and P-branch lines have a good fit with the model (Figure 2 and see Section 4).
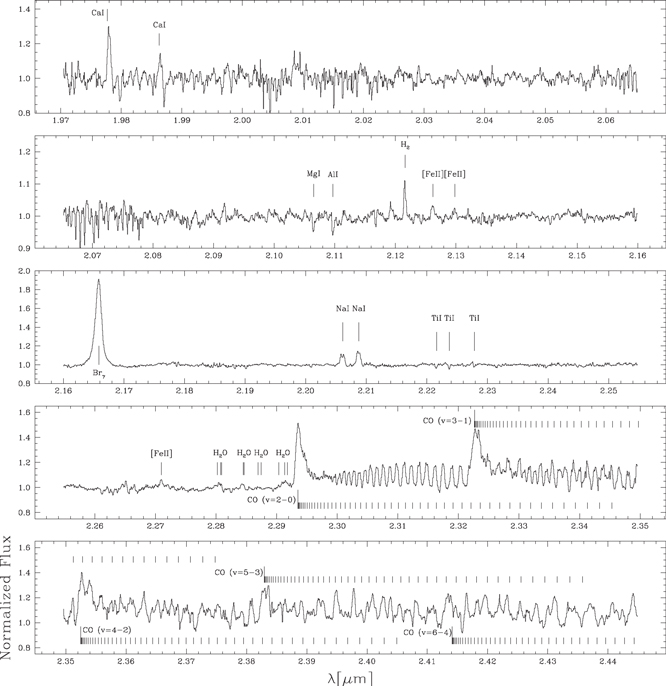
Figure 2. Telluric-corrected normalized IGRINS spectrum of the flat-spectrum ESO Hα 279a covering the full K-band from 1.970 to 2.445 μm. The Na iemission lines at 2.206 and 2.209 μm and CO overtone emissions are clearly detected. Only the R-branch lines of each CO overtone emission are marked. The normalized flux level is 4.38 × 10⁻¹⁰ erg s−1 cm−2 μm−1.
Download figure:
Standard image High-resolution imageFlux calibrations were not carried out because the IGRINS slit width is fixed. However, we derived the continuum fluxes of both H- and K-band spectra based on Two Micron All-Sky Survey (2MASS) magnitudes. The estimated H- and K-band continuum fluxes are 6.40(±1.07) × 10−10 erg s−1 cm−2μm−1 ( mag,
mag,  mag) and 4.38(±0.76) × 10−10 erg s−1 cm−2μm−1 (
 mag, AK = 1.08 mag) at AV = 9.6 mag (Dunham et al. 2013), respectively. The adopted extinction of AV = 9.6 mag is the derived mean value toward all Class II YSOs in the Serpens star-forming region based on optical studies. We adopted 0.2 mag (around 17% in brightness) photometric uncertainties at both the H- and K-band magnitudes due to near-infrared photometric variabilities toward YSOs in Serpens, Orion A, ρOph, ONC, IC 348, and NGC 1333 (Kaas 1999; Carpenter et al. 2001; Scholz 2012). The maximum uncertainty in the edge of each band due to the assumption of the flux flatness inside each bandwidth is less than 10% by applying the same spectral index in each bandwidth as the derived spectral index of −1.27 between the measured H- and K-band fluxes.
We also shifted the spectrum in wavelength with a total velocity shift of +22.33 km s−1, which is measured from the comparison between the observed and the calculated wavelengths of the resolved CO ( ) R-branch lines. This shift is consistent with the expected shift using
  km s−1 at the time of the observation (UT 2014 May 27, 10 hr 32 minutes 57.939 s) and the average
  of ∼8 km s−1 for the Serpens molecular clouds (McMullin et al. 2000; Lee et al. 2014).
With IGRINS providing a large spectral grasp at high resolution for both the H and K bands simultaneously, we detect many emission lines related to the inner disk activities, such as the Brackett line series from  to
to  , the Ca i emission lines at 1.978 and 1.987 μm, the symmetric double-peaked Na i doublets at 2.206 and 2.209 μm, the H2(
 S(1)) emission at 2.1218 μm, the H2O emission lines in the range of 2.28–2.29μm, and the CO overtone line series from
  to
to  (where v is the vibrational quantum number). In Table 1, we list all of these identified spectral lines except the unresolved H2O emission lines. We basically fit all the emission lines with Gaussian, Lorenzian, and Voigt profiles using the IRAF splot package to get the equivalent widths and center wavelengths. Weak emission lines are well fitted by the Voigt profile only. The hydrogen emission lines are quite well fitted by all three profiles. We estimated the error of the equivalent widths of the hydrogen lines from the different profile fittings. In Figure 2, we mark the 10 strongest H2O emission lines from Table 2 in Thi & Bik (2005).
Table 1. Identified Possible Spectral Lines toward ESO Hα 279a
| Species |
 a
a
|
 b
b
|
Δvc | EWd | Species |
 a
a
|
 b
b
|
Δvc | EWd |
|---|---|---|---|---|---|---|---|---|---|
| (μm) | (μm) | (km s−1) | (Å) | (μm) | (μm) | (km s−1) | (Å) | ||
| H-band | K-band | ||||||||
| [Fe iii] | 1.51458 | 1.51359 | −196 | −0.77 | Ca i | 1.97820 | 1.97816 | −6 | −1.90 |
| K i | 1.51631 | 1.51630 | −2 | 0.20 | Ca i | 1.98680 | 1.98674 | −9 | −0.65 |
| K i | 1.51684 | 1.51679 | −9 | 0.15 | Mg i | 2.10667 | 2.10668 | 1 | 0.12 |
| H i (Br 19) | 1.52606 | 1.52627 | 41 | −0.58 ± 0.10 | Al i | 2.10988 | 2.10989 | 1 | 0.18 |
| [Fe ii] | 1.53389 | 1.53252 | −268 | −0.30 | H2 ( S(1)) S(1)) |
2.12180 | 2.12178 | −3 | −0.38 |
| H i (Br 18) | 1.53418 | 1.53443 | 49 | −0.61 ± 0.09 | [Fe ii] | 2.12869 | 2.12641 | −321 | −0.26 |
| H i (Br 17) | 1.54389 | 1.54428 | 77 | −0.67 ± 0.02 | [Fe ii] | 2.13335 | 2.13000 | −470 | −0.15 |
| H i (Br 16) | 1.55565 | 1.55592 | 52 | −2.53 ± 0.37 | H i (Brγ) | 2.16612 | 2.16601 | −15 | −16.39 ± 0.33 |
| H i (Br 15) | 1.57007 | 1.57046 | 74 | −1.20 ± 0.15 | Na i | 2.20625 | 2.20625 | 0 | −1.11 |
| [Fe iii] | 1.57641 | 1.57512 | −245 | −0.53 | Na i | 2.20897 | 2.20892 | −7 | −1.23 |
| [Fe iv] | 1.57798 | 1.57683 | −218 | −0.70 | Ti i | 2.22173 | 2.22176 | 4 | 0.15 |
| H i (Br 14) | 1.58806 | 1.58839 | 62 | −3.59 ± 0.87 | Ti i | 2.22389 | 2.22390 | 1 | 0.14 |
| Fe i | 1.58952 | 1.58941 | −21 | −0.54 | Ti i | 2.22801 | 2.22802 | 1 | 0.06 |
| H i (Br 13) | 1.61093 | 1.61132 | 73 | −2.50 ± 0.34 | [Fe ii] | 2.27273 | 2.27117 | −206 | −0.25 |
| H i (Br 12) | 1.64072 | 1.64108 | 66 | −3.12 ± 0.57 | CO ( ) ) |
2.29350 | ⋯ | ⋯ | ⋯ |
| [Fe ii] | 1.64340 | 1.64257 | −260 | −2.23 | CO ( ) ) |
2.32270 | ⋯ | ⋯ | ⋯ |
| Fe i | 1.67239 | 1.67237 | −4 | 0.27 | CO ( ) ) |
2.35247 | ⋯ | ⋯ | ⋯ |
| Fe i | 1.67531 | 1.67552 | 38 | 0.55 | CO ( ) ) |
2.38295 | ⋯ | ⋯ | ⋯ |
| Fe ii | 1.67673 | 1.67679 | 11 | 0.23 | CO ( ) ) |
2.41414 | ⋯ | ⋯ | ⋯ |
| H i (Br 11) | 1.68065 | 1.68101 | 64 | −5.09 ± 0.79 | ⋯ | ⋯ | ⋯ | ⋯ | ⋯ |
| [Fe iii] | 1.69023 | 1.68942 | −143 | −1.21 | ⋯ | ⋯ | ⋯ | ⋯ | ⋯ |
| [Fe ii] | 1.71251 | 1.71111 | −245 | −0.39 | ⋯ | ⋯ | ⋯ | ⋯ | ⋯ |
| [Fe iii] | 1.73566 | 1.73417 | −257 | −0.23 | ⋯ | ⋯ | ⋯ | ⋯ | ⋯ |
| H i (Br 10) | 1.73621 | 1.73663 | 73 | −4.90 ± 0.71 | ⋯ | ⋯ | ⋯ | ⋯ | ⋯ |
Notes.
aThe λ is calculated from the difference between energy levels tabulated by the National Institute of Standards and Technology (NIST) Atomic Spectra Database Lines Data. The wavelengths for forbidden lines are based on Peter van Hoof's Atomic Line List at http://www.pa.uky.edu/~peter/atomic/. The wavelengths of Ca i lines at the K band are from the Infrared Spectral Atlases of the Sun from NOAO (Wallace et al. 1996). bThe is the observed wavelength with the velocity correction of +22.33 km s−1.
cThe Δv is the velocity difference between λ and
is the observed wavelength with the velocity correction of +22.33 km s−1.
cThe Δv is the velocity difference between λ and  . The minus sign represents the blueshifted velocity compared to that of λ.
dEW is the line equivalent width in angstroms. The minus sign represents emission. Errors of the Brackett series are derived from three different equivalent measurements using the splot package of IRAF.
. The minus sign represents the blueshifted velocity compared to that of λ.
dEW is the line equivalent width in angstroms. The minus sign represents emission. Errors of the Brackett series are derived from three different equivalent measurements using the splot package of IRAF.
Download table as: ASCIITypeset image
2.1. Identified Stellar Absorption and Jet Emission Lines
We identified some of the stellar absorption lines, Fe i, Fe ii, K i, Mg i, Al i, and Ti i, listed in Table 1. The center wavelengths of the K i, Mg i, Al i, and Ti i lines match the expected wavelength, confirming the accuracy of the applied radial velocity.
We also detected the ionized iron forbidden emission lines [Fe ii], [Fe iii], and [Fe iv], which are known as jet tracers (Pyo et al. 2002) (see Table 1). The well-known jet tracers of [Fe ii] emission lines at 1.533, 1.643, and 1.713 μm all show almost the same blueshifted velocity of ∼260 km s−1. Overall, the derived ionized jet velocities of Fe forbidden emission lines are in the range of 200–260 km s−1, and the average velocity line width is ∼40 km s−1. The true velocity range is 280–370 km s−1 assuming a jet inclination of  (Aspin & Greene 2007). These high velocities with narrow line widths suggest that these detected ionized Fe forbidden emission lines trace the high-velocity component (HVC) of jets defined by Pyo et al. (2002). Particularly, the weakly detected 2.133 μm [Fe ii] emission line draws our attention due to its highly blueshifted velocity of 470 km s−1, which is ∼660 km s−1 when we assume a jet inclination of
  . If the inclination angle is correct, then this is an extremely high velocity, especially compared to the observed ∼450 km s−1 terminal velocity of HVC in low-mass YSOs suggested by Pyo et al. (2009). We need the high spatial and spectral resolution observation to investigate the properties of this extremely high-velocity jet component of 2.133 μm [Fe ii].
2.2. H2 Emission at 2.1218 

A molecular hydrogen H2( S(1)) emission line at 2.1218 μm is detected. The H2 emission lines have been known as good tracers of the shocked regions in the molecular outflows (Wilking et al. 1990; Davis et al. 2008; Lim et al. 2012), as well as the accreting inner disks of YSOs (Bary et al. 2003, 2008). In our target source, the H2 emission line might be more closely related to the inner disk, since the measured radial velocity from the central wavelength of the emission is similar to the systemic velocity of the central source (see Table 1). We obtained a full width at half maximum of ∼45 km s−1 and a line width in the wing of ∼100 km s−1 from a Gaussian fitting. If the line broadening is only due to the disk kinematics, we find that H2 emission is mainly from the disk in the range of around 0.3–1.3 au, assuming a central stellar mass of 1.5M⊙ and a disk inclination of
  (Aspin & Greene 2007). However, we note that the emission line does not show the double-peaked profile that is clear evidence of rotational motion in the disk.
3. Disk Accretion Rate
Strong and sequential Brackett series of hydrogen recombination emission lines are observed in the H and K bands of ESO Hα 279a (see Figures 1 and 2). Brackett emission series from  to
to  at the H band are all redshifted compared to the rest velocity of the central star, while Brγ (
 ) is slightly blueshifted (see Table 1). The origin of the redshifted Brackett series is not well known.
However, the luminosity of the Brγ emission line is strongly correlated with the disk accretion rate and is thus useful for studying the accretion process in highly embedded YSOs at infrared wavelengths (Muzerolle et al. 1998b; Natta et al. 2004; Mendigutía et al. 2011). We calculate the Brγ luminosity with the observed equivalent width (−16.39 Å), assuming a K-band continuum flux of 4.38(±0.76) × 10−10 erg s−1 cm−2 μm−1 at Ks = 8.54 ± 0.20 mag and AK = 1.08 mag derived by adopting AV = 9.6 mag (Dunham et al. 2013) and following the extinction law of Cardelli et al. (1989). The estimated Brγ luminosity is found to be  = 1.78(±0.31) × 1031 erg s−1 at the adopted distance of 429 pc. From the Brγ luminosity, we estimate the accretion luminosity
  using the following relations:
  =
= 
 in Muzerolle et al. (1998b),
![$[\mathrm{log}({L}_{\mathrm{Br}\gamma }/{L}_{\odot })+4]-0.7$](https://content.cld.iop.org/journals/0004-637X/844/1/4/revision1/apjaa799eieqn43.gif) in Natta et al. (2004), and
in Natta et al. (2004), and  /
/ log
log  in Mendigutía et al. (2011). We can then estimate the mass accretion rate with
  =
=  10−7M⊙ yr−1. The applied central stellar mass (M⋆) and radius (R⋆) for the calculation of the mass accretion rate are 1.5 M⊙ and 2.0 R⊙, respectively.
Both the mass (ranges of 1.5–2.2 M⊙) and radius (ranges of 1.5–3.0R⊙) of the central star are derived from the evolutionary model of Siess et al. (2000), based on the magnitudes of  mag and
  mag obtained by Aspin et al. (1994). The applied temperature and bolometric magnitude to obtain these stellar parameters in the Hertzsprung–Russell diagram are
  K and
K and  mag, respectively; the estimated color and absolute magnitude are
  mag and
  mag at the distance of 429 pc and AV = 9.6 mag. We adopt the bolometric correction and color-to-temperature relation of Kenyon & Hartmann (1995). However, we note that the V magnitude could be affected by an accretion process. The overestimated V luminosity compared to the R luminosity might make this source have a higher mass and older age than the real.
As a result of this exercise, we find that the accretion properties of the ∼1.5 M⊙ flat-spectrum YSO are similar to those of other YSOs. For example, the obtained accretion rate of 2–10 × 10−7 M⊙ yr−1 is consistent with the relations between the accretion rate and the central stellar mass  by Muzerolle et al. (2005) and
  by Natta et al. (2006).
4. Modeling of the CO Overtone Emission Lines
The CO overtone emission lines are good tracers of the warm inner disks of YSOs (e.g., Najita et al. 2000, 2003; Wheelwright et al. 2010; Cowley et al. 2012; Ilee et al. 2014). The most prominent features detected in a K-band spectrum of ESO Hα 279a are the CO overtone emission lines of  ,
,  , and
, and  . These features, shown in Figure 2, cover most wavelengths from 2.29 to 2.45 μm. Here, we apply the model fit from the first to the fifth CO overtone emission lines simultaneously, which provides more constraints on the determination of both the temperature and density of the warm CO gaseous inner disk compared to a model fitted only to the first CO overtone emission lines.
In our model, we assume a simple geometrically flat Keplerian rotating disk with a power-law distribution in density,  , and temperature,
  , where
  is the inner radius of the disk;
  and
and  are the column density and temperature of the disk at the inner radius, respectively; and p and q are the power indices of the density and temperature distributions, respectively. We also assume the CO gas to be in local thermodynamic equilibrium (LTE) and consider the vibrational and rotational transitions up to v = 15 and J = 110 to calculate the total partition function of a CO molecule, where J is the rotational quantum number (see details of the modeling of the CO overtone emission lines in Kraus et al. 2000). The derived CO line profiles are smoothed with a Gaussian profile with the width of the IGRINS instrumental resolution of 7 km s−1 at the K band. Since the estimated velocity broadening is only ∼1 km s−1 at a temperature of 4000 K, we do not consider the line broadening of CO gas due to its thermal motion.
There are six model parameters:  , and
, and  , where
  and
and  are the Keplerian velocities at the inner and outer radii and i is the inclination of the Keplerian orbit. To reduce the number of free parameters, we fix the power indices of the radial distributions of temperature and density as p = 1.5 and q = 0.5, respectively, following Hayashi (1981). For example, p = 1.5 and q = 0.4 are the typically obtained power indices in disks around YSOs (Guilloteau & Dutrey 1994; Guilloteau et al. 2011).
We define a goodness of fit,

where  and
and  are the observed and calculated normalized fluxes, respectively. In order to calculate
  properly, we calculate the model flux at each observed wavelength. In the four-dimensional parameter space,
  , and
, and  , we find a set of best-fitting parameters that minimize the
  values. The
  fitting results of four free parameters are shown in Figure 3, with the best-fitting values of
  cm−2,
cm−2,  K, Vin sin i = 55.5 km s−1, and
  km s−1. Figure 4 shows the best-fitting result with red lines and the observed CO overtone emission lines with black lines. In this Keplerian disk model, the derived temperature and column density mainly rely on the relative intensities among five CO overtone bandheads, while the derived velocities at the inner and outer radii mainly depend on the line width in the wing (maximum line width) and the separation between two peaks in the symmetric double-peaked line profiles of CO (
 ) R-branch lines, respectively. In Figure 5, we overlap 11 CO (
 ) R-branch lines from R(25) to R(15) in the range of wavelengths of 2.30–2.32 μm to show the consistency of these line features. The averaged line (solid line) shows the symmetric double-peaked profile, which is the characteristic feature of a Keplerian rotating disk.

Figure 3. The  defined in Equation (1) as a function of each of four free parameters. The four free parameters are
  , column density at the inner disk edge;
  , temperature in the inner disk edge;
  , line-of-sight velocity at the inner disk edge; and
  , line-of-sight velocity at the outer disk edge.
Download figure:
Standard image High-resolution image
Figure 4. Comparison of observed CO overtone lines and calculated ones. The observed spectrum is shown with black lines, and the calculated one is shown with red lines. The enlarged spectrum in the range of 2.314–2.322 μm is shown in the inset in the upper panel. Some of the lines in the box show a clear two-peaked profile, which is evidence of a Keplerian rotating disk (see also Figure 5).
Download figure:
Standard image High-resolution image
Figure 5. Dotted lines are 11 R-branch lines from R(25) to R(15) of CO ( in the range of wavelengths of 2.30784–2.32059 μm. The solid line is the averaged line profile of all 11 lines. It shows a symmetric double-peaked profile, which is evidence of a Keplerian disk.
Download figure:
Standard image High-resolution imageThe derived model provides a good fit through all five CO overtone emission bands, except the first CO ( ) bandhead. We expect that the higher observed flux intensity at the first CO overtone bandhead compared to the model flux might be due to non-LTE effects, which we will explore in a separate paper. The mismatch at the bandhead of CO
  does not significantly affect each line profile related by kinematical properties, such as velocities at the inner and outer radii of the CO disk. When we adopt a central stellar mass of 1.5 M⊙ and assume 45° for the inclination of the CO disk, we find that CO gas emission is mainly from a Keplerian warm disk in the radial range from 0.22 to 3.00 au and
  = 4600 K.
5. Modeling of Na i and Ca i Emission Lines
We detect the rare Na i emission lines at 2.206 and 2.209 μm, and both lines display a symmetric double-peaked profile, especially the 2.206 μm Na i, which is strong evidence of the Keplerian rotational disk (Figure 6). There are asymmetries at the wings of both Na i emission lines showing that emission at the blue wing is broader than that at the red wing. Emission larger than 100 km s−1 is likely from the accretion flow, and the asymmetry may be due to the redshifted absorption of infalling material (Muzerolle et al. 1998a). Assuming the optically thin and LTE conditions, we expect that the ratio of two Na i lines at 2.206 and 2.209 μm is 2, which is in fact the ratio of the statistical weights of the 2P3/2 and 2P1/2 states. The observed intensity ratio is around 1, which means that Na i–emitting gas is neither optically thin nor under LTE conditions. However, we can still extract the kinematic properties of the Na i gaseous disk from both the 2.206 and 2.209 μm Na i emission lines, even though the 2.209 μm Na i emission line does not show the ideal double-peaked profile of the Keplerian rotating disk.
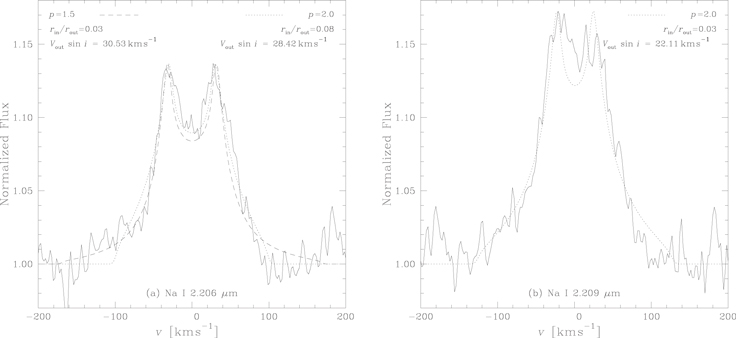
Figure 6. Na i emission lines at (a) 2.206 μm and (b) 2.209 μm. The line profiles are calculated based on the Keplerian disks with the parameters written in each panel. The observed spectrum is plotted with a solid line, and model spectra are plotted with dotted and dashed lines.
Download figure:
Standard image High-resolution imageIn order to model the Na i lines, we first assume a simple geometrically flat Keplerian disk with a power-law distribution in density. We only consider three parameters for fitting this symmetric and double-peaked profile: the line-of-sight velocity at the outer boundary of the disk,  ; the ratio of the inner to the outer radii,
  ; and the power index of the radial column density p. The power index of the density profile is limited to the parameter space between 1.0 and 2.5 with 0.5 step size, since the typical and most frequently used value is 1.5 (Guilloteau & Dutrey 1994; Guilloteau et al. 2011). Again, we smooth a calculated model line profile with a Gaussian with the width of the 7 km s−1 IGRINS instrumental resolution. We do not consider the line broadening of Na i gas due to its thermal motion, since the estimated velocity broadening is only ∼1.2 km s−1 at the average temperature of 4000 K. We also use
  as defined in Equation (1) and find a set of parameters that minimize the
  values.
Figure 6(a) compares the observed line profile at 2.206 μm (solid line) with calculated model profiles for p = 1.5 (dashed line) and p = 2.0 (dotted line). The best-fitting parameters are  and
and  km s−1 for p = 1.5 and
  and
and  km s−1 for p = 2.0. Figure 6(b) compares the observed line profile at 2.209 μm with a calculated model profile for p = 2.0. The best-fitting parameters are
  and
and  km s−1. In this Keplerian disk model, the derived velocities at the inner and outer radii mainly rely on the line width in the wing (maximum line width) and the separation between two peaks in the symmetric double-peaked line profiles, respectively.
We conclude that the 2.206 μm Na i emission is mainly from the inner disk region in the radial range from 0.02 to 0.72 au with p = 1.5 or from 0.07 to 0.83 au with p = 2.0 when we adopt a central stellar mass of 1.5 M⊙ and a disk inclination of 45°. Most of the 2.209 μm Na i emission seems to come from the narrow inner hot disk region in the range from 0.04 to 1.36 au with p = 2.0.
Overall, Na i emissions mainly originate in the Keplerian disk with the range of 0.04–1.00 au, where hot Jupiters reside. Confirming the Keplerian motion in this range using Na i emission lines is an important first step to understand how the inward migration stops and how hot Jupiters maintain their stable orbits.
Emission lines from Ca i at 1.978 and 1.987 μm are also detected. Davis et al. (2011) suggested that Ca i emission lines are associated with an accreting disk from the spectroscopic studies of seven embedded YSOs. In Figure 7, we show the 1.978 μm Ca i emission line (solid line) with two Keplerian model profiles for p = 1.5 (dashed line) and p = 2.0 (dotted line). Overall, these two simple models provide good fits to the line profile, even though the line profile is not the perfect symmetric double-peaked feature. The best-fitting parameters are  and
and  km s−1 for p = 1.5 and
  and
and  km s−1 for p = 2.0. We find that 1.978 μm Ca i emission is mainly from the range of 0.04–1.25 au at p = 1.5 and 0.12–1.50 au at p = 2.0, assuming the disk inclination of
  . We do not analyze the 1.987 μm Ca i emission line here, since the redshifted part of the line is heavily contaminated by strong telluric lines.
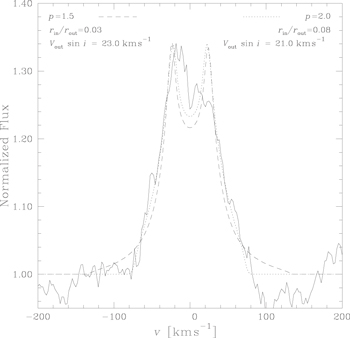
Figure 7. Ca i emission line at 1.978 μm. The line profiles are calculated based on the Keplerian disks with the parameters written inside the panel. The observed spectrum is plotted with a solid line, and model spectra are plotted with dotted and dashed lines.
Download figure:
Standard image High-resolution image6. Discussions
Many people have fit LTE models to the bandhead of the first CO overtone series to get the parameters of gas disks. A partial list of examples is Kraus et al. (2000) for MWC 349, Aspin & Greene (2007) for ESO Hα 279a, Wheelwright et al. (2010) for seven intermediate/massive YSOs, and Ilee et al. (2014) for five Herbig Ae/Be stars observed with the Very Large Telescope (VLT)/Cryogenic Infrared Echelle Spectrograph (CRIRES). In this paper, we are able to better determine the disk properties of ESO Hα 279a by the LTE modeling of all five CO overtone series from  to
to  covering the wavelength from 2.29 to 2.45 μm. Our model quite successfully fits the observed series except for the bandhead of the first overtone series. Near this bandhead, the observed flux is larger than the flux calculated from the model. Furthermore, the observed peak flux of the bandhead of the first overtone is larger than that of the second overtone series (see Figure 4), which is the case where CO line opacity is almost infinite (Kraus et al. 2000). Thus, we think that the bandhead of the first overtone series is more influenced by non-LTE effects than other parts of the spectrum.
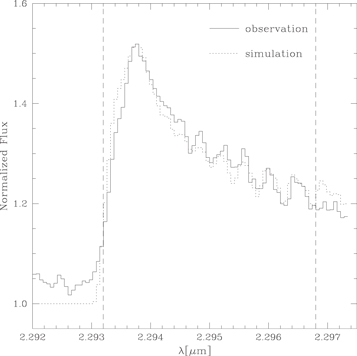
In Figure 8, we show an example of the model fitting only for the first CO overtone bandhead. The best-fitting parameters are  cm−2,
cm−2,  K,
K,  km s−1, and
  km s−1. We can nicely fit the observed first overtone bandhead spectrum with the parameters. However, we note that this model gives too much flux for the other CO bandheads. Apparently, the derived values of temperature and density are too high for the rest of the CO overtone bandheads. The velocity parameters determined from only the first overtone bandhead are not much different from those determined from all five CO overtone series. This is due to the fact that the kinematics is mostly determined by the widths of lines.
Figure 8. Comparison of the observed CO first overtone bandhead and calculated ones. The observed spectrum is shown with a solid line, and the calculated one is shown with a dotted line. Two vertical dashed lines define the range for the calculation of  to find the best-fitting model. The best-fitting parameters are
  =
=  cm−2,
cm−2,  , Vin sin
  , and
, and  .
.
Download figure:
Standard image High-resolution image
We have synthesized Na i emission lines with a Keplerian disk model and found that they are good tracers of the innermost disk. Na i emission lines have been detected toward several Class I/flat-spectrum YSOs: HH 100IR (TS 2.6), RCrA IRS2 (TS 13.1; Doppmann et al. 2005; Nisini et al. 2005), ESO Hα 279a (Aspin & Greene 2007), ISO 159, SVS 20N (Eiroa et al. 2008), and IRAS 03220+3035N (Connelley & Greene 2010). Two YSOs among them, HH 100IR (TS 2.6) and ESO Hα 279a, show double-peaked Na i emission lines. We have carefully searched the above literature of all YSOs with Na i emission lines and found that all of them have CO overtone emission lines at 2.3 μm. However, not all of the YSOs emitting CO overtone lines show Na i lines. It seems that Na i emission lines trace the innermost disk region where accretion starts. Our model results of both Na i and CO lines show that Na i lines originate closer to the central star than CO overtone lines. We find that the radius range of the Na gaseous disk is 0.04–1.00 au, where hot Jupiters reside, which supports the idea that the inner gas disk might control the inward migration processes of exoplanets (Lin et al. 1996). Furthermore, the derived average inner radius of the Na gaseous disk,  = 0.04 au (see Section 5), is close to the typical corotation radius, 0.03–0.08 au (Najita et al. 2003), where material accretes to the central star following magnetic field lines connecting the star and disk in magnetospheric accretion models (Königl 1991; Calvet & Hartmann 1992; Shu et al. 1994).
However, there is a possibility that the Na i symmetric double-peaked line profile might be due to the simple overlap of the stellar absorption line onto the broad emission line, suggested by Aspin & Greene (2007). In fact, there are detections of stellar absorption lines in our observation, such as Fe i, Fe ii, K i, Mg i, Al i, and Ti i (see Figures 1 and 2). In this interpretation, we suggest that the broad emission lines of Na i might still be related to the disk, either from the farther outer disk region or from the disk wind region. However, we do not expect that these emission lines are related to the jet/outflow or the infalling flow, because the central velocity of these emission lines is not blue- or redshifted (see Table 1). Additionally, the dip in the center of the 1.978 μm Ca i emission can also be interpreted as the overlap of the stellar absorption line onto the broad emission line. The central velocity of this emission line is also close to that of stellar radial velocity, which supports the disk origin of this gas emission.
7. Summary
The near-infrared spectrometer IGRINS has the broadest spectral grasp at high resolution, and a single spectrum allows for the detailed study of the inner disk of YSOs at  au radius. We have presented
  - and
- and  -band spectra of a flat-spectrum YSO, ESO Hα279a, that show many atomic and molecular emission lines, as well as stellar absorption lines (see Figures 1 and 2). We measure the mass accretion rate of our target source with the Brγ emission line and study the disk properties with CO overtone and Na i/Ca i emission lines.
First, we derive the mass accretion rate of  from the measured Brγ luminosity of 1.78(±0.31) × 1031 erg s−1 at a distance of 429 pc. We find that the accretion property of the 1.5
  flat-spectrum ESO Hα279a is similar to those of other YSOs (Muzerolle et al. 1998b; Natta et al. 2004; Mendigutía et al. 2011).
Second, we find the inner warm rotating CO gaseous disk in the radial range from 0.22 to 3.00 au by modeling the five CO overtone series of  , and
, and  . In this model, we assume a simple geometrically flat Keplerian rotational disk with the power indices
  and
and  for density and temperature distributions, respectively, and a disk inclination of 45°. We find disk properties of
  cm−2,
cm−2,  K,
K,  km s−1, and
  km s−1, which are determined by the best-fitting model parameters.
Lastly, we find the Na i gaseous Keplerian disk in the radial range of 0.02–0.72 au at p = 1.5 and 0.07–0.83 au at p = 2.0 by modeling the symmetric double-peaked 2.206 μm Na i emission line. In the case of the 2.209 μm Na i line, this emission is mainly from the radial range of 0.04–1.36 au at p = 2.0. We also find that Ca i emission originates in a disk region similar to that for Na i, based on the Keplerian model of the 1.978 μm Ca i spectral line.
This work used the Immersion GRating INfrared Spectrometer (IGRINS), which was developed under a collaboration between the University of Texas at Austin and the Korea Astronomy and Space Science Institute (KASI) with the financial support of the US National Science Foundation under grant ASTR1229522 of the University of Texas at Austin and the Korean GMT Project of KASI. The IGRINS pipeline package PLP was developed by Dr. Jae-Joon Lee at the Korea Astronomy and Space Science Institute and Professor Soojong Pak's team at Kyung Hee University.