


Abstract
Collisions between sintered icy dust aggregates are numerically simulated. If the temperature of an icy aggregate is sufficiently high, sintering promotes molecular transport and a neck between adjacent grains grows. This growth changes the mechanical responses of the neck. We included this effect in a simulation code, and conducted collisional simulations. For porous aggregates, the critical velocity for growth, below which the mass of an aggregate increases, decreased from 50 m s−1 for the non-sintered case to 20 m s−1. For compacted aggregates, the main collisional outcome is bouncing. These results come from the fact that the strength of the neck is increased by sintering. The numerical results suggest that the collisional growth of icy grain aggregates is strongly affected by sintering.
Export citation and abstract BibTeX RIS
1. Introduction
Planetary formation starts from the collisional coagulation of sub-micron-sized dust grains, which in turn leads to the formation of dust aggregates. These aggregates grow further through collisional sticking. Although the formation process of planetesimals is still unclear, collisional growth of dust grains and dust aggregates plays a critical role in the first step of planetary formation.
Collisions of dust grains have been studied both experimentally and theoretically. An important parameter is the critical velocity for sticking, below which a grain (or grain aggregate) can stick to another. Chokshi et al. (1993) derived a critical velocity for sticking in collisions between two spherical dust grains. If the collisional velocity is higher than the critical velocity, the grain bounces. They determined that the critical velocity for silicate dust grains 1 μm in size is ∼0.1 m s−1. On the other hand, the critical velocity determined experimentally is ∼1 m s−1 (Poppe et al. 2000). Plastic deformation (Poppe et al. 2000), hysteresis of adhesion (Krijt et al. 2013b) or a large surface energy (Kimura et al. 2015) are possible causes of the discrepancy. Collisional growth is highly dependent on the material properties. This is in contrast to the later stage of planetary formation, where gravitational attraction plays a pivotal role independent of the material composition.
The numerical simulation (Wada et al. 2009) of dust aggregate collisions showed that the critical velocity for collisional growth, where the mass of the largest fragment after collision is larger than the mass of the larger object before collision, is 60 m s−1 for H2O ice aggregates and they estimated 6 m s−1 for silicate aggregates. This variation in the critical velocities is the result of differences in the surface energy and elasticity of the constituent materials. The shape of a dust grain is usually assumed to be spherical for simplicity. Previous numerical simulations (Dominik & Tielens 1997; Wada et al. 2009) are based on theories (Johnson 1987; Dominik & Tielens 1995, 1996) that are applicable to two spherical grains. Moreover, the size of a composing grain has been assumed to be 0.1 μm. If the size of a grain is smaller than 0.1 μm, the critical velocity is higher than 60 m s−1 (Wada et al. 2012). On the other hand, a heating event quickly increases the size of icy grains (Kuroiwa & Sirono 2011). The size of a grain is one of the key quantities to be investigated.
If collision velocity of a dust grain (or aggregate) is lower than the critical velocity, dust grains and aggregates can grow. The collision velocity between dust aggregates is mainly determined by the turbulence of protoplanetary nebula gas (Ormel & Cuzzi 2007) and radial migration of aggregates due to gas drag (Weidenschlling 1977). A typical maximum collisional velocity is ∼50 m s−1. This velocity is much larger than the critical velocity for silicate aggregates and roughly the same as that for icy aggregates. Based on these results, Okuzumi et al. (2012) showed that an icy planetesimal can be formed through coagulation of H2O ice dust aggregates without any special mechanism for concentrating the aggregates.
Based on the studies cited above, it seems that icy dust aggregates can grow sufficiently through collisional sticking. However, an important factor has been missing: H2O ice is a volatile material. Its sublimation temperature is  in protoplanetary nebula conditions. The location where the partial pressure of H2O gas and the equilibrium vapor pressure of H2O are equal is called the snow line. Inside this line, H2O ice cannot exist. The vapor and solid phases of H2O coexist outside this line. In this low-temperature region, sublimation and condensation of H2O molecules proceed simultaneously. In equilibrium, both rates are the same.
To determine the location of the snow line, it is implicitly assumed that the surface of the solid phase is flat. However, the grain shape is assumed to be spherical. The curved surface of the solid phase induces Laplace pressure below the surface. Compressive stress arises below a convex surface and tensile stress arises below a concave surface. This stress slightly changes the chemical potential of the solid phase. As a result, the equilibrium vapor pressure on a convex surface is higher than that on a flat surface. The connection between two grains is called a "neck" because of its concave surface. On the main part of the grain (convex surface), the equilibrium vapor pressure is higher than that on the neck (concave surface). This difference results in transportation of an H2O molecule from a convex to a concave surface, resulting in the growth of a neck. This process is called sintering (Maeno & Ebinuma 1983; Blackford 2007).
The growth of a neck changes the mechanical interactions between grains. For example, smooth rolling that retains the connections between grains is possible before sintering. This smooth rolling is enabled by the tensile stress at the edge of a neck and compressive stress around the center of a neck (Johnson 1987). The tensile stress around the neck edge appears because of cohesive contact between the two spherical grain surfaces. On the other hand, the center of the neck is mostly compressed to flatten the concave surface of the grain. A neck is covered by transported H2O molecules after sintering. Then breakup of a neck is necessary for rolling motion because the tensile stress is negligible inside the grown part compared to that inside the original neck. If sintering does not take place, rolling friction dissipates a significant fraction of the initial kinetic energy of the aggregates (Dominik & Tielens 1997). We expect that sintering thus changes the collisional outcomes and affects the initial stage of planetary formation.
The collision of sintered dust aggregates was first studied by Sirono (1999). The collisional outcome was bouncing because of the increased strength of the aggregate. The number of grains was ∼100 in that simulation. Based on that study, we increased the number of grains and investigated a wide range of parameter sets in the current simulation. The simulation was two-dimensional (2D) in the sense that the motion of the 3D grain is limited on a plane as done by Dominik & Tielens (1997). We determined dependence of collisional outcomes on the degree of sintering and on the degree of compaction of colliding aggregates. The compaction degree changes because of collisions. Compacted aggregates are stronger than less-compacted aggregates, and the sintering degree changes the mechanical strength of an aggregate. These two factors should affect the collisional outcomes.
In the next section, we describe how a neck grows. We model the mechanical interactions of a sintered contact in Section 3, and an outline of the numerical simulation is shown in Section 4. The numerical results are presented in Section 5, and the effects on planetary formation are discussed in Section 6. Conclusions are given in Section 7.
2. Growth of a Neck
A schematic of a neck between two spherical grains is shown in Figure 1 (thick curve). The radius of a neck without sintering depends on the surface energy, elasticity, and size of the grains (Johnson 1987). For two H2O ice grains 0.1 μm in size, the ratio  , where a is the neck radius and R is the grain radius, is 0.123.
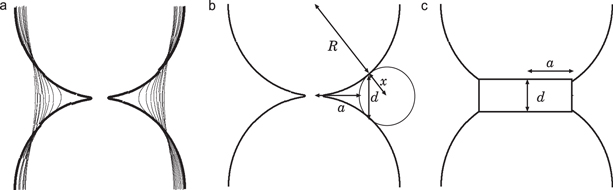
Figure 1. (a) Evolution of the shape of a neck during sintering. The thick curve is the initial surface profile. The thin curves are the profiles at the same time interval of 0.02 in the normalized units (Sirono 2011). (b) The neck profile is approximated by a circle with a radius x smoothly connected to spherical grains of radius R. (c) To calculate elastic responses, a neck is represented by a cylinder with a radius of a and a thickness of d.
Download figure:
Standard image High-resolution imageThe molecules that comprise a grain migrate to the neck to minimize the total surface area. This process is called sintering. Many mechanisms contribute to the migration, including sublimation—recondensation, surface diffusion, grain boundary diffusion, and plastic deformation (Maeno & Ebinuma 1983; Blackford 2007). The neck grows and the main part of the grain shrinks through migration. Sirono (2011) calculated the growth rate of a neck assuming sublimation—recondensation. If other mechanisms contribute to the migration, the growth rate increases as compared to that reported by Sirono (2011). As shown in Figure 1, if the equal-sized grains are connected in a line to form a chain, the final shape of the chain is a cylinder with a radius of  . It can be seen that the growth rate of the neck is fast at the beginning and then decreases over time. This is because the migration rate of molecules is determined by the surface curvature of the neck: a deeply curved surface grows faster than a less-curved surface.
Figure 2 shows the increased evolution of the neck volume through the migration of molecules. The neck volume is defined as the space between the original and evolved surfaces. It can be seen that significant sintering occurs with only a small number of migrating molecules. The volume required for  is only ∼2% of the volume of one grain. The main component of interstellar icy grains is H2O, with other minor species such as CO, CO2, NH3, CH4, CH3OH, and C2H2. The concentrations of minor icy species are typically on the order of ∼1%, as shown by infrared observations (Gibb et al. 2004). Thus, sintering is caused not only by H2O but also by the minor species. These species contribute to the formation of "sintering zones" at different heliocentric distances (Sirono 2011; Okuzumi et al. 2016). Physical properties of the minor species, such as surface energy and elasticity, are different from those of H2O ice. In this study, we assume that the composing molecule is only H2O for simplicity.
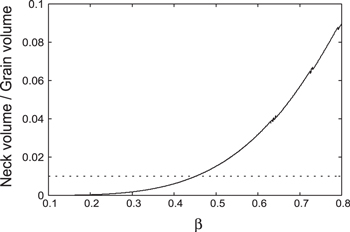
Figure 2. Neck volume normalized by the grain volume as a function of  .
.
Download figure:
Standard image High-resolution image3. Interactions between Grains
3.1. Sintered Necks
The shape of a pair of sintered grains is approximated by a circle of radius x smoothly touching each sphere (Figure 1(b)). The relation between the neck radius a and x is given by
The thickness of the neck, d, is the distance between two contact points on the grain surface (Figure 1(b)), which is given by

Mechanical interactions between the two sintered grains are approximated by those for an elastic disk (Figure 1(c)) with a radius of a. It is assumed that only the disk is deformed elastically and that the other part of the grain is rigid. The mechanical interactions of this model are linear, and plastic deformation is not taken into account.
If the disk is stretched along the direction connecting the two grain centers by the amount of  , the stress σ appearing in the disk is given by
  , where E is the Young's modulus of H2O ice. Then, the total force required for stretching is
  . From this formula, the spring constant
  for stretching motion is given by

If a force is applied parallel to the disk surface and a displacement of  is attained, the shear stress that appeared in the disk is
  , where G is the shear modulus. By the same argument for the stretching case, the spring constant for tangential (sliding) motion,
  , is given by

Suppose the upper surface of the disk is tilted by an amount of θ because of an external moment M with respect to the axis on the center of the disk surface. In this case, the net vertical force is zero. At a distance l from the axis, the vertical strain is given as  (Figure 3). The stress accompanied by this strain is
  . By integrating this stress throughout the surface, the moment M around the axis on the surface is obtained as

The elastic energy stored is written as  .
.

Figure 3. Schematic figure of a rolling grain with a sintered contact. The upper grain tilts left with an angle of θ. The radius and thickness of the neck is a and d, respectively. Strain from the center with a distance of l is given as  .
.
Download figure:
Standard image High-resolution imageThe neck is broken when a large force is applied. Fracturing takes place when the stress inside a solid material exceeds its tensile strength, which strongly depends on the number and size of internal cracks. A crack grows by breaking interatomic or intermolecular bonds at the crack edge. The elastic energy stored around a crack edge is consumed to break the bonds. When torque is applied to rotate a grain relative to an adjacent grain, the stress reaches tensile strength T at the edge of a neck when  . To complete fracturing, the elastic energy stored should be larger than the surface energy,
  . If the elastic energy is much larger than the surface energy, cracks propagate quickly and the material breaks at once. If the elastic energy is small, fragmentation stops after breaking some bonds. In this case, the elastic energy is insufficient to break the neck completely at the beginning of fracture. For simplicity, instantaneous breaking of the neck is assumed in this study. This point should be addressed by laboratory experiments.
Under the assumption that the neck fully breaks at once, the neck is broken when the displacement u (θ for rolling) reaches  (i is rolling, stretching, or sliding). From this condition, critical displacements for stretching
  , for sliding
  , and for rolling
  , are, respectively, given by
3.2. Non-sintered Necks
When two sintered aggregates collide, some of the necks might break and new contacts between grains might form. Because the temperature increase associated with a collision is very low, a newly formed contact is a non-sintered one. The mechanical responses of non-sintered necks were described by Johnson (1987) and Dominik & Tielens (1997). We adopted the same equations used in those studies. Recently, a model taking account of adhesion hysteresis (Krijt et al. 2013a, 2013b) has been developed. A simulation using the model is desirable to determine the effect of adhesion hysteresis for non-sintered aggregates.
The radius of a non-sintered neck at the equilibrium is

where  (ν is Poisson's ratio). It should be noted that
  is the reduced radius of two contact grains, given by
  , with radii of R1 and R2. In this study, we focus on a monodispersed system and
  .
.
When a force F is applied along the stretching direction, the neck radius changes. The relation between F and a can be written by

where  is the critical force required to break a non-sintered contact. On the other hand, the compression length (the shift of the distance between two centers of spheres) δ can be written as a function of a as

Combining Equations (8) and (9), we can obtain the relation between F and δ implicitly.
For rolling and sliding motions, simple elastic responses are assumed until the forces reach the critical values. The elastic energy stored as rolling deformation,  , is written using the spring constant,
  , for rolling motion as

where the rolling displacement is  (see Figure 2(c) of Wada et al. 2007). When ξ reaches
  , the spring is cut and the stored elastic energy dissipates. This corresponds to the rolling friction due to the breaking of intermolecular bonds. In the simulation, the spring was newly formed immediately after the breaking. The estimated values of
  varied from 2 Å (Dominik & Tielens 1995) to 32 Å (Heim et al. 1999). We adopted
  Å and 30 Å in the simulation.
The critical force for tangential motion,  , is given by

and this spring is broken when the displacement reaches

As with the rolling motion, the spring immediately reformed after breaking.
3.3. Shrinkage of a Grain
As shown in Figure 1(a), the main part of a spherical grain shrinks during sintering. A sintered contact is broken mainly through rolling motion, as shown later. If the degree of sintering is low, the main part of the grain retains the original shape. In this case, a non-sintered contact is likely to form because the distance between the centers of two grains is slightly shorter than the sum of the two radii ( for two 0.1 μm radius spherical grains). On the other hand, if the degree of sintering is high, the radius decreases substantially (
 for a 0.1 μm radius spherical grain when β increases to 0.7 provided that the radius of grains is uniform). The shrinkage depends on the size distribution of grains, which is determined by the thermal history of the grains (Kuroiwa & Sirono 2011). This point should be addressed separately from this study.
This shrinkage should affect the formation of a new contact immediately after the breaking of a sintered neck. In this study, the grain radius R decreased to  , as shown in Figure 4 during sintering. A new contact between sintered grains forms when the distance between the two grains is less than
  . The radius of the contact area, a0, and other quantities in Section 2.2 were calculated using the decreased
  . It should be noted that Figure 4 is the result for a straight chain of spherical grains. If the number of contacts per grain is more than two, the decrease in R should be larger than that shown in Figure 4. When taking shrinkage into account, a new contact formation is less probable than in the case without shrinkage.

Figure 4. Shrinkage of grain radius. The amount of shrinkage normalized by the initial grain radius as a function of β. When  , the decrease in radius is 0.09.
Download figure:
Standard image High-resolution image4. Numerical Simulation Settings
We simulated aggregates composed of H2O ice. The material parameters were adopted from Dominik & Tielens (1997): Young's modulus  , shear modulus
  , Poisson's ratio
  , surface energy
  , and a critical distance for rolling motion
  Å as a standard value. For comparison,
  Å cases were also simulated. The initial grain radius R was 0.1 μm. We simulated head-on collisions of two equal-mass aggregates. The number of grains in each aggregate was 1024, which is quite small. A large-scale simulation with 3D aggregates will be presented in a separate paper.
The arrangements of grains in an aggregate is determined using one of two methods. One is the so-called ballistic–cluster–cluster–aggregation method (BCCA, Meakin 1991). Initially, two grains collide to form an aggregate. The motion of each grain stops immediately after making a new contact. In the next step, two aggregates of two grains collide to form an aggregate of four grains. Before collision, the orientation of aggregates is given randomly, and only linear motion is given without rotation. The motion of the new aggregate again stops when a new contact is formed. An aggregate of 1024 grains is eventually formed by continuing this sequence. We produced five BCCA aggregates by changing random numbers that determine the rotation. An example of a BCCA aggregate is shown in Figure 5(a). It has an extremely porous structure. The basic unit of the aggregate is a one-dimensional chain of grains.

Figure 5. Initial arrangement of grains: (a) BCCA aggregate, compacted aggregates with growth velocities of (b) 1, (c) 3, and (d)  , respectively.
Download figure:
Standard image High-resolution imageIn the BCCA procedure, the motion of aggregates stops when a new contact is formed. Actually, the motions of the grains remain after a new contact is formed. In this case, the arrangement of grains depends not only on the initial orientations of the aggregates but also on the collision velocity. We performed collision simulations to prepare aggregates consisting of 1024 grains. The collision velocity used in this simulation was defined as the growth velocity  . We produced one aggregate for each growth velocity. The relative motions of the grains were computed based on the interactions without sintering. Examples of aggregates produced by this procedure are shown in Figure 5(b) (
 ), (c) (
 ), and (d) (
 ).
).
We conducted simulations using aggregates produced with growth velocities of  , 2, 3, 4, 5, 7.5, 10, 15, and
  for
for  . For comparison,
  , 3, 5, 10, 15, and
  cases were simulated for
  . The structure of an aggregate changed as
  increased. When
  was large, an aggregate became compact. Figure 6 shows the average number of contacts per grain as a function of
  . Zero collision velocity corresponds to a BCCA aggregate. The number of contacts is approximately two at low
  and three at high
  . At low
  , the number is two because the basic structure is a chain of grains. At high
  , the number is three because that is the maximum number of contact points if only rolling motion is possible (Sirono & Greenberg 2000). This is a good approximation for non-sintered contacts because sliding and stretching motion require larger forces than rolling motion. For high-velocity collisions such that
  , the induced stresses during a collision are high enough for stretching and sliding to exceed the contact number of three.

Figure 6. Average number of contacts on a grain as a function of growth velocity. Squares and circles are the data for the critical displacement of rolling motion  Å and 30 Å, respectively. Inset: same as the main panel, but the horizontal axis is the ratio between the initial kinetic energy
  to the energy
  required to roll a grain by 90° around the adjacent grain.
Download figure:
Standard image High-resolution imageIn the inset of Figure 6, the horizontal axis shows the kinetic energy per grain,  (m: mass of a grain), normalized by the energy required to roll a grain by 90° around an adjacent grain,
  . It can be seen that both data sets fall on the same curve. This figure shows that the ratio
  determines the number of contacts.
We conducted collision simulations using the BCCA aggregates and compacted aggregates described above. The degree of sintering represented by β was varied as  (without sintering for comparison), 0.2, 0.3, 0.4, 0.5, 0.6, and 0.7. The collision velocity
  was varied between 1 and
  . We performed five runs for each collision velocity. For the BCCA aggregates, we used five different aggregates. For the compacted aggregates, we varied orientations when the aggregates collide.
5. Numerical Results
5.1. BCCA Aggregates
Typical examples of collisional outcomes of BCCA aggregates are shown in Figure 7. Non-sintered BCCA aggregates stick perfectly at a collision velocity of  . Even at a higher velocity of
  , the sticking efficiency (defined as the ratio of maximum aggregate mass after collision to the total mass) is close to unity.
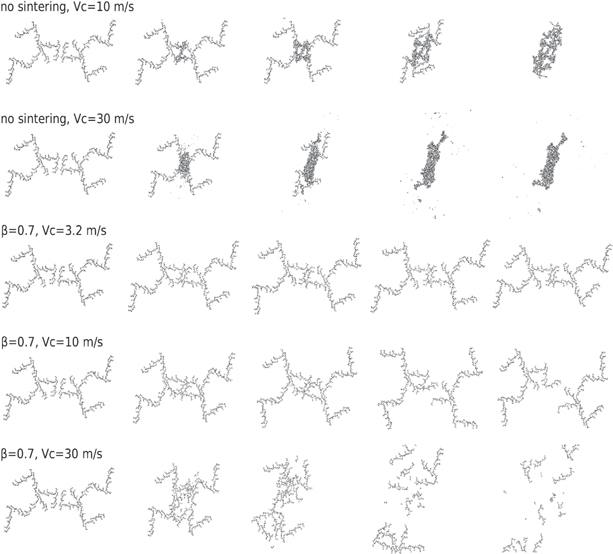
Figure 7. Snapshots of collisions of two BCCA aggregates. From top to bottom,  without sintering,
  without sintering,
  with sintering (
 ),
),  with sintering (
 ), and
  with sintering (
 ). From left to right, snapshots at times of 0, 2500, 5000, 10,000, and 20,000 in the normalized time units. The time is normalized with the vibration period of stretching motion for a non-sintered contact.
Download figure:
Standard image High-resolution imageOn the other hand, three panels from the bottom in Figure 7 show the typical examples of the collisional outcomes of sintered aggregates. Two sintered aggregates stick at  , bounce at
  , and totally rupture at
  . Except at low velocities, these collisional outcomes differ substantially from those without sintering. Because sintering increases the elasticity and the strength of the neck between grains, energy dissipation through rolling motion cannot proceed. This is in contrast to the non-sintered cases, where rolling friction dissipates kinetic energy. As a result, bouncing is observed at
  . For low collisional velocities, two sintered aggregates stick together without any notable deformation. At high collision velocities, the aggregates extensively disrupt to small fragments.
It might be considered that the high energy required to break a sintered contact leads to more efficient sticking as compared to non-sintered aggregates because of higher energy dissipation. This is not the case because only a limited number of contacts where stress is concentrated can break. Most of the contacts remain intact and do not contribute to energy dissipation. These are common phenomena observed in the breaking of solid material. Brittle disruption occurs through the propagation of cracks, and the breaking of intermolecular bonds occurs only at the edges of cracks where stress is concentrated. Thus, a substantial fraction of the initial kinetic energy remains even after the collision.
This is a totally different deformation mode from that in non-sintered aggregates. In a collision of non-sintered aggregates, the aggregate deforms through rolling of the grains. Because the critical force to roll is quite small, rolling deformation occurs throughout an aggregate. This deformation mode is similar to that of liquid, where molecules smoothly rotate around adjacent ones.
Figure 8 (left) shows the sticking efficiency, defined as the ratio of the maximum mass after collision to the total mass, as a function of collision velocity. It can be seen that non-sintered aggregates can grow (sticking efficiency more than 0.5) at  . This is consistent with previous studies (Wada et al. 2007, 2009). On the other hand, substantial disruption is observed even at
  for the
  sintered aggregates. A
  aggregate bounces at
  . For velocities lower than
  , the
, the  aggregate sticks.

Figure 8. Left: sticking efficiency of BCCA aggregate. Right: gyration radius normalized by grain radius as a function of collision velocity. In both panels, squares, circles, and triangles represent non-sintered, and sintered with  and 0.7, respectively. Error bars are the standard deviation of five runs using different arrangements of grains.
Download figure:
Standard image High-resolution imageThe collisional outcomes of  aggregates are almost the same as those of non-sintered aggregates. This is because the neck is not strong enough to sustain the stress induced during a collision. Moreover, if a sintered neck is broken, a new neck without sintering is formed because the shrinkage of a grain does not proceed at low β (see Figure 4).
Figure 8 (right) shows the gyration radius of the largest aggregate after collision. The gyration radius is a measure of the aggregate size defined by
where  is the positional vector measured from the center of mass
  . The gyration radius decreases monotonically as the collision velocity increases because of compaction and fragmentation. Below
  , the gyration radius of the non-sintered aggregate is the smallest among the three types of aggregates. This shows that compaction through the rolling motion of the grains proceeds efficiently in non-sintered aggregates. Compaction does not proceed in the
  aggregate below
  . The evolution of porosity (Kataoka et al. 2013) would thus be affected by sintering. The sintered aggregate has much less density than the non-sintered aggregate. Above
  , the gyration radius of the
  aggregate is the smallest compared to the other types of aggregates because of fragmentation.
5.2. Compacted Aggregates
Next, we conducted the collision simulations using compacted aggregates with  . Snapshots during collisions are shown in Figure 9. The aggregate grown with
  has a compacted structure compared to the BCCA aggregate. Then the compacted aggregates collided with a collision velocity of
  . The collisional outcome for the non-sintered case is shown in Figure 9 (top). Even when an aggregate is compacted, the non-sintered aggregates stick perfectly. On the other hand, the sintered aggregates cannot stick; instead, they bounce. This is simply because a compacted aggregate is stiffer than a BCCA aggregate. For BCCA aggregates, perfect sticking occurs when
  irrespective of the sintering degree (see Figure 8, left).

Figure 9. Snapshots of collisions between two compacted aggregates with a growth velocity of  . Collision velocity is
  . Top: non-sintered aggregate. Bottom: sintered aggregate with
  . From left to right: snapshots taken at times of 0, 625, 1250, 2500, and 5000 in the normalized time units. The time is normalized with the vibration period of stretching motion for a non-sintered contact.
Download figure:
Standard image High-resolution imageFigure 10 compares the sticking efficiencies for compacted aggregates as a function of collision velocity. Data for  correspond to BCCA aggregates with
  the results for
  are identical to (triangles) those shown in Figure 8 (left). When the growth velocity is low (0 and
  ), perfect sticking is realized at collision velocities less than
  . Above
  , substantial fragmentation takes place and sticking efficiency is approximately 0.2.
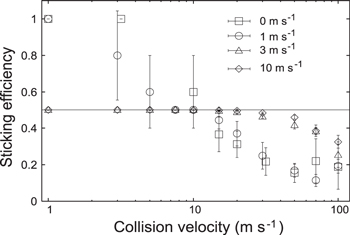
Figure 10. Sticking efficiencies for sintered aggregates with various compaction degrees varied by growth velocity  . Squares:
  (BCCA aggregate); circles:
  ; triangles:
  ; diamonds:
  . Error bars are the standard deviation of five runs with five different arrangement of grains (squares) and five different orientations of aggregates (circles, triangles, and diamonds).
Download figure:
Standard image High-resolution imageFor aggregates with growth velocities of  and
and  , the collisional outcome is bouncing. Above
  , fragmentation occurs.
5.3. Sintering Degree Dependence
We have shown the results of sintered BCCA aggregate collisions with  and 0.7. We also investigated the β dependence of collisional outcomes. Figure 11 shows the sticking efficiency of collisions with BCCA aggregates of various sintering degrees as a function of β with
  (left) and 30 Å (right). The collisional velocities were 10 and
  . It can be seen that the sticking efficiency decreases as β increases in both cases. If the collisional velocity is
  , growth is possible for all values of β. This has already been suggested in Figure 8 (left), where the sticking efficiency of the
  aggregate with a collision velocity of
  is larger than unity.
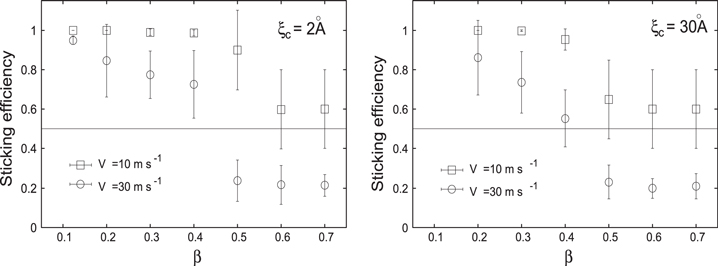
Figure 11. Sticking efficiencies as a function of β for BCCA aggregates with  Å (left) and
  Å (right), with collision velocities of
  (squares) and
  (circles). Error bars are the standard deviations for five runs using five different aggregates.
Download figure:
Standard image High-resolution imageOn the other hand, qualitative changes were observed for  collisions. Collisional growth took place only for
  aggregates. Above
  , bouncing and fragmentation occurred and collisional growth was impossible. It should be noted that the sticking efficiency decreased between
  and 0.5 for both collision velocities. For the BCCA aggregates, the sintering degree of
  was critical in the sense that the collisional growth was affected above this value. It should be noted that we have shown that the volume required for
  is 2% of the volume of a grain (Figure 2).
The mass of fragments produced during a collision is presented in Figure 12. A fragment is defined as an aggregate whose mass is less than one-fourth of the total mass. The fragment mass of  collisions monotonically increases as β increases. On the other hand, the fragment mass of
  collisions has a peak at
  . Aggregates of
  produced only a small mass of fragments. This is because an aggregate is hard, and thus few necks were broken. On the other hand, if β is low, an aggregate is too weak to sustain the stress, and plastic deformation through rolling occurs as in non-sintered aggregates. In these cases, almost perfect sticking takes place and the amount of fragments is negligible.
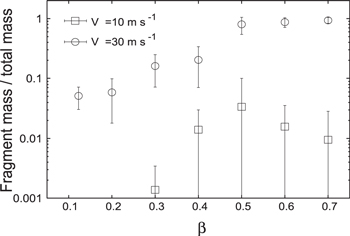
Figure 12. Fraction of mass in fragments compared to the total mass as a function of β produced during collisions of BCCA aggregates with  (squares) and
  (circles). A fragment is defined as an aggregate whose mass is less than one-fourth of the total mass. Error bars are the standard deviations for five runs using five different aggregates.
Download figure:
Standard image High-resolution imageCompacted aggregates are produced through successive collisions with a collision velocity of  using non-sintered aggregates. The compacted aggregates drift to the central star and may enter a sintering zone. It is thus interesting to investigate the case in which
  for sintered aggregates. Figure 13 shows the β dependence of the sticking efficiency for aggregates grown at
  colliding with
  for
for  (left) and 30 Å (right). If
  , the collisional outcome is perfect sticking, irrespective of β in both cases. If
  , the fraction of bouncing increases as β increases when
  . For
. For  , only bouncing is observed except when
  . At
. At  , the fraction of bouncing increases as
  increases. Bouncing at
  occurs when
  . For
. For  , the probability of sticking is slightly higher than
  cases.
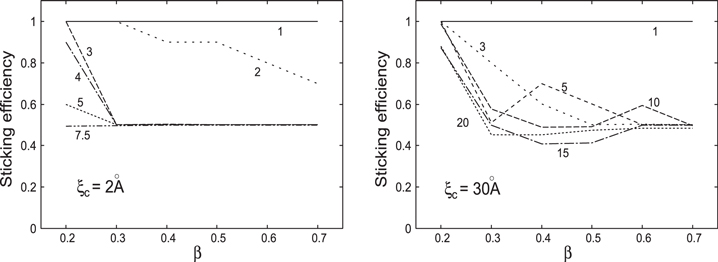
Figure 13. Sticking efficiencies for compacted aggregates with various growth velocities with  Å (left) and
  Å (right). Numbers denoted along each of the lines are
  in
in  units. Data points are taken at an interval of
  and connected for ease of viewing.
Download figure:
Standard image High-resolution imageFrom these results, it is suggested that bouncing is one of the main collisional outcomes of compacted aggregates. It is important to understand the conditions of bouncing in order to clarify the collisional evolution of icy grain aggregates. The conditions will be discussed in Section 5.4.
Figure 14 shows the partition of energy after the collision of BCCA aggregates with  as a function of β. The initial kinetic energy dissipates through breaking of the sintered bonds, sliding and rolling friction at non-sintered contacts, and elastic vibration. Some of the kinetic energy remains after the collision. In Figure 14, the leftmost points are non-sintered aggregates. Approximately 80% of the initial kinetic energy dissipates through rolling friction, which causes the smooth ductile deformation of the aggregates. The other 20% is dissipated by breaking non-sintered necks through stretching. The remaining kinetic energy is small, representing perfect sticking.
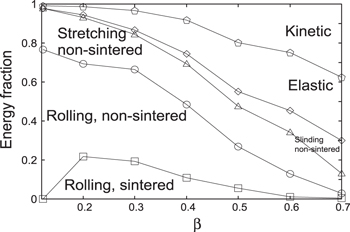
Figure 14. Energy partition after the collision of BCCA aggregates with a collision velocity of  as a function of β. Leftmost points are for non-sintered aggregates.
Download figure:
Standard image High-resolution imageAt  , 20% of the kinetic energy dissipates through breaking sintered necks with rolling deformation. As β increases, the amount of energy dissipation through the breaking by rolling decreases. Energy dissipation through rolling friction decreases accordingly. This is because the number of newly formed non-sintered contacts decreases as the number of broken sintered contacts decreases. In turn, the elastic and remaining kinetic energies increase as β increases. From Figure 11, it can be seen that bouncing starts from
  . At this value, 40% of the initial kinetic energy does not dissipate but remains as kinetic and elastic energies. As a result, the efficiency of energy dissipation decreases and the collisional outcome becomes bouncing.
As shown above, the number of sintered necks broken through rolling motion is an important quantity in collision. Figure 15 (left) shows the number of sintered bonds broken in a collision normalized by the total number of grains,  , as a function of the initial kinetic energy per unit grain,
  , normalized by the breaking energy of a sintered neck,
  . Five types of aggregates are included: BCCA with
  and 0.7, and compacted aggregates with
  , 3, and 10 m s−1. Although all modes of motion are included (rolling, sliding, stretching) as a cause of breaking a sintered neck in Figure 15 (left), more than 90% of the bonds were broken through rolling motion. It should be noted that data for all types of aggregates showed the same dependence except for BCCA with
  . Least-squares fitting except
  gave
gave  , indicating that the number is determined by the ratio
  . The number of broken bonds thus depends only on β, but not on the degree of compaction.
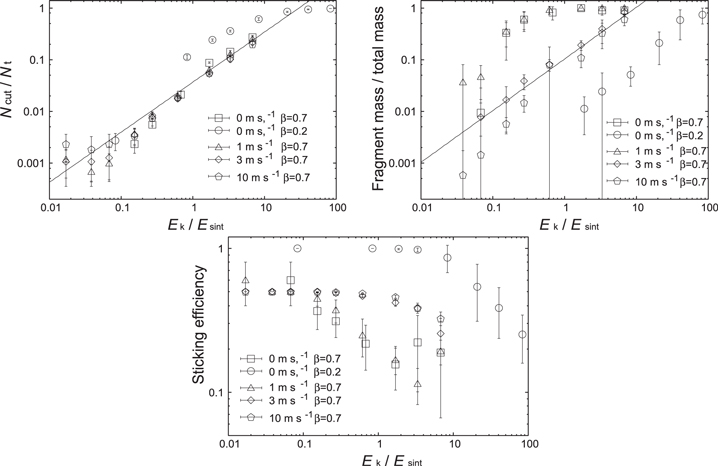
Figure 15. Upper left: the number of broken contacts normalized by the total number of grains  as a function of the initial kinetic energy per grain normalized by the breaking energy for a sintered neck,
  . Upper right: the fraction of mass in fragments compared to the total mass as a function of
  . Bottom center: sticking efficiency as a function of
  . In every panel, two BCCA aggregates having
  (squares) and 0.2 (circles) and compacted aggregates with
  (triangles), 3 (diamonds), and
  (pentagons) are shown. Error bars are the standard deviations for five runs using five different aggregates (squares and circles) and using five different orientations (triangles, diamonds, and pentagons).
Download figure:
Standard image High-resolution imageOn the contrary, the fraction of mass in fragments compared to the total mass depends on the degree of compaction, as seen in Figure 15 (right). The fragment fraction was the largest for BCCA with  and for compacted aggregates with
  . These two types of aggregates show almost the same dependence. For high collision velocities, these aggregates are disrupted totally, as shown in Figure 8 (left). On the other hand, more compacted aggregates and BCCA with
  produced fewer fragments. The collisional outcomes of BCCA aggregates with
  are close to perfect sticking at collision velocities of less than
  , where
  , which is almost identical to the value for non-sintered aggregates, as seen before (Section 5.1). For compacted aggregates of
  and
and  , the collisional outcome is bouncing. The mass of fragments of these aggregates is between those of the other two types of aggregates. It can be seen that the fragment mass is different for aggregates with the same β. Less-compacted aggregates produced more fragments even when the number of broken necks was the same (Figure 15, upper right). Correspondingly, the sticking efficiency (the mass of the largest aggregate) differs between the aggregate types (Figure 15, bottom). This suggests that the fragments stick again to the main part of the aggregate during collision if the aggregate is compacted. Fragments are highly likely to collide with a nearby fragment because the packing fraction is high. In contrast, fragments produced inside a porous aggregate have a chance to escape from the other fragments. Thus, grain arrangement is a critical parameter that determines the final mass of the largest aggregate.
5.4. Conditions for Bouncing
The collisional outcomes can be categorized as sticking, bouncing, and fragmentation. It is helpful to clarify the conditions of collisional outcomes.
In a non-sintered case, the condition given by Dominik & Tielens (1997) describes the collisional outcomes well. For example, maximum compression of an aggregate occurs when  , where
  is the kinetic energy of a grain and
  is the energy required to roll the grain 90° around an adjacent grain. Catastrophic disruption occurs when
  , where
  is the energy required to break a non-sintered contact. These considerations based on energetics were successful because a non-sintered aggregate smoothly deforms like liquid. This behavior comes from the fact that the force required for rolling motion is substantially smaller than those for other motions including sliding and stretching. As a result, smooth ductile deformation of a non-sintered aggregate is possible. Energy thus plays a key role in the non-sintered case.
We showed that the number of broken bonds clearly depends on the ratio between the initial kinetic energy and the breaking energy of a sintered contact in Figure 15. A substantial fraction of sintered contacts are broken when  . Critical energies play a key role in fragmentation accordingly, as in the non-sintered case. However, the final mass of the largest aggregate depends on the packing fraction of an aggregate (Figure 15 bottom). The arrangement of grains determines the mass of the maximum aggregate.
The situation is different for bouncing, because bouncing occurs if the force at a newly formed non-sintered contact is higher then the critical force for breaking a non-sintered contact. We investigated how forces are induced in an aggregate in order to clarify bouncing, adopting a model given by Sirono & Greenberg (2000), where an aggregate is represented by chains connected periodically. If we assume the shape of a chain is triangular with a base length of L and a height  (see Figure 16(a)), the number of grains in one chain, N, is given by

Suppose the chains are connected to form a regular triangular lattice (Figure 16(b)). It should be noted that the two end grains in one chain are shared with six triangular cells.  in-between grains are sheared with the two neighboring cells. In one cell, there are three end grains and
  in-between grains. Thus, the number of grains contained in a unit cell is


Figure 16. (a) Basic structure of a grain aggregate. (b) Triangular chains of grains periodically connected to form triangle lattices.
Download figure:
Standard image High-resolution imageAn end grain of a chain is shared with six chains. There are thus six contact points on an end grain. In one cell, there are three end grains with six contact points shared by six cells. There are three contact points contributed by end grains effectively in one cell. An in-between grain has two contact points. In one triangular cell, in-between grains contribute  contact points. In total, there are
  contact points for each cell. Thus, the average number of contact points on a grain is given by

The average number approaches 2 as N increases.
When aggregates collide, forces are induced at the contacts. The maximum force induced in an aggregate is determined by the balance of kinetic energy and elastic energy stored in the chains. If the total number of chains in an aggregate is  , the balance can be written by
  , where
  is the number of grains in the aggregate, and
  is the maximum shrinkage of the chain. The effective spring constant of the triangular chain
  is given by Sirono & Greenberg (2000) as

where the term  appeared in Equation (5). Because
  , the balance gives a maximum force
  as
as

When two aggregates collide, the maximum compressive force given by Equation (18) is induced inside an aggregate. At the same time, non-sintered new contacts are formed during the collision. An aggregate bounces if the tensile force at the new contact is larger than the critical force for breaking a non-sintered contact. Because the maximum compressive and tensile forces are comparable, if  is larger than the critical force for breaking,
  , bouncing occurs. This condition can be written as

Figure 17 shows the ratio given by Equation (19) corresponding to compact aggregates produced with  (left) and BCCA aggregates (right). To calculate
  , we have to adopt N into Equation (18). For BCCA aggregates, we determined N from
  from the gyration radius shown in Figure 8 (right). For compacted aggregates, N was determined from Equation (16) and the average number of contacts shown in Figure 6 (
 Å). In Figure 17 (left), the ratio was calculated for collisions of compacted aggregates with
  .
.
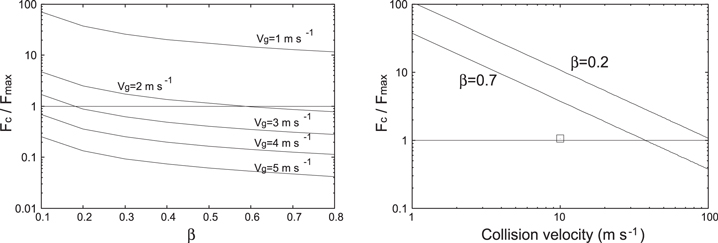
Figure 17. Left: the ratio  as a function of β for different degrees of compaction produced with
  . From top to bottom: the growth velocity (= collision velocity) increases from 1 m s−1 to 5 m s−1. The horizontal line is
  , below which bouncing is expected. Right: the ratio
  as a function of collision velocity for BCCA aggregates with
  and 0.7. The square is the ratio estimated taking new contact formation into account.
Download figure:
Standard image High-resolution imageFrom Figure 17 (left), the model predicts that aggregates compacted with  colliding at the same velocity bounce if β is larger than 0.4. Aggregates of
  stick, irrespective of β, and aggregates of
  bounce if
  . These results explain the collisional outcomes shown in Figure 13 (left) well (
 Å).
Å).
For BCCA aggregates (Figure 17, right), the model predicts sticking for a wide range of collision velocities in contrast to the results shown in Figure 8 (left), where  aggregates bounce at
  . It should be noted that there are no chain loops inside a BCCA aggregate because of its formation mechanism i.e., the motion of the colliding aggregate stops when a new contact is formed.
When sintered BCCA aggregates collide, they elastically deform substantially (Figure 7). A chain of grains bends and new contacts are formed around the impact point. The length of the chains decreases and larger forces can appear as the elasticity of the aggregate increases. We identified loops consisting of grain chains and checked the the number of grains belonging to the loops. The average number of the grains was 44. We therefore adopted  in Equation (18). The square in Figure 17 (right) is the ratio based on the calculated number of grains belonging to the loops. The ratio is almost unity in this case, well explaining the results obtained by numerical simulation (sticking efficiency of 0.6, corresponding to two bounces and three stickings in Figure 8, left).
As seen above, the threshold between bouncing and sticking is determined by forces induced in an aggregate and the sticking force needed to separate grains. This is in contrast to the collisions between non-sintered aggregates, in which the collisional outcomes are well classified based on energies associated with the motions of the grains.
5.5. Uncertainty in 

A critical displacement for the irreversible rolling motion of  Å was estimated by Dominik & Tielens (1997). On the other hand, Heim et al. (1999) obtained
  Å experimentally. Figure 13 displays the effect of
  on the collisional outcomes of compacted aggregates. As seen in Figure 6, the number of contact points decreases as
  increases. The number of contacts at
  with
with  Å is almost the same as that at
  with
with  Å. The results of
  with
with  Å in Figure 13 (left) and
  with
with  Å in Figure 13 (right), coincides well. This comparison shows that the number of contacts is a critical parameter, which in turn depends on
  .
.
On the other hand, Figure 11 (right) shows the sticking efficiencies of BCCA aggregates with  Å. Comparing Figure 11's left and right panels, no significant change is observed. This is because the number of contacts in both aggregates is the same. Although new contacts that form during a collision are non-sintered ones and their rolling motion depends on
  , BCCA aggregates at high collisional velocities break up totally and the dependence on
  is not observed.
6. Discussion
6.1. Evolution of Icy Dust Aggregates
In the non-sintering zone of a protoplanetary nebula, an aggregate efficiently grows through collisional sticking, and the collision velocity increases as the aggregate size increases. At the same time, the aggregates are compacted. The compacted aggregates drift to the central star owing to gas drag. If an aggregate that has grown in a non-sintered zone drifts into a sintering zone, sintering occurs inside the aggregate and its mechanical properties change. Figure 13 suggests that compacted aggregates that grow with a velocity of  cannot grow further because of bouncing if β is high enough.
On the other hand, aggregates that form inside a sintering zone are less compacted than those in a non-sintered zone (Figure 8 (right)). Figure 8 (left) shows that porous sintered aggregates break at a collision velocity of  . In this case, the size of the aggregate is limited by fragmentation, not by bouncing, as discussed for compacted aggregates.
These two effects induce heterogeneity in the growth of icy dust aggregates in a protoplanetary nebula. In a non-sintered zone, perfect sticking of aggregates does not produce fragments in contrast to the sintered zone. This contrast can explain the symmetric pattern observed at HL Tau (ALMA Partnership et al. 2015). Okuzumi et al. (2016) reproduced the observational pattern assuming substantial fragment production at collisional velocities higher than 20 m s−1. This velocity corresponds to the critical velocity for the growth of sintered BCCA aggregates. The effect of bouncing collisions and associated fragment production (Figure 12) should be included in future studies.
6.2. Limitations of the Simulations
The simulations conducted in this study were 2D as a first step. Of course, 3D simulations are also required. However, important aspects of sintered aggregate collisions are common in 2D and 3D.
Figure 17 nicely explains the threshold between sticking and bouncing after a collision. This figure is based on a comparison between the critical pull-off force,  , and the maximum force
  (Equation (18)) attained in a collision. The pull-off force is common in 2D and 3D. How about the maximum force? The discussion in Section 5.4 is based on a comparison between the initial kinetic energy and the total elastic energy stored in an aggregate, which is independent of dimensionality. Thus, the conditions obtained in this study would be applicable also to 3D cases.
Moreover, we found that the number of broken sintered necks only depended on the initial kinetic energy (Figure 15, left). This point is also independent of dimensionality. Thus, the critical velocity at which fragmentation starts should be the same in both 2D and 3D cases. However, the mass of fragments might depend on the dimension because the mass depends on the arrangement of grains in the aggregate (Figure 15, right).
Another important point is the number of grains in an aggregate. In this study, aggregates composed of 1024 grains were used. This number is quite small for simulating actual aggregates. However, the discussion in Section 5.4 suggests that the collisional outcome, especially sticking or bouncing, is determined by the length of the chains composing the aggregates. In other words, a critical parameter is the packing fraction of an aggregate. The geometrical meaning of the packing fraction is quite different between 2D and 3D. The probability of a fragment escaping would be higher in 3D than in 2D. Thus, it is possible that the mass of fragments shown in Figure 15 (upper right) would be higher in 3D. This point should be addressed by 3D simulations.
6.3. Roughness of a Broken Neck
As shown in Figure 15, sintered necks are broken during collisions. The shape of a broken neck is not smooth; instead, it has edges. The collisional outcomes of sintered aggregates highly depend on the stickiness of fragments. A fragment is produced through breaking necks by rolling motion and the fragment collides with other fragments. If the fragment sticks, mass loss due to fragmentation is small. If the fragment bounces, the mass loss is large.
One criterion of bouncing is  , where
  is the pull-off force, given by
  . If an aggregate is highly porous, the shape of a fragment is a chain. When a fragment chain collides, it is highly probable that the end of the chain is the first to come into contact with the other chain. Because the end of a chain is produced by breaking a neck, the contacting surface is likely rough.
Although this effect is not included in this study, we can discuss a consequence of this effect. Suppose the rough surface has a surface curvature of  . The lines shown in Figure 17 (right) would shift downward by a factor of 10. The region of bouncing is significantly reduced, and the collisional outcome tends to bouncing (or fragmentation).
Another important effect not included in this study is the motion of the grain during rolling. After a neck is broken through rolling, a grain rolls around the axis at the edge of the neck (see Figure 3). During rolling, the center of the rolling grain shifts upward because the distance between the axis and the center is larger than that between the contact surface and the center. As a result, the distance between two grain centers increases. Clearly this effect inhibits reconnection of the grains. This effect should be included in a future simulation.
7. Conclusion
We conducted numerical simulations of icy dust aggregate collisions, including the effects of sintering. Sintering increases the mechanical strength of the neck connecting adjacent grains and decreases the volume of a grain. We modeled the mechanical responses of the neck and included them in the simulation code. For very porous dust aggregates, sintering reduces the critical velocity for growth from 50 m s−1 in the non-sintered case to 20 m s−1 in the sintered case. This is because a limited fraction of necks is broken during the rolling of grains in a sintered aggregate. This is not the case for non-sintered aggregates, where a substantial fraction of grains smoothly rolls around adjacent grains without breaking. For compacted aggregates, the collisional outcome is bouncing. The amount of fragments increases as the initial kinetic energy increases. The number of necks broken during a collision does not depend on the porosity of an aggregate. From the simulation results obtained in this study, it is suggested that sintering inhibits the growth of icy aggregates in their collisional evolution.
The authors are thankful for critical and constructive comments provided by an anonymous reviewer. This work was supported by JSPS KAKENHI Grant Number 17K05631.