


Abstract
A blue source in pre-explosion Hubble Space Telescope (HST)/Wide-Field Planetary Camera 2 (WFPC2) images falls within the 5σ astrometric error circle (∼0 24) derived from post-explosion ground-based imaging of SN 2010jl. At the time the ground-based astrometry was published, however, the SN had not faded sufficiently for post-explosion HST follow-up observations to determine a more precise astrometric solution and/or confirm if the pre-explosion source had disappeared, both of which are necessary to ultimately disentangle the possible progenitor scenarios. Here we present HST/WFC3 imaging of the SN 2010jl field obtained in 2014, 2015, and 2016 when the SN had faded sufficiently to allow for new constraints on the progenitor. The SN, which is still detected in the new images, is offset by 0061 ± 0008 (15 ± 2 pc) from the underlying and extended source of emission that contributes at least partially, if not entirely, to the blue source previously suggested as the candidate progenitor in the WFPC2 data. This point alone rules out the possibility that the blue source in the pre-explosion images is the exploding star, but may instead suggest an association with a young (<5–6 Myr) cluster and still argues for a massive (>30 M⊙) progenitor. We obtain new upper limits on the flux from a single star at the SN position in the pre-explosion WFPC2 and Spitzer/IRAC images that may ultimately be used to constrain the progenitor properties.
Export citation and abstract BibTeX RIS
1. Introduction
Type IIn supernovae (SNe IIn; see Filippenko 1997 for a review) are core-collapse explosions whose spectra are characterized by relatively narrow lines (Schlegel 1990) that are not associated with the supernova (SN) explosion itself, but rather with a dense circumstellar shell (CS) produced by pre-SN mass loss. The nature of the progenitor star (or system) remains uncertain and need not be limited to a single solution. SNe IIn exhibit a range of light-curve characteristics (e.g., Taddia et al. 2013, and references within) and derived pre-SN mass-loss rates (10−4–10−1 M⊙ yr−1; e.g., Fox et al. 2009; 2011; Smith et al. 2009; Moriya et al. 2013). Galactic analogs with such mass-loss rates include anything from extreme self-obscured red supergiants to luminous blue variables (LBVs), each of which present further questions of their own (see Smith 2014 for a review).
Direct imaging constraints on SN IIn progenitors are limited to only a handful of cases: SNe 1961V, 2005gl, 2009ip, 2010jl, and 2015bh (Goodrich et al. 1989; Filippenko et al. 1995; Van Dyk et al. 2002; Gal-Yam et al. 2007; Gal-Yam & Leonard 2009; Foley et al. 2011; Kochanek et al. 2011; Smith et al. 2011a, 2016; Smith 2011; Van Dyk & Matheson 2012; Elias-Rosa et al. 2016; Thöne et al. 2016). While each case has a unique set of caveats that should be carefully considered, a blue and/or overly luminous source at the position of each of these SNe was discovered in the pre-explosion images that can be considered consistent with a luminous, high-mass star, which is most typically labeled a LBV (also see the case of the pre-explosion outbursts in the Type Ibn SN 2006jc (Foley et al. 2007; Pastorello et al. 2007) and Type IIn-P 2011ht (Fraser et al. 2013)).
At the time of writing this article, however, sufficient ambiguities exist around each scenario to suggest it is still premature to claim a quiescent SN IIn progenitor has been definitively discovered. For example, SN 2009ip has indeed faded below the brightness of the detected progenitor, but it is uncertain if that progenitor was in its quiescent state (Thöne et al. 2015; Smith et al. 2016). SN 2005gl also faded below pre-explosion luminosities, but the limits constrain this dimming to only ≳1.5 mag. The deep limits for SN 1961V show that it dimmed by ≳5.5 mag, but a debate still exists concerning whether SN 1961V was a true SN or a nonterminal eruption with a fainter, surviving source (see Kochanek et al. 2011; Smith et al. 2011b; Van Dyk & Matheson 2012, and references therein). The uncertainty in all of these cases can be summarized by the fact that LBVs are known to undergo quiescent and eruptive stages that can differ by >3 mag (Wolf 1992).
These ambiguities aside, the lack of massive-star progenitor detections is puzzling. To complicate the interpretation even more, Habergham et al. (2014) find that SNe IIn do not trace star formation in galaxies, suggesting they are not likely associated with the most massive stars (e.g., LBVs). Smith & Tombleson (2015) and Smith et al. (2016) go on to show that LBVs are more isolated from O stars than predicted by single-star evolution models. Instead, these authors propose an alternative progenitor scenario that uses mass gainers in Roche-lobe overflow (but see Humphreys et al. 2016 for a contrasting interpretation of how to subdivide the sample of LBVs).
The Type IIn SN 2010jl was discovered in host galaxy UGC 5189A on 2010 November 3.52 by Newton & Puckett (2010). (UT dates are used throughout this paper, and epoch refers to days post-discovery.) We note, however, that Stoll et al. (2011) later report a detection 25 days pre-discovery in archival data, and Fransson et al. (2014) use this date as their reference epoch.
Smith et al. (2011a) identified a blue source in pre-explosion Hubble Space Telescope (HST) Wide-Field Planetary Camera 2 (WFPC2) images that falls within the 5σ astrometric error circle (σ ≈ 005) derived from post-explosion ground-based imaging. The blue color of this pre-explosion source is consistent with either (1) a massive young (<6 Myr) star cluster, (2) a luminous blue star with an apparent temperature around 14,000 K, (3) a star caught during a bright outburst similar to those of LBVs, or (4) a combination of the above. At the time of that publication, no ground-based adaptive optics observations were acquired and the SN had not faded sufficiently for post-explosion HST follow-up images to determine a more precise astrometric solution or confirm if the pre-explosion source had disappeared.
This paper presents observations of SN 2010jl obtained with HST Wide-Field Camera 3 (WFC3) ∼5 year post-explosion, at which time the SN has faded enough to obtain sufficiently accurate astrometry (especially considering that the WFC3 plate scale resolution exceeds that of WFPC2 by a factor of ∼2.5). Here we present these observations to determine whether the blue source identified in pre-explosion images was the progenitor or part of a massive star cluster. Section 2 presents the observations and an analysis of the astrometry. Section 3 summarizes our conclusions.
2. Observations
2.1. HST/Space Telescope Imaging Spectrograph (STIS)
SN 2010jl was observed with the Space Telescope Imaging Spectrograph (STIS) by program GO-12242 (PI R. Kirshner) in the 50CCD aperture with the MIRVIS filter/grating on 2011 January 23 for 120 s, but the image of the SN is saturated. We nonetheless attempted to measure a SN position relative to the archival WFPC2 data, but it was very difficult to establish a positional centroid, and therefore the measurement was deemed not useful. We find, however, that the position we estimated is only 002 from the actual SN position.
2.2. HST/WFC3
SN 2010jl was observed with the HST/WFC3 UVIS channels as part of programs GO-13341 (PI S. Van Dyk), GO-14149 (PI A. Filippenko), and GO-14668 (PI A. Filippenko). Several epochs are shown in Figures 1(a)–(d). These data represent the first unsaturated HST images of SN 2010jl obtained after explosion. The individual WFC3 flc images in all bands were first corrected for charge-transfer efficiency losses using the scripts available online.13 The resulting flc images then had cosmic-ray hits masked by running them through AstroDrizzle in PyRAF. Photometry was extracted from the individual WFC3 flt images in all bands using DOLPHOT v2.0 (Dolphin 2000). We adopted a number of the DOLPHOT input parameters recommended by Dalcanton et al. (2009) and Radburn-Smith et al. (2011), as appropriate to complex backgrounds in nearby galaxies; in particular, we used FitSky = 3, InterpPSFlib = true, and RAper = 10 (although we set SkipSky = 1), as well as the TinyTim point-spread function library. Aperture corrections were applied. The resulting magnitudes in the WFC3 flight system (Vegamag) are listed in Table 1.

Figure 1. HST WFC3 post-explosion images of SN 2010jl (a)–(d) and WFPC2 pre-explosion images (e), (f). The WFC3/F336W image from 2015 (c) shows that SN 2010jl is demonstrably offset from an underlying and extended source of emission that likely contributes at least partially, if not entirely, to the blue source identified as the progenitor in the WFPC2 data. The new SN coordinates are marked in each of the images.
Download figure:
Standard image High-resolution imageTable 1. HST Photometry of SN 2010jl and Its Progenitor
| UT Date | Epoch | Instrument | F275W | F300W/F336W | F814W | |||
|---|---|---|---|---|---|---|---|---|
| (days) | (Mag) | (erg s−1 cm−2 Å−1) | (Mag) | (erg s−1 cm−2 Å−1) | (Mag) | (erg s−1 cm−2 Å−1) | ||
| 20010214 | −3549 | WFPC2 | ⋯ | ⋯ | <25.7 (0.1) | <1.88 (0.08) × 10−19 | <25.6 (0.1) | <6.86 (0.3) × 10−20 |
| 20141110 | 1468 | WFC3 | 19.83 (0.01) | 4.36 (0.02) × 10−17 | 21.12 (0.02) | 1.16 (0.07) × 10−17 | ⋯ | ⋯ |
| 20151010 | 1802 | WFC3 | ⋯ | ⋯ | 21.77 (0.04) | 6.36 (0.19) × 10−18 | 22.23 (0.02) | 1.47 (0.03) × 10−18 |
| 20161027 | 2210 | WFC3 | ⋯ | ⋯ | 22.08 (0.03) | 4.80 (0.13) × 10−18 | 22.67 (0.03) | 9.79 (0.3) × 10−19 |
Download table as: ASCIITypeset image
Figure 2 plots the new photometry along with older data from Fransson et al. (2014), which were obtained at epochs <1100. The photometry indicates a distinct slowing in the decline of the SN light curve compared to the trends before day 1000, and a blue color. These characteristics may suggest a compact echo or continued CSM interaction. We will explore these possibilities in a future paper using multiwavelength analysis.
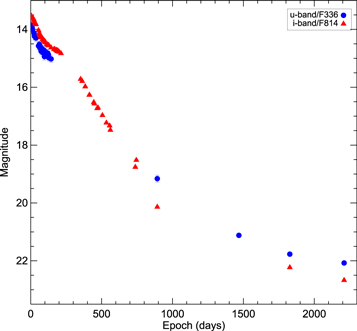
Figure 2. Light curve of SN 2010jl, including HST/WFC3 data from this paper (>1100 days) and data from Fransson et al. (2014) at <1100 days. The comparison assumes Sloan u to be similar to WFC3 F336 and Sloan i to be similar to WFC3 F814W.
Download figure:
Standard image High-resolution image2.3. The SN Position and New Constraints on the Progenitor Flux
The F336W image (Figure 1(c)) shows that SN 2010jl is offset from an extended emission region that likely contributes at least partially, if not entirely, to the blue object that was previously identified as the progenitor in the WFPC2 data (see Figure 1(e); also Smith et al. 2011a). Figure 3 shows a zoomed-in version. We attempted to obtain astrometry positions from DOLPHOT, but the centroid for the extended underlying source (#2) is not consistent with the brightest pixel in that source. We therefore modified the centroid position slightly, which we illustrate in Figure 3. The SN position is offset from the candidate progenitor (Smith et al. 2011a) in pixel space by ∼1.55 ± 0.2 pixels in quadrature. With a WFC3 scale of 00396 pixel−1 (∼9.6 pc pixel−1 at 50 Mpc), this translates into 0061 ± 0008 (15 ± 2 pc).
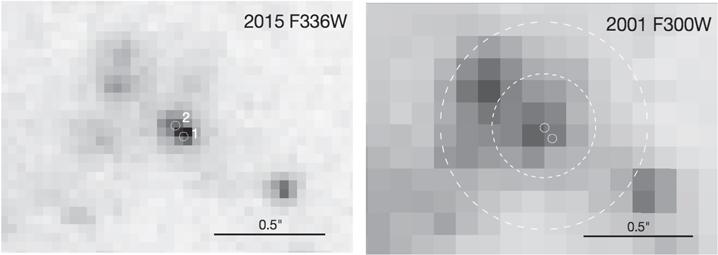
Figure 3. Same as Figures 1(c) and (e), but zoomed in on the new SN position in both the post- and pre-explosion images. (Left) The post-explosion WFC3 F336W drizzled image, showing the location of SN 2010jl (#1) and the underlying blue source that had previously been identified as the progenitor (#2). The size of the circles corresponds to a 5σ positional uncertainty. (Right) The pre-explosion WFPC2 F300W processed image, showing the same two locations. The larger dotted circles correspond to the 5σ and 10σ positional uncertainties (respectively) derived from ground-based images in Smith et al. (2011a).
Download figure:
Standard image High-resolution imageThis offset rules out the possibility that the blue source is the star that exploded (scenarios 2 and 3 in Section 1). A typical OB association is several tens of pc across; for example, the O stars in the Carina nebula are spread across more than 40 pc (Smith et al. 2010). This result suggests that the progenitor of SN 2010jl, even though it is not detected directly, is still most likely associated with the very blue cluster.
Smith et al. (2011a) find that this blue candidate source, if not dominated by the progenitor star itself, is consistent with a young star cluster with an age of 5–6 Myr (or younger if there is host-galaxy extinction). A single-star member of such a young star cluster reaching core collapse would be among the most massive stars in that cluster, corresponding to an initial mass of >30 M⊙.
We determine the detection limit for any potential progenitor at the position of the SN in the pre-explosion WFPC2 images by inserting artificial stars using Dolphot v2.0 at the SN position. To translate the SN position onto a pixel position in the 2001 WFPC2/F300W pre-explosion image, we execute the IRAF GEOMAP and GEOXYTRAN commands using a list of centroids from ∼15 point sources identified in both images. This analysis and alignment is completed entirely in pixel space since only relative astrometry is required. Table 1 and Figure 4 include these limits.
2.4. Spitzer Pre-explosion Progenitor Constraints
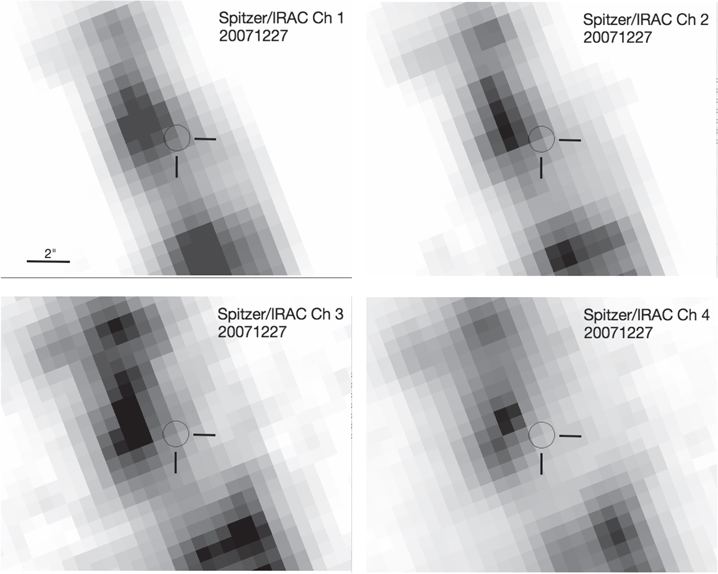
Spitzer obtained a single epoch of observations of the host galaxy, UGC 5189A, in 2007. We obtained fully coadded Post Basic Calibrated Data (pbcd) from the Spitzer Heritage Archive (SHA)14
, shown in Figure 5. These images have 06 pixels, and the absolute astrometry is good to within 01 (Laher et al. 2006). We examine these images for a progenitor bright in the mid-infrared, similar to the dust-enshrouded progenitor of SN 2008S (Prieto et al. 2008), but find no obvious point source at the SN position measured in post-explosion Spitzer data.
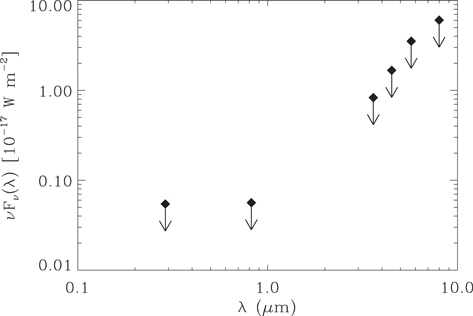
Figure 4. Measured ultraviolet, optical, and infrared limits (black diamonds) on the fluxes from the progenitor star of SN 2010jl. Optical upper limits are derived the pre-explosion HST/WFPC2 images, while the infrared upper limits are derived from pre-explosion Spitzer/IRAC images. These upper limits account for fluxes from both the progenitor star and any hot circumstellar dust.
Download figure:
Standard image High-resolution imageWe also insert artificial stars to calculate the detection limit for any potential progenitor in the pre-explosion Spitzer images. To increase our detection sensitivity for faint sources, we follow the Spitzer Help Desk recommendation to inject artificial sources onto individual Basic Calibrated Data files (BCDs) using the APEX QA Multiframe module and then re-mosaic the data using the Overlap and Mosaic modules within the MOPEX tool.
We use "SExtractor" for our Spitzer source detection. The narrow "mexhat" filter optimizes our detections since it assumes that the sources are very compact and detects them relative to the very local background. We vary the size of the mexhat filter and set the following relevant parameters: DETECT_MINAREA = 5, DETECT_THRESH = 1.5. We define our detection threshold as the flux of the artificial input source that we can no longer recover using the method described above. The resulting detection limits in the four IRAC bands are as follows: 2.3 × 10⁻¹⁹ (Ch1), 3.5 × 10⁻¹⁹ (Ch2), 6.06 × 10⁻¹⁹ (Ch3), and 7.5 × 10⁻¹⁹ (Ch4) erg s−1 cm−2 Å−1. Figure 4 plots these limits.
Figure 5. Spitzer pre-explosion data obtained on 2007 December 27. There is no identifiable point source at the SN position. The lack of a detection provides useful constraints on the amount of dust surrounding the progenitor at the time of the explosion.
Download figure:
Standard image High-resolution image
3. Conclusion
Recent HST/WFC3 imaging of the SN 2010jl field obtained in 2015 shows that the SN has faded sufficiently to allow for new constraints on the progenitor. The SN position is demonstrably offset from an underlying and extended source of emission that contributes at least partially, if not entirely, to the blue object identified as the progenitor in the WFPC2 data. This point alone rules out the possibility that the blue source in the pre-explosion images is a single star that exploded.
We also present previously unpublished pre-explosion Spitzer/IRAC data. No point source is detected at the SN position. The pre-explosion HST upper limits constrain the minimum amount of extinction required to hide a massive progenitor, while the pre-explosion Spitzer upper limits constrain the maximum amount of flux emitted by pre-existing dust and therefore the maximum warm-dust mass. (A larger reservoir of dust may exist at cooler temperatures not probed by Spitzer.)
Together, these constraints present a phase space of viable dust characteristics that could potentially extinguish a given progenitor. The results, however, depend on assumptions of progenitor luminosity, progenitor temperature, dust geometry, dust composition, dust size, etc. Given the complexity of the analysis and implications, we will present a more detailed and model-dependent discussion in an upcoming paper.
This work is based on observations made with the NASA/ESA Hubble Space Telescope, obtained at the Space Telescope Science Institute (STScI), which is operated by the Association of Universities for Research in Astronomy, Inc., under NASA contract NAS 5-26555. It is also based in part on observations made with the Spitzer Space Telescope, which is operated by the Jet Propulsion Laboratory (JPL), California Institute of Technology, under a contract with NASA. Support was provided by NASA through grants GO-13341, GO-14149, and GO-14668 from STScI. A.V.F.'s group is also grateful for generous financial assistance from the Christopher R. Redlich Fund, the TABASGO Foundation, and NSF grant AST-1211916. Part of the research was carried out at JPL. E.D. acknowledges NASA's ADP13-0094 grant for support on this project. R.J.F. gratefully acknowledges support from NSF grant AST-1518052 and the Alfred P. Sloan Foundation. The authors would like to thank Christa Gall, Rubab Khan, Jon Mauerhan, and Arka Sarangi for their helpful discussions. We would especially like to thank the Spitzer Help Desk at IPAC for their useful support with the MOPEX tool.
Footnotes
- 13
- 14
http://sha.ipac.caltech.edu/applications/Spitzer/SHA/ can be used to access SHA.