


Abstract
Single, double, and triple photoionization of Ne+ ions by single photons have been investigated at the synchrotron radiation source PETRA III in Hamburg, Germany. Absolute cross-sections were measured by employing the photon–ion merged-beams technique. Photon energies were between about 840 and 930 eV, covering the range from the lowest-energy resonances associated with the excitation of one single K-shell electron up to double excitations involving one K- and one L-shell electron, well beyond the K-shell ionization threshold. Also, photoionization of neutral Ne was investigated just below the K edge. The chosen photon energy bandwidths were between 32 and 500 meV, facilitating the determination of natural line widths. The uncertainty of the energy scale is estimated to be 0.2 eV. For comparison with existing theoretical calculations, astrophysically relevant photoabsorption cross-sections were inferred by summing the measured partial ionization channels. Discussion of the observed resonances in the different final ionization channels reveals the presence of complex Auger-decay mechanisms. The ejection of three electrons from the lowest K-shell-excited Ne+( ) level, for example, requires cooperative interaction of at least four electrons.
Export citation and abstract BibTeX RIS
1. Introduction
The emission and absorption of electromagnetic radiation by matter show a strong dependence on the photon energy. Their spectral patterns are characteristic of each atom and of each of its different charge states. Therefore, radiation spectra of astrophysical objects or laboratory plasmas can provide information about abundances of elements, their ionization stages, and properties of the environment where the observed elements are present. Examples of such properties are electron densities and temperatures as well as velocities of collective motions. Measured spectra can be exploited with respect to such information if the atomic properties are known. Transition wavelengths, oscillator strengths, natural line widths, and cross-sections for atomic processes populating excited states are among the most important parameters required for the interpretation of spectral observations. Knowledge of the required atomic data can be acquired by theory and experiment. To model plasma environments, the data requirements are immense so that only theory has the potential to satisfy atomic data needs. However, experiments are necessary to benchmark theoretical approaches. The comparison of theory to experiment and the validation of the data entering plasma models are particularly important for those elements that have a high probability of being present in natural or man-made plasmas.
Neon is one of the five elements with the highest cosmic (solar) abundances (Asplund et al. 2009) and as such occurs almost everywhere in the universe. Depending on the temperature and ambient radiation field of their physical environment, neon atoms exist in different charge states q covering the full range from q = 0 to q = 10. Terrestrial observatories can access spectral information from beyond the earth's atmosphere only at wavelengths exceeding about 100 nm. In order to see extraterrestrial radiation arising from the most important transitions in highly charged neon ions and from inner-shell excitation of elements beyond helium in general, telescopes have to be positioned in space, above the Earth's atmosphere. With satellite X-ray observatories, such as Chandra (https://www.nasa.gov/mission_pages/chandra/main/index.html) and XMM-Newton (http://sci.esa.int/xmm-newton), a window has been opened into the far-ultraviolet to X-ray observation range with instruments of unprecedented spectral resolution. In the spectra taken with these instruments, narrow absorption and emission lines, which could not be seen before, are detected. Astronomical environments from which such lines originate comprise stellar coronae, supernova remnants, X-ray binaries, galaxies, active galactic nuclei, as well as interstellar and intergalactic media (Liao et al. 2013 and references therein). Careful analysis of those lines provides information about the chemical composition and the physical state of the optically active matter and is thus an important diagnostic tool for studying topics such as stellar evolution, explosion mechanisms of supernovae, mass transport in accretion systems, galaxy formation, and the evolution of the universe.
In addition to X-ray observations, there is a wide field of applications in astrophysics associated with the  fine-structure transition in singly ionized
  . Protoplanetary disks can be diagnosed by measuring the neon ion fine-structure emission line with suitable space-based instruments (Glassgold et al. 2007). More than 50 observations of
  fine-structure transitions in young stellar objects (YSO) have been made by the Spitzer telescope (Shang et al. 2010 and references therein). More recent high-resolution observations of YSOs in light of the
  fine-structure transition have been reported and reviewed by Sacco et al. (2012).
Transitions in neutral or ionized neon are typically found in every astrophysical X-ray spectrum. By combining theory and astrophysical observation, e.g., by employing the capabilities of Chandra to measure X-ray absorption by the local interstellar medium, it has been possible to infer accurate wavelengths of inner-shell transitions in atoms and ions in general, as well as for neon and its ions in particular (Juett et al. 2006; Yao et al. 2009; Liao et al. 2013; Gatuzz et al. 2015, 2016). The main contribution of theory to such joint investigations is to provide cross-sections for photoabsorption of atoms and their ions. The accuracy of the theoretical calculations is a key ingredient for a correct interpretation of the observed astrophysical spectra. However, at the present stage of theoretical development, it is still difficult to obtain reliable results for multi-electron systems with more than four electrons. The situation for photoabsorption by Ne+ near the K-shell ionization threshold  can be illustrated by comparing two recent theoretical cross-section calculations (Gorczyca 2000; Juett et al. 2006; Gatuzz et al. 2015 versus Witthoeft et al. 2009) in a narrow energy range of approximately
  (see Figure 1). Clearly, experimental data are desirable to decide which theoretical model is more realistic.
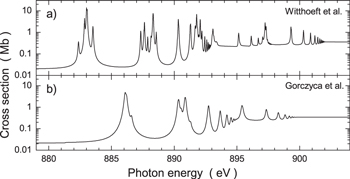
Figure 1. Details of theoretical cross-sections for photoabsorption by Ne+ ions in the vicinity of the K-shell ionization threshold from (a) a calculation by Witthoeft et al. (2009) and (b) a calculation by Gorczyca (2000), Juett et al. (2006), and Gatuzz et al. (2015).
Download figure:
Standard image High-resolution imageExperimental access to K-shell photoionization and photoexcitation of atomic ions has been made possible by employing the dual-plasma method (Kennedy et al. 2004), the photon–ion merged-beams technique (Schippers et al. 2016b), and the exposure of trapped ions to a beam of photons (Crespo López-Urrutia et al. 2012). An overview of deep-inner-shell photoabsorption by atomic cations and anions has been provided recently by Müller (Müller 2015). Experimental data on K-shell photoionization and photoexcitation of positive ions with atomic numbers  have been published for Li+ (Carroll & Kennedy 1977; Kiernan et al. 1994; Mosnier et al. 2000; Scully et al. 2006), Be+ (Mehlmann & Esteva 1974), B+ (Müller et al. 2014), B2+ (Müller et al. 2010a), C+ (Schlachter et al. 2004; Müller et al. 2015), C2+ (Scully et al. 2005), C3+ (Müller et al. 2009), N+ (Gharaibeh et al. 2011), N2+ (Gharaibeh et al. 2014), N3+,
  (Al Shorman et al. 2013), O+ (Kawatsura et al. 2002; Bizau et al. 2015), O2+ (Bizau et al. 2015), O3+ (McLaughlin et al. 2014), O4+,
  (McLaughlin et al. 2016), Ne+ (Yamaoka et al. 2001; Oura 2010), Ne2+ (Yamaoka et al. 2001), Ne3+ (Oura et al. 2000), Fe17+, Fe18+, Fe19+ (Rudolph et al. 2013), Fe20+, Fe21+, Fe22+, Fe23+ (Rudolph et al. 2013; Steinbrügge et al. 2015), Fe24+ (Rudolph et al. 2013), and Kr34+ (Epp et al. 2015).
K-shell photoionization experiments with neutral neon atoms have employed static gas targets, and a large body of papers has addressed specific features in the excitation and decay of K-shell vacancies in neon atoms. Absolute cross-sections for photoabsorption by neon atoms were measured with relatively large step sizes or at low energy resolution by a number of groups (Samson & Stolte 2002; Suzuki & Saito 2003 and references therein). High-resolution fine-structure measurements of photoabsorption and photoionization yields near the neon K edge have been carried out by Coreno et al. (1999), Saitoh et al. (2000), De Fanis et al. (2002), Oura et al. (2004), Kato et al. (2007), and Oura (2010). From such high-resolution spectra of photon-induced signals of photoions, photoelectrons, and fluorescence photons, resonance energies and natural line widths have been obtained for K-vacancy states of the neon atom.
At the Advanced Light Source, absolute cross-sections for valence-shell photoionization of Ne+ ions have been measured at high resolving power up to about  (Covington et al. 2002). Experiments addressing the valence energy region can benefit from very much larger cross-sections compared to the energy range around the K edge, which is the focus of the present investigation. Direct photoionization of Ne+ is approximately a factor of 20 more probable at 50 eV than at 900 eV.
The only previous photoionization experiments on Ne+ ions near the K-shell ionization edge were carried out at the SPring-8 synchrotron radiation facility. First measurements were reported by Yamaoka et al. (2001). Later experiments on Ne+ ions with higher energy resolution (resolving power up to  ) and for an extended energy range were summarized by Oura (2010). All these previous measurements were restricted to single ionization. The data are not absolute and suffer from relatively large statistical uncertainties. Only the energies of the strongest resonances could be inferred.
In the present investigation, measurements on net single, double, and triple ionization of Ne+ ions induced by single photons were conducted in the vicinity of the K edge at energy resolutions  between approximately 32 and 500 meV, corresponding to resolving powers up to about 27,000. Absolute cross-sections have been determined for all three channels (
 ) observed in these experiments. In addition, absolute cross-sections for photoabsorption and photoelectron production in neutral neon at the K edge have been derived from photoionization measurements with Ne gas.
The present paper is organized as follows. After this introduction, the experimental procedures and energy calibration are discussed. In this context, electron production from neutral neon was measured in separate experiments. In the Results section, experimental cross-sections and natural line widths of K-vacancy levels in neutral Ne atoms and Ne+ parent ions are presented. Resonance parameters are extracted and compared with the literature. Excitation and decay paths of intermediate K-shell excited states are discussed, and experimentally derived photoabsorption cross-sections are compared with theoretical results available in the literature. The paper ends with a summary and acknowledgements.
2. Experiment
The experiments on photoionization of Ne+ ions employed the Photon–Ion Spectrometer setup at PETRA III (PIPE). PETRA III is presently the brightest third-generation synchrotron light source worldwide. It is located on the premises of DESY in Hamburg, Germany. PIPE is the endstation of the Variable Polarization XUV Beamline P04 (Viefhaus et al. 2013) of PETRA III. Figure 2 shows a sketch of the layout of PIPE. The floor space occupied by the whole setup is relatively large owing to the size of the bending magnets with bending radii 100 and 60.8 cm and the resulting ion-beam optics scheme. The experimental arrangement and procedures have been described previously by Schippers et al. (2014). Since then, the photon-beam optics and the control of the plane-mirror–plane-grating unit (Viefhaus et al. 2013) have been optimized, which resulted in substantial improvements in beam brightness, and precision of photon-energy setting and photon-energy resolution. The present description is focused on the aspects specific to the Ne+ photoionization experiments described in this paper. A separate subsection is devoted to calibration issues.
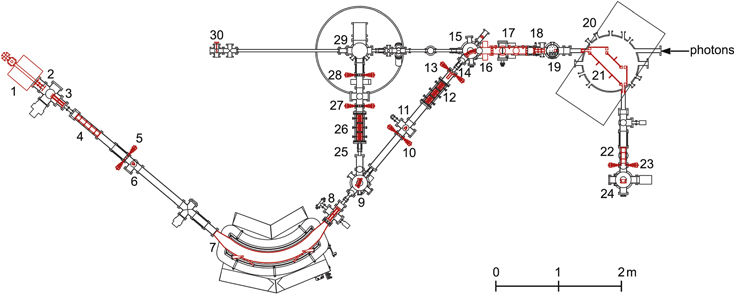
Figure 2. Floor plan of the Photon–Ion Spectrometer setup at PETRA III (PIPE). The numbers indicate the positions of the most important components of the apparatus. Photons from the P04 monochromator enter from the right. Ion beams for the present experiment were produced in an ECR ion source (1) with an extraction system (2) followed by two pairs of electrostatic parallel-plate deflectors (3) for horizontal and vertical beam adjustment; five-element cylindrical lens (4); adjustable four-jaw object slits (5) of the analyzing magnet (7); movable Faraday cup (6); two pairs of parallel-plate electrostatic deflectors for horizontal and vertical ion-beam adjustment (8); movable spherical electrostatic 40° ion-beam deflector (9); adjustable four-jaw image slits (10) of the analyzing magnet (7); movable Faraday cup (11); electrostatic quadrupole triplet (12); adjustable four-jaw beam-collimation slits (13); two pairs of electrostatic parallel-plate deflectors for horizontal and vertical beam adjustment (14); spherical electrostatic 50° ion-beam deflector (15) with openings in straight-through directions for the photon beam and for the ion beam when the deflection voltage is set to zero for monitoring the ion beam with a Faraday cup before it enters the ultra-high-vacuum merged-beams section; beam-profile monitor for ions and photons (16); interaction region with fine-adjustment four-jaw beam-collimation slits in front of the entrance and behind the exit apertures and with six beam profile monitors at three positions for x- and y-profile measurements (17); einzel lens (18); fluorescence-light collection chamber with movable Faraday cup (19); 90° deflecting (demerger) magnet (20) with an inner electrically isolated metal box (21) serving as Faraday cup for collecting the primary ion beam used in the experiment; einzel lens (22); adjustable four-jaw image slits (23) of the demerger magnet; detector chamber with a position-sensitive channel-plate detector in straight-through direction and a vertically movable detector unit consisting of a spherical electrostatic 180° deflector and a single-particle detector based on secondary-electron production by ions hitting an inclined metal plate and detection of these electrons by a fast high-gain channel electron multiplier (24); two pairs of electrostatic parallel-plate deflectors for horizontal and vertical beam adjustment (25); electrostatic quadrupole triplet (26); adjustable four-jaw slits (27) and (28) for ion-beam collimation; fully equipped reaction microscope (29) with gas-jet target and multi-hit electron and ion detection usable with an ion beam in photon–ion crossed-beams geometry; photodiode (30).
Download figure:
Standard image High-resolution image2.1. Experimental Setup
The Ne+ ions for this experiment were produced by a compact 10 GHz permanent-magnet electron-cyclotron-resonance (ECR) ion source (Trassl et al. 1997). Natural neon gas was leaked into the source, which was on a potential of +6 kV with respect to the grounded beam pipe.
Ions produced inside the source drift toward the extraction region and are then accelerated to ground potential. By a suitable combination of extraction electrodes and electrostatic focusing elements, an ion beam is formed. The beam contains ions of different elements and chemical compounds with different charge states. Through einzel lenses and electrostatic steerers, the beam is transported to a double-focusing dipole magnet with a 90° bending angle and 1 m radius of curvature. The magnetic field separates the ions according to their mass-over-charge ratio.
For the present experiments a beam consisting of 20Ne+ ions was selected and transported by electrostatic steerers and quadrupoles to an electrostatic spherical 50° deflector, which directed the ion beam onto the photon beam axis. The beam-merging section extends over a total length of 1.7 m between the 50° deflector, the "merger," and a second double-focusing 90° bending magnet, the "demerger."
An electrically insulated drift tube of 0.495 m length, the interaction region, is mounted coaxially with the two beams within the merging section. It can be set at a desired potential and thus marks the geometrical interaction length in absolute merged-beams cross-section measurements. 20Ne ions (
 ) produced from 20Ne+ by photoionization inside the interaction region on a potential Uint change their initial energy of 6 keV by
  on the way through the drift tube. Thus, they can be separated by the subsequent second 90° bending magnet from the 6 keV 20Ne
 ions generated outside the interaction region, provided Uint is chosen to be sufficiently high. In the present experiment
  was by far sufficient for the complete separation of products from inside and outside the interaction region.
At the entrance and exit of the interaction region, two variable-size rectangular apertures can be used to collimate the ion beam. Each of the two apertures can be defined by employing four independently moving slit jaws. This allows the experimenter to close the apertures such that the photon beam is just touched on four sides by the slit jaws. By forcing the ion beam through the apertures thus defined, perfect beam overlap can be accomplished. This procedure ensures a maximized signal-to-background ratio. After optimizing the alignment of the two beams, the exit slits are opened again in order to guarantee full transmission of all product ions. To quantify the beam overlap, three pairs of piezo-motor-driven slits of only 5 μm width can be moved perpendicularly across the two beams for profile measurements. The scanning slits are mounted at three different positions, at the front, in the middle, and at the rear end of the interaction region. The slits are perpendicular to the two beams and to their respective axes of translation.
Photoions with increased charge states produced along the merging section are separated from the parent ions by the demerger magnet. Depending on their energy (6 keV or 6 keV +  ), they are transported to a detector chamber where an electrostatic spherical 180° deflector bends them out of the horizontal plane and directs them into a single-particle detector (Fricke et al. 1980; Rinn et al. 1982). At the ion energies of the present experiment, the efficiency of this device is almost 100% and is uniform over the whole entrance aperture. The detector features dark-count rates typically below 0.01 s−1. Deflection out of the plane of the second magnet helps to suppress background from stray electrons, ions, or photons.
2.2. Cross-section Measurements
Cross-section measurements at PIPE utilized two different schemes: spectroscopy mode and absolute mode. In spectroscopy mode the interaction region is typically grounded so that the photon–ion signal can be collected from the whole merging section. The photon energy is stepped through a predefined range which, in the present case of Ne+ ions, covered the region around the K-shell ionization threshold. The dwell time at a specific photon energy was typically 10 s in each sweep to allow for accumulation of signal counts with good statistics. When necessary, energy sweeps were repeated until the desired statistical quality of the data was reached. The step width in the scans was chosen such that approximately 10 measured points covered the bandwidth of the photon beam. This implies a sufficient amount of points across each resonance to obtain detailed information about the line shape and eventually also the natural width of the resonance, provided the bandwidth is small compared to the line width. In spectroscopy mode the photon flux  and the ion beam current Iion are recorded along with the photoionization signal counts. Through separate measurements, energy-independent beam overlap factors were found so that relative yields Yζ of signal ions per unit ion current and photon flux could be determined from

where Rζ is the efficiency-corrected count rate of photoionized ions in charge state ζ.
The relative yields of photoions were normalized to cross-section measurements obtained in absolute mode. In this mode cross-sections  are determined from

with the elementary charge e, the ion velocity vion, and the form factor  (Phaneuf et al. 1999).
The form factor  quantifies the overlap of the photon and ion beams in the interaction region:

with the length of the interaction region, L, and the transverse beam-overlap factors F(z) along the merging path. F(z) is measured at the three positions zi ( with z2 set to zero), where the pairs of slit scanners are mounted along the interaction region for beam-profile measurements:

The integrals in Equation (4) are approximated by sums assuming that the ion current density and the photon flux density factorize such that  and
and  . Current line densities
  ,
,  ,
,  , and
, and  measured at
  are displayed in Figure 3. The integration along the beam direction z in Equation (3) requires knowledge of the function F(z). It is obtained by interpolating the form factors
  measured at three different positions zi with a second-order polynomial. With this representation of F(z) the integral in Equation (3) can be evaluated. In the example of the beams represented by Figures 3 and 4 the overall form factor is
  cm−1.
cm−1.
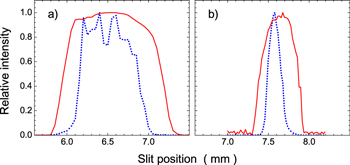
Figure 3. Line density profiles of an 848.66 eV photon beam at 170 meV bandwidth (dotted line) and a Ne+ ion beam (solid line) measured in the (a) horizontal and (b) vertical directions at position  relative to the middle position in the interaction region at z = 0. The intensities displayed show the currents transmitted through slits of 5 μm width after normalization of the maximum to 1. The calculated beam overlap factors at this position are 8.37 cm−1 for the x direction and 21.2 cm−1 for the y direction resulting in
  cm−2. The scales of panels (a) and (b) have identical units. The measured photon beam is relatively flat with a total height of only about 300 μm.
Download figure:
Standard image High-resolution image
Figure 4. Beam overlap form factors F(z) (see Equation (4)) for a Ne+ ion beam used in the present experiment and a 848.66 eV photon beam at 170 meV bandwidth. The solid points were obtained by a sequence of three measurements at positions zi,  , and the solid line is a fit to the measured points using a second-order polynomial. The point
  at
at  results from the data displayed in Figure 3. The length
  of the interaction region is indicated. The overall form factor
  resulting from Equation (3) for this measurement is 5225 cm−1.
Download figure:
Standard image High-resolution imageThe 20Ne+ ion beam current in the measurement discussed above was 16 nA. It had been collimated to a width of about 1.4 mm and a height of 0.6 mm at the entrance of the interaction region. At the exit it had increased to 1.6 × 2.0 mm2. It was collected by a large Faraday cup positioned inside the demerger magnet. The flux of 848.66 eV photons at 170 meV bandwidth was measured by a photodiode that had been calibrated off site by the German National Metrology Institute, the Physikalisch-Technische Bundesanstalt. It produced a diode current of 60.2 μA, which corresponds to a photon flux of  s−1.
s−1.
The error budget of cross-section measurements at PIPE has been discussed previously by Schippers et al. (2014). The systematic uncertainty of the absolute cross-section scale was found to be 15% at the 90% confidence level. Statistical uncertainties are typically small and reach at most a few percent. Only at very low signal rates can the statistical uncertainties be higher.
2.3. Energy Calibrations
For the determination of the correct photon-energy scale, it is necessary to consider the Doppler shift between the moving ions and the photons available at the beamline with energy Elab. The energy Eion of the Ne+ ions inside the interaction region was 6 keV- . With
  , the ion energy was 6.2 keV, and their velocity opposite to the photon beam direction
  cm s−1. The Doppler-shifted photon energy seen by the ions in the present geometry is given by

with  and c the speed of light in vacuum. At
  , the Doppler shift is 0.0817% corresponding to 0.711 eV at
  . Energies of resonances measured in the laboratory have to be corrected for the Doppler shift to obtain the true photon–ion interaction energy.
The laboratory energy scale of the photons was calibrated in the present experiments through comparison with a number of reference energies. These included the  photoexcitation of ground-level
  to the autoionizing term
  at 299.98 ± 0.03 eV (Müller et al. 2009), the energy of the
  transition
 at 848.66 ± 0.1 eV (Oura 2010), and the
  photoexcitation of neutral Ne to Ne
  at 867.29 ± 0.05 eV (derived from the revised resonance energy of Wuilleumier 1971 applying a correction to his 1971 result on the basis of the improved 2014 CODATA values of the fundamental physical constants obtained by Mohr et al. 2016).
The lowest uncertainty of accessible energy standards in the soft-X-ray regime has been quoted for the  transition in neutral Ar to be 4 meV at 244.390 eV (Ren et al. 2011) confirming the earlier results of King et al. (1977), 244.390 ± 0.01 eV, and still supporting the findings of Sodhi & Brion (1984), 244.37 ± 0.02 eV. The transition energies in the present region of interest are quoted typically with much higher uncertainties. For example, the
  transition energy
  in the Ne+ ion was measured to be 848.66 ± 0.1 eV (Oura 2010), i.e., with an uncertainty 25 times higher than the 4 meV maintained for the Ar
  transition.
Alternative access to the Ne+  transition energy is possible by observing Ne
  photons emitted during the
  →
→  decay after K-shell ionization of a neutral neon atom. The Ne
  transition is the reverse of the lowest K-shell excitation of Ne+ in its ground level. Its energy is referenced by NIST to be 848.61 ± 0.26 eV (Deslattes et al. 2003, 2009). An earlier experimental result obtained by using soft X-ray emission spectroscopy is 848.62 ± 0.05 eV (Pettersson et al. 1982) with a much lower quoted uncertainty but still an order of magnitude higher than the 0.004 eV uncertainty claimed for the Ar
  reference. The
  transition energy
  in the Ne+ ion can also be inferred from the K-shell binding energy
  in neutral Ne by subtracting the ionization energy I for neutral Ne:
  . NIST-recommended energies are I = 21.56454 eV (Kramida et al. 2016) and
  eV (Deslattes et al. 2003, 2009), the latter with a one standard deviation uncertainty of 0.18 eV. The resulting transition energy is
  = 848.67 ± 0.18 eV, which agrees with the other available results.
Measurements of the  transition energy in neon are very numerous. Many of them rely on calibration standards as outlined above. Table 1 lists some of the measurements that have been used for calibrating later experiments. One of the prime sources for calibration data that are heavily relied upon come from the investigation of K-shell photoabsorption by neon atoms almost 50 years ago. By using a high-resolution crystal spectrometer, the Ne(
 ) → Ne(
 ) transition energy was found to be 867.29 ± 0.05 eV (Wuilleumier 1971; after a +0.04 eV correction due to new CODATA values as mentioned above; it is worth noting that the original quotation by Wuilleumier 1970 was 867.13 eV which was then corrected by the author himself, Wuilleumier 1971, to 867.25 eV). An independent source for calibration-quality reference standards has been provided by electron energy loss spectrometry. Examples are the
  transition energy results of 867.05 ± 0.08 eV (Hitchcock & Brion 1980) and 867.13 ± 0.07 eV (Sodhi & Brion 1984). The Ne
  transition energy has also been determined from Chandra observations of interstellar gases. Liao et al. (2013) inferred a wavelength of 1.4295 nm while Gatuzz et al. (2015) found 1.4289 nm, both analyzing large sets of observations. These wavelengths correspond to 867.33 eV and 867.69 eV, respectively, with the first being in agreement with the corrected Wuilleumier result. The uncertainty of the energy determined by Liao et al. is asymmetric and amounts to +61 and −132 meV while the quoted uncertainty of the Gatuzz et al. result is ±61 meV, i.e., the two results disagree with one another by about three times their combined quoted uncertainties.
Table 1.
Experimental Excitation Energy (in eV) of the Ne( ) Level from the Ground State of the Neutral Neon Atom
| Wuilleumier | Wuilleumier | Wuilleumier | Hitchcock | Sodhi | Teodorescu | Coreno | Liao | Gatuzz |
|---|---|---|---|---|---|---|---|---|
| 1970a | 1971b | & CODATA 2014c | 1980d | 1984e | 1993f | 1999g | 2013h | 2015i |
| 867.13(5) | 867.25(5) | 867.29(5) | 867.05(8) | 867.13(7) | 867.18(2) | 867.12(5) | 867.33(+6)(−13) | 867.69(6) |
Notes. Numbers in brackets indicate the uncertainties of the last digit(s) of the quoted excitation energies.
aWuilleumier (1970) determined the transition wavelength relative to the wavelength of the Cu transition, i.e., in (relative) X-ray wavelength units xu by employing a crystal spectrometer; conversion to transition energy requires the conversion of xu to m.
bWuilleumier (1971) corrected his previous (1970) result.
cThe present conversion from wavelength to energy has improved and slightly changed since 1971; it depends on the conversion of xu to m, on Planck's constant h and on the vacuum speed of light, c. Given the 133 ppm uncertainty of the measured wavelength, the 2014 versus 2010 changes in these quantities as recommended by the CODATA group (Mohr et al. 2016) had no significant consequences for the Ne(
transition, i.e., in (relative) X-ray wavelength units xu by employing a crystal spectrometer; conversion to transition energy requires the conversion of xu to m.
bWuilleumier (1971) corrected his previous (1970) result.
cThe present conversion from wavelength to energy has improved and slightly changed since 1971; it depends on the conversion of xu to m, on Planck's constant h and on the vacuum speed of light, c. Given the 133 ppm uncertainty of the measured wavelength, the 2014 versus 2010 changes in these quantities as recommended by the CODATA group (Mohr et al. 2016) had no significant consequences for the Ne( ) → Ne(
 ) transition energy but the development of our knowledge of the fundamental physical constants between 1969 and 2016 makes up for a difference of as much as 40 meV.
dHitchcock & Brion (1980) determined the transition energy through high-resolution electron energy loss spectrometry.
eSodhi & Brion (1984) determined the transition energy through high-resolution electron energy loss spectrometry.
fTeodorescu et al. (1993) determined the transition energy by using synchrotron radiation with a calibrated monochromator and by measuring relative photoabsorption cross-sections. The calibration procedures were not specified.
gCoreno et al. (1999) determined the transition energy by using synchrotron radiation with a calibrated monochromator and by measuring relative photoabsorption cross-sections. The calibration was based on using standard reference data provided by electron energy loss spectrometry (King et al. 1977; Sodhi & Brion 1984).
hLiao et al. (2013) determined the transition wavelength by analyzing X-ray absorption in interstellar media. This was converted to energy by using the CODATA 2014 fundamental physical constants (Mohr et al. 2016). Note that the error bars are asymmetric.
iGatuzz et al. (2015) determined the transition wavelength by analyzing X-ray absorption in interstellar media. This was converted to energy by using the CODATA 2014 fundamental physical constants (Mohr et al. 2016).
) transition energy but the development of our knowledge of the fundamental physical constants between 1969 and 2016 makes up for a difference of as much as 40 meV.
dHitchcock & Brion (1980) determined the transition energy through high-resolution electron energy loss spectrometry.
eSodhi & Brion (1984) determined the transition energy through high-resolution electron energy loss spectrometry.
fTeodorescu et al. (1993) determined the transition energy by using synchrotron radiation with a calibrated monochromator and by measuring relative photoabsorption cross-sections. The calibration procedures were not specified.
gCoreno et al. (1999) determined the transition energy by using synchrotron radiation with a calibrated monochromator and by measuring relative photoabsorption cross-sections. The calibration was based on using standard reference data provided by electron energy loss spectrometry (King et al. 1977; Sodhi & Brion 1984).
hLiao et al. (2013) determined the transition wavelength by analyzing X-ray absorption in interstellar media. This was converted to energy by using the CODATA 2014 fundamental physical constants (Mohr et al. 2016). Note that the error bars are asymmetric.
iGatuzz et al. (2015) determined the transition wavelength by analyzing X-ray absorption in interstellar media. This was converted to energy by using the CODATA 2014 fundamental physical constants (Mohr et al. 2016).
Download table as: ASCIITypeset image
Considering the quoted error bars and the substantial scatter of the reference data (in spite of the smaller uncertainties claimed in the associated publications) and accounting for possible additional sources of error in our calibration procedure, we estimate the uncertainty of our energy scale to be 0.2 eV in the region of the Ne+ K edge. Clearly, new improved calibration standards are highly desirable.
3. Results and Discussions
3.1. Neutral Neon Atoms
A byproduct of the present energy calibration is the derivation of absolute cross-sections, resonance energies, and natural line widths for photon-induced electron emission and photoabsorption by neutral neon atoms near the K edge. The processes investigated comprise K-vacancy production via excitations

with  , and via ionization

The calibration measurements allowed us to further investigate photoabsorption by neutral neon as part of the present work on Ne+ ions. The latter is of interest in the context of the natural widths of K-shell vacancy states in neutral and ionized neon, which are expected to be of similar size (see, for example, Teodorescu et al. 1993). Moreover, the data obtained with neutral neon provide a comparative test of the theoretical approaches used for photoabsorption by Ne+ ions.
For these measurements, the photon beam was passed through a Ne gas target at a constant pressure of  hPa. Electron emission from neon atoms induced by photon absorption was measured with four electron detectors simultaneously in a beam-diagnostics setup prior to and after a set of measurements on Ne+ and Ne7+ ions. Four identical spectra were obtained in each measurement after background subtraction and normalization of the count rates seen by the different detectors in a sweep of the photon energy in the range of approximately 863–871 eV at a monochromator exit slit width of 10 μm. Figure 5 shows the spectrum resulting from the sum of the eight individual measurements made before and after the scans of the Ne+ and Ne
 transitions. A linear background, which includes the contribution from valence-shell ionization, was subtracted from the measured electron yield curve. Thus, Figure 5 shows the resultant photoelectron-emission cross-section associated with K-vacancy production (Equations (6) and (7)) only. The energy scale was calibrated such that the
  resonance is located at 867.29 eV, i.e., at the corrected Wuilleumier energy (see Table 1). The spectrum was adjusted to an absolute cross-section scale after the procedures described in the following.
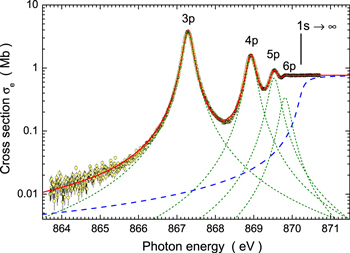
Figure 5. Cross-sections for electron emission from neutral neon following absorption of a single photon by one of the K-shell electrons (yellow-shaded circles). The peak structures are associated with excitations  with resonances resolved for
  . They are represented by Voigt profiles shown as (green) dotted lines. The K-shell threshold step is represented by the (blue) dashed line. The solid (red) line is the result of an overall fit of the observed energy dependence with n up to 11 (profiles for
  not shown). The
  ionization threshold is indicated by the black vertical bar. The spectrum has been indirectly normalized to the absolute photoabsorption cross-sections obtained by Suzuki & Saito (2003). For details, see the text.
Download figure:
Standard image High-resolution imageThe measured electron-yield spectrum was analyzed by a fit comprising the sum of a linear background, plus nine Voigt profiles representing excitation processes according to Equation (6) and a step function representing the cross-section  for direct photoionization of the K shell according to Equation (7). Since the resulting K-vacancy level has a finite natural width Γ the step function is not simply proportional to a Heaviside function, rising from 0 to 1 at the ionization potential
  of the K shell. It instead follows the function

where  is the photon energy.
Essential parameters required for the fit are discussed in the following. The natural width of the  level is
  (see Section 3.2.2). The ionization energy of the Ne K shell is
  eV (Deslattes et al. 2003, 2009). Separate measurements (not shown; A. Müller et al. 2017, in preparation) of photoexcitation Ne
 at the 10 μm monochromator exit slit width showed that the energy bandwidth of the photon beam at 908 eV was no more than 35 meV. The small natural widths of the
  levels predicted to be 7.1 meV for
  and 5.8 meV for
  (Witthoeft et al. 2009) permitted the determination of an upper bound to the experimental energy spread. Considering a photon energy dependence of the resolving power proportional to
  a Gaussian width of approximately 32 meV could be assumed at the energy of the Ne
  excitations. Such a low energy spread results in a resolving power of approximately 27,000. The experiment with the best energy resolution prior to the present measurement featured a photon-energy bandwidth of 40 meV (Saitoh et al. 2000) corresponding to a maximum resolving power of about 22,000.
With the good statistics accumulated in the experiment and with the above data including the constraint of the Gaussian width, the fit of resonances with Voigt profiles yielded stable reliable results for the Lorentzian widths. The resulting fit curve is the solid (red) line in Figure 5. It provided natural widths of 248 +/− 2 meV for the  resonance, 260 +/− 3 meV for the
  , 297 +/− 5 meV for the
  , and 286 +/− 9 meV for the
  resonance. Variation of the Gaussian width between 30 and 40 meV did not change the Lorentzian widths by more than the given statistical uncertainties. In Table 2 the present natural line width for the Ne
  resonance is compared with the results of other high-resolution measurements. The present natural width of 248 +/− 2 for the
  resonance is higher than most of the more recent results obtained in high-resolution experiments but is consistent with these measurements within their error bars. By the present experiment the uncertainty of the natural width of the Ne(
 ) level could be significantly reduced.
Table 2.
Natural Line Width (in eV) of the Ne( ) Level from High-resolution Photoexcitation Measurements
| This Work | Wuilleumier | Hitchcock | Esteva | Teodorescu | Avaldi | Saitoh | De Fanis | Kato |
|---|---|---|---|---|---|---|---|---|
| 1970a | 1980b | 1983c | 1993d | 1995e | 2000f | 2002g | 2007h | |
| 0.248(2) | 0.37 | 0.31 | 0.30(4) | 0.23 | 0.22(3) | 0.244/0.246 | 0.240(10) | 0.252(5) |
Notes. The numbers in brackets denote the uncertainty of the last digits. Several experimental widths were published without providing an estimate of the uncertainty.
aThe result obtained by Wuilleumier (1970) has to be interpreted as an upper limit for the natural line width. bThe result obtained by Hitchcock & Brion (1980) has to be interpreted as an improved upper limit for the natural line width. cEsteva et al. (1983). dTeodorescu et al. (1993). eAvaldi et al. (1995). fSaitoh et al. (2000). gDe Fanis et al. (2002). hKato et al. (2007).Download table as: ASCIITypeset image
For the first time, independent fit results are reported for the widths of the  and
and  resonances. In Table 3 our results for the widths and energies of the Ne(
 ) transitions with
  are provided together with the energies from previous experiments. As discussed above, the energies of the resonances depend on the individual calibration applied in each individual experiment. Shifts of up to 240 meV have to be expected between the different measurements. It is interesting to note that additional discrepancies exist in the relative positions of the np resonances, which are also provided in Table 3 relative to the Ne(
 ) excitation energy. Differences of up to 110 meV occur in an energy range of less than 3 eV. The reason for this is probably in the difficulty in controlling the correlated motion of mirrors and gratings in the monochromator section of each of these experiments.
Table 3.
Natural (Lorentzian) Widths  (in meV) and Excitation Energies Enp (in eV) of the Ne(
 ) Levels with (
 )
)
| Entry |

|

|

|

|
|---|---|---|---|---|
| present | ||||

|
248(2) | 260(3) | 297(5) | 286(9) |
| Enp | 867.29 | 868.928 | 869.530 | 869.815 |

|
0 | 1.638 | 2.240 | 2.525 |
| other | ||||
| Enpa | 867.25 | 868.90 | 869.50 | 869.78 |
 a a
|
0 | 1.65 | 2.25 | 2.53 |
| Enpb | 867.05 | 868.68 | 869.23 | 869.63 |
 b b
|
0 | 1.63 | 2.18 | 2.58 |
| Enpc | 867.25 | 868.84 | 869.50 | ⋯ |
 c c
|
0 | 1.59 | 2.25 | ⋯ |
| Enpd | 867.18 | 868.85 | 869.47 | 869.75 |
 d d
|
0 | 1.67 | 2.29 | 2.57 |
| Enpe | 867.13 | 868.76 | 869.36 | ⋯ |
 e e
|
0 | 1.63 | 2.23 | ⋯ |
| Enpf | 867.12 | 868.69 | 869.27 | ⋯ |
 f f
|
0 | 1.57 | 2.15 | ⋯ |
| Enpg | 867.12 | 868.747 | 869.323 | 869.599 |
 g g
|
0 | 1.627 | 2.203 | 2.489 |
| Enph | 867.13 | 868.76 | 869.36 | ⋯ |
 h h
|
0 | 1.63 | 2.26 | ⋯ |
Notes. The present energies are compared with the results from other high-resolution measurements. The numbers in brackets denote the uncertainty of the last digits. In order to eliminate the effects of different energy calibrations in the experiments, the energies (in eV) of np resonances are also given relative to the energy of the  transition (
 ).
).
Download table as: ASCIITypeset image
When fitting the present resonance energies with a function  with the constant Rydberg energy
  while the K-shell ionization energy
  and the quantum defect
  are the fit parameters, one obtains
  in agreement with a previous electron-spectroscopy measurement that resulted in
  eV (Thomas & Shaw 1974), slightly above the energy suggested by NIST,
  eV (Deslattes et al. 2003, 2009) but very well within the uncertainty of the latter.
From the fit of the electron-production yield resulting from K-shell photoabsorption, the ion-production yield can also be derived. This is possible on the basis of an experimental investigation of single-photon multiple ionization of neon in the K-edge region by Morgan et al. (1997), who determined branching ratios for the production of Ne ions in different charge states after population of the Ne  K-shell excited levels and the
  K-shell ionized residual ion. From the branching ratios the average ion charge was derived, which is identical to the average number of electrons released. The average charge states are 1.37 for n = 3, 1.78 for n = 4, 1.99 for n = 5, and 2.04 for
  . Using these numbers and interpolations for the higher n values together with the individual contributions inferred for each n from the Voigt profiles, the number of photon absorption processes for each contribution represented by Equations (6) and (7) could be calculated and thus the K-shell absorption spectrum was obtained. This can be normalized to the absolute experimental cross-section data obtained by different groups. We chose the data of Suzuki & Saito (2003), which are shown in Figure 6 in the present energy region of interest. These cross-sections have a quoted total relative uncertainty of only 2% at most.

Figure 6. Photoabsorption cross-sections of neutral neon near the K edge. The present ion-yield spectrum has been normalized to the absolute photoabsorption cross-section obtained by Suzuki and Saito (Suzuki & Saito 2003) (open circles with error bars inside the symbols). The present derived cross-section is represented by the solid (red) line. The (green) dashed line is the result of a calculation of photoionization of the Ne  and
and  subshells using the GIPPER code (see Fontes et al. 2015). The theoretical curve has been normalized to the absolute data of Suzuki and Saito by a constant factor of 0.95. The inset shows the near-K-edge fine structure of the cross-section in a narrower energy range.
Download figure:
Standard image High-resolution imageFor the adjustment of the present, originally relative photoabsorption spectrum to the absolute data the contribution from the valence photoabsorption has to be considered. Below the K edge the photoabsorption can only be due to the  and
and  valence shells. This contribution has to be extrapolated into the above-threshold region. For this purpose, the GIPPER code (Fontes et al. 2015) was employed in configuration-average mode to calculate the contributions of
  and
and  ionization. The sum is merely 5% above the data obtained by Suzuki and Saito. The result of the calculation after multiplication with a constant factor of 0.95 is shown as the dashed line in Figure 6. The perfect agreement with the absolute data at energies below the K edge provides confidence in the calculated and normalized valence-shell contribution also above the K-shell ionization threshold. The sum of the valence-shell contribution and the derived K-shell absorption cross-section shown as the solid line in Figure 6 perfectly matches the absolute data points of Suzuki & Saito (2003).
Figure 7 shows a comparison of our derived absolute photoabsorption cross-sections near the K edge of neutral Ne with the only previously available absolute measurements (Kato et al. 2007) and with calculations by Gorczyca (2000), Juett et al. (2006), and Gatuzz et al. (2015). The agreement of theory and experiment in the relative positions, widths of resonances, and the size of the cross-sections is quite good. The shifts in energy are within the range of scatter of the existing precision reference data for the energy of the  resonance. Kato et al. had calibrated their spectrum to the
  transition energy (867.13 eV) found in previous studies (Wuilleumier 1970; Sodhi & Brion 1984). The agreement with the theoretical result provided by Gorczyca (2000), Juett et al. (2006), and Gatuzz et al. (2015) is very good except for the slight discrepancies in the energies of the
  resonances. The present energy calibration used the corrected
  transition energy of 867.29 eV following from the work of Wuilleumier (1971), with corrections for the improvement of the fundamental physical constants accomplished since that early investigation. When the spectrum obtained by Kato et al. (2007) is shifted accordingly, almost perfect agreement between their and the present data set is obtained.

Figure 7. Photoabsorption cross-sections of neutral neon near the K edge. The present result, which is derived from experimental data, is shown in the lower panel as a thick solid (violet) line with light (violet) shading. The position of the Ne K edge recommended by NIST is indicated by a vertical bar with its uncertainty range. The absolute data point of Suzuki & Saito (2003) falling into the present energy range is represented by the open circle with total uncertainty bars (in both panels). The theoretical photoabsorption cross-section calculated by Gorczyca (2000), Juett et al. (2006), and Gatuzz et al. (2015) is shown in the upper panel as a solid line with light (green) shading together with the absolute experimental cross-section (solid dots) obtained by Kato et al. (2007). The two experimental spectra were calibrated to the energy of the  resonance from different sources (see the text). When the Kato et al. result is shifted to the corrected transition energy used in the present experiment (open circles in the lower panel), both measurements are in excellent agreement.
Download figure:
Standard image High-resolution imageIt is noted that the calculation by Witthoeft et al. (2009) for neutral neon reproduces the experimental direct K-shell photoionization cross-section (see Equation (7)) quite well. However, the resonance positions and their relative sizes and widths are generally not well reproduced. The  resonance calculated by Witthoeft et al. (2009) is off from the reference energy by as much as 5.7 eV. The natural width of the
  resonance obtained by Gorczyca (2000), Juett et al. (2006), and Gatuzz et al. (2015) is 247 meV, in perfect accord with the present experiment, while the calculation by Witthoeft et al. (2009) yielded 200 meV.
3.2. Singly Charged Neon Ions
3.2.1. Overview
With the goal of obtaining a broad overview of photoionization of  ions, we measured cross-sections at a large photon-energy bandwidth of 500 meV so that a high photon flux of
  s−1 was available. At this photon flux it was possible to measure energy scans of ion yields from single, double, and triple ionization of Ne+ by a single photon. Absolute scan cross-sections were obtained by normalization to separate absolute measurements (see Section 2.2). The resulting scan cross-sections are displayed in Figure 8. The most prominent resonance feature is found in single ionization in panel (a) near 849 eV. It is associated with photoexcitation of a K-shell electron filling the initial
  vacancy in the L shell:

In a subsequent second step, single-Auger decay releases one electron and produces a Ne2+ product ion, which is the experimental signature of net single ionization of the Ne+ parent ion. An alternative relaxation mechanism is the emission of a photon, leaving the charge state of the initial Ne+ ion unchanged. The probability for radiative decay has been calculated by Wang et al. (2012) and amounts to less than 1.5%, resulting in a cross-section for resonant photon scattering of less than 5 kb. Although photons could not be detected, the present experiment can still provide the absorption oscillator strength for the transition described by Equation (9) as discussed in the following subsection. In this context, it is noted again that the upper level populated by K-shell excitation according to Equation (9) is identical with the result of the removal of a K-shell electron from neutral neon. Radiative relaxation of this level leads to the emission of  radiation. According to Deslattes et al. (2003), the
  transition energy is 848.61 ± 0.26 eV, whereas Oura (2010) quoted 848.66 ± 0.1 eV.
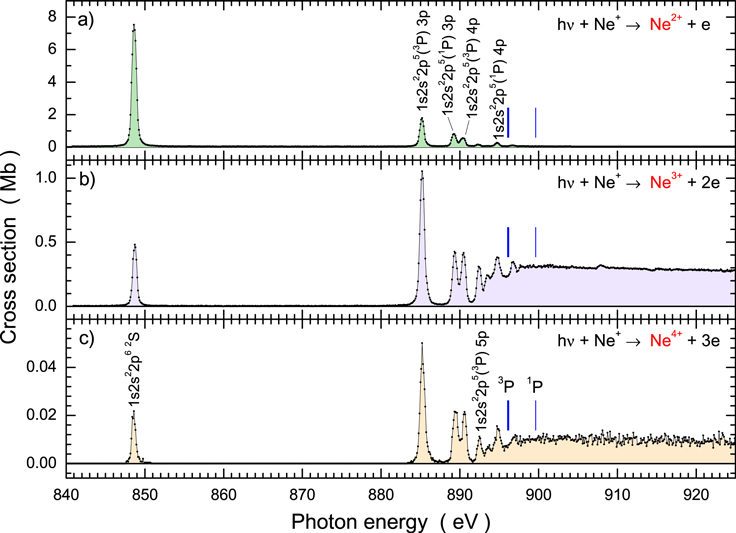
Figure 8. Overview of the present absolute experimental photoionization cross-sections of Ne+ ions near the K edge: single ionization (a), double ionization (b), and triple ionization (c). The experimental energy resolution was approximately 500 meV. The dominant resonance features are assigned to excited configurations forming 2P terms. The (blue) vertical lines indicate the K-shell ionization thresholds for the  levels calculated using the Cowan code (Cowan 1981).
Download figure:
Standard image High-resolution imageIf the second step after K-shell excitation (according to Equation (9)) is associated with the emission of two electrons, net double ionization results, i.e., a Ne3+ product ion is detected (panel (b) in Figure 8). Obviously, it is also possible that three electrons are emitted after K-shell excitation, producing a Ne4+ ion, which means net triple ionization of the parent Ne+ ion (panel (c) in Figure 8). Mechanisms for multi-electron emission will be discussed below. In contrast to most previous experiments addressing K-shell excitation and ionization of positive ions, the present experiment covers a very wide energy range including the lowest-energy K-vacancy resonances as well as the K edge and energies well above the K-shell ionization threshold. Previously, wide-energy range measurements on ions were reported only for photoionization near the K edge of C+ ions (Müller et al. 2015) and for photoionization up to the K-shell ionization threshold of O+ and  by Bizau et al. (2015). For the negative ions that have been experimentally studied so far, the energy range including both the resonances and the K edge is relatively small. A recent comprehensive study of double and triple photodetachment of O− ions covered an energy range of 524–543 eV, which includes the complete resonance region with a single dominant resonance and the two most important K-shell ionization thresholds (Schippers et al. 2016a).
Single ionization is primarily associated with K-shell photoexcitation resonances. The dominant peaks in panel (a) of Figure 8 were identified on the basis of calculations using the Cowan code (Cowan 1981). The peak assignments are given in the figure. The spectrum is essentially a combination of two Rydberg series of  resonances converging either to the
  or the
  series limit corresponding to the lowest-energy K-shell ionized levels with configuration
  . The single-ionization cross-section is almost zero at photon energies greater than 896 eV. The
  levels were calculated to be at 896.05 eV, 896.15 eV, and 896.21 eV, respectively. At energies beyond these K-shell ionization thresholds, the absorption of a single photon can directly produce either a Ne2+ ion with a vacancy in the K shell or a Ne+ ion with a minimum of two electrons excited from their original subshells where at least one must have initially been in the K shell. Cross-sections for such double photoexcitations must be expected to be small, and the present experiment confirms that expectation. Hence, the dominant photoabsorption channel beyond the K-shell ionization thresholds is the direct removal of a K-shell electron. The resulting K-vacancy state in Ne2+ can decay via the emission of photons and/or electrons. Relaxation of such states by photoemission is very unlikely (see above). Therefore, a Ne2+ ion resulting from direct K-shell photoionization of Ne+ must be expected to have a very low probability below the sensitivity of the present experiment. As discussed in the context of the excitation described by Equation (9), a cross-section in the low kilobarn range is to be expected, three orders of magnitude smaller than that for the resonance in the single-ionization channel at 849 eV. Hence, there is no obvious signature of the K edge in the cross-section for net single ionization of Ne+.
With the arguments provided above, the  resonance in single ionization at about 849 eV represents almost the entire photoabsorption at that energy. Excitation of a
  (K-shell) electron to np with higher principal quantum numbers n is associated with cross-sections rapidly decreasing with n. Contributions beyond n = 4 are not visible in panel (a) of Figure 8. One must assume that Auger cascades leading to the ejection of more than one electron become increasingly important and thereby reduce the probability for net single ionization after K-shell excitation to higher n shells. This is confirmed by the results presented in panels (b) and (c) of Figure 8.
The cross-sections for double ionization of Ne+ induced by a single photon are displayed in panel (b) of Figure 8. The scale is down by almost an order of magnitude. Now the dominant feature is the resonance peak at about 885 eV associated with  excitations, leading to intermediate states of the type
  . The peak height is almost comparable with that of its counterpart in the single-ionization channel. For the more highly excited resonances associated with increasing principal quantum numbers of the excited electron, the contributions to the double-ionization channel become increasingly more important relative to the single-ionization channel. Above the K-shell ionization thresholds marked by the solid (blue) vertical lines in Figure 8, the ionization continuum cross-section is clearly visible. The statistical scatter in the experimental double-ionization data is so small that tiny features from double-excitation resonances become visible at energies of about 908 and 915 eV. These resonances will be discussed separately below.
Since detector backgrounds were comparatively very low in the present experiments, it was possible to also measure cross-sections for photon-induced triple ionization. The results are displayed in panel (c) of Figure 8. The cross-section scale is now down by another factor of roughly 20, and the cross-sections measured have magnitudes of less than 10 kb. The continuous cross-section above the K-shell ionization threshold is visible again, though very small, indicating the principal possibility of double-Auger or Auger-cascade decay of Ne  . The probability of this happening is approximately 5% of that for single-Auger decay.
3.2.2. Resonance Parameters and Decay Probabilities
In the present experiment an attempt was made to determine the natural width of the  level (i.e., the width of the neon
  transition). To measure the natural line width, the photon-energy bandwidth was reduced to a level of approximately 32 meV (see Sections 3, 3.1). Two independent measurements were carried out to determine the resonance parameters of the
  level in the channel of single ionization and in the channel for double ionization with slightly varied experimental conditions. Two of the four spectra obtained are displayed in Figure 9 together with the Voigt fit results. All four spectra were simultaneously subject to a global fit in order to infer the desired parameters with optimum statistics.
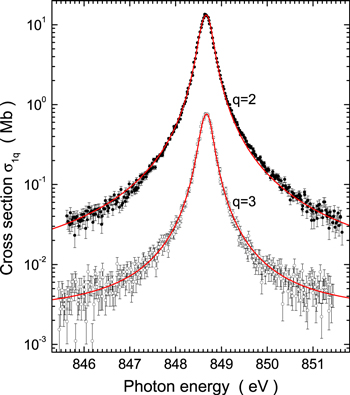
Figure 9. Measured cross-section functions (on a logarithmic scale) for the excitation of ground-term Ne+ to the  level observed in the final channels of single ionization (q = 2) and double ionization (q = 3). The solid red lines are the results of a global fit of two Voigt functions to the two distributions shown here plus two equivalent measured distributions (not shown) with identical resonance energies and identical natural widths. The fit yielded the Lorentzian width of the
  level to be 261 ± 3 meV.
Download figure:
Standard image High-resolution imageThe ground state of the Ne+ ion is associated with the level  . The first excited state of Ne+ belongs to the upper fine-structure level
  (which is the lower level of the
  transition) within the ground-state configuration. According to calculations with the Cowan code (Cowan 1981), the
  level is 95.8 meV above the
  ground level. This is in excellent agreement with the NIST-recommended value of 96.76 meV (Kramida et al. 2016). Hence, the
  and
and  lines are separated by less than 100 meV while their width is expected (Krause & Oliver 1979) to be 0.24 eV (near the width of the
  transition in neutral neon; see Section 3.1). Therefore, the two
  lines cannot be resolved.
Due to the small transition energy and, more importantly due to the identical parities of both levels within the  ground-state term, which forbid an electric dipole transition between the two levels, one has to expect a very long lifetime for the upper level. Indeed, a lifetime of 117 s for the
  level has been calculated by Mendoza (1983).
The ECR ion source used in the present experiments most likely produces a statistical population of the levels within the ground term. This is supported by the findings in level-resolved photoionization experiments with ground-level and metastable excited beryllium-like ions (Müller et al. 2010b). Considering the ion flight time of the order of 40 μs between the ion source and the interaction region of the present experiment, the initial population does not change significantly prior to the measurement. Hence, one must assume that two-thirds of the ions used in the present photoionization experiment were in the  ground level and one-third of the ions were in the excited
  level.
Accepting the presence of a mixture of Ne+ ions in the two different fine-structure levels present in the parent ion beam of the experiment, the fit of the two resonance peaks shown in Figure 9 has to include two Voigt profiles for each peak. Each peak consists of 2/3 and 1/3 contributions from the  and
and  levels, respectively, separated by 96.76 meV. The natural width of the
  ground level is 0 and that of the
  excited level is less than
  eV, totally negligible compared to the width of the
  level. Hence, identical widths for the two fine-structure components of the peaks shown in Figure 9 have to be assumed.
The resulting fit curves for the two resonance peaks in Figure 9 are the (red) solid lines, each comprising two Voigt profiles adjusted simultaneously to a second, equivalent pair of measurements (not shown) in a global fit to the measured peak functions labeled q = 2 and q = 3. The peaks in Figure 9 only differ from one another by the peak areas. Their Lorentzian widths are identical. The pair of fine-structure levels involved in both observation channels has a fixed energy splitting of 96.76 meV. The results of the fit are the known peak position near 848.66 eV (Oura 2010; to which the energy axis for the peak functions had been calibrated), the peak areas already mentioned above (6.02 Mb eV and 0.348 Mb eV, respectively), and the Lorentzian width of 261 meV with a statistical uncertainty of 3 meV.
The two individual contributions arising from the  and
and  transitions, which correspond to the
  and
and  lines, respectively, are shown as separate resonance peaks in Figure 10. The shaded peaks represent the contributions with their experimental widths. Clearly, with a natural width of 261 meV and a separation of only 96.76 meV, the two peaks cannot be resolved. At the bandwidth of the present experiment, the peaks are measured practically with their natural line shapes. Since the population of the two possible parent ion levels is not really known, we estimate the total systematic uncertainty of the natural width of the
  lines to be ±5 meV.

Figure 10. Cross-sections for resonant single ionization of Ne+ ions (note the linear scale in contrast to Figure 9) associated with the excitation of ground-term Ne+ to the  level. The solid red line is the result of the global fit from Figure 9. In addition to the data provided in that figure, the two contributions arising from the
  and
and  transitions (the
  and
and  lines, respectively) are shown as separate resonance peaks. The shaded peaks are the
  lines with their experimental widths. With a bandwidth of 32 meV and a natural width of 261 meV, the natural line shapes (not shown) are almost indistinguishable from the simulated experimental peak functions. The relative contributions of the two transitions were assumed to follow the statistical weights, 1/3 and 2/3, of the
  and the
  initial levels, respectively.
Download figure:
Standard image High-resolution imageThe natural width of 261 ± 5 meV determined by the present experiment is in accordance with the value of 0.24 eV suggested on the basis of semi-empirical methods by Krause & Oliver (1979). The lifetime of the  K-vacancy level (Z = 10) resulting from the present experiment is 2.52 ± 0.05 fs. This is substantially shorter than the lifetime of 4.0 ± 0.3 fs found recently for the isoelectronic
  K vacancy of (Z = 8) O− (Schippers et al. 2016a). It is also shorter than the lifetimes of the possible terms of
  populated by removing a K-shell electron from a carbon atom. Those lifetimes were found to be 6.3 ± 0.9 fs for the 2D term, 11.2 ± 1.1 fs for the 2P term, and 5.9 ± 1.3 fs for the 2S term in an attempt similar to the present study where the natural widths of levels are determined by exciting the K shell of a singly ionized ion, i.e., of levels that are usually prepared by removing an electron from a neutral atom (Schlachter et al. 2004). The lifetime of a similarly produced K-vacancy level,
  , was found to be 14.0 ± 0.6 fs (Müller et al. 2014). Comparison of these results indicates a strong reduction of the lifetime of such levels as a function of the atomic number Z.
Research addressing the natural width of the  level has been reviewed several times (Bambynek et al. 1972; Krause & Oliver 1979; Campbell & Papp 2001; Kato et al. 2007; Sampaio et al. 2015). Over more than eight decades, numerous theoretical predictions have been made with a substantial spread of the results, some of which are presented in the following list: 0.263 eV (McGuire 1979), 0.269 eV (Chase et al. 1971), 0.245 eV (Walters & Bhalla 1971), 0.0038 eV (Behar & Netzer 2002; derived from the total decay rate of
  s−1 provided in their Table 1 which is assumed to be due to a misprint), 0.292 eV (Gorczyca et al. 2003), 0.255 eV (Palmeri et al. 2008, using the AUTOSTRUCTURE code; Badnell 1997), 0.273 eV (Wang et al. 2012), and 0.296 eV (Sampaio et al. 2015). The experimental data available in the literature were inferred from the analysis of spectra arising from K-vacancy levels of Ne excited by irradiation of neutral neon gas. Experimental widths inferred for the
  level are 0.23 ± 0.02 eV (Gelius 1974, this value was later corrected to 0.27 eV; Svensson et al. 1976), 0.30 ± 0.04 eV (Esteva et al. 1983), 0.21 eV (Teodorescu et al. 1993, without an estimate of the uncertainty), and 0.25 ± 0.03 eV (Avaldi et al. 1995). The present experiment yielded 0.261 ± 0.005 eV. Table 4 lists the experimental results for the natural width of the
  level. Table 5 compares the present results with the available theoretical data.
Table 4.
Experimental Natural Line Width (in eV) of the Ne+( )Level from High-resolution Measurements
| This Work | Svensson | Esteva | Teodorescu | Avaldi |
|---|---|---|---|---|
| 1976a | 1983b | 1993c | 1995d | |
| 0.261(5) | 0.27(2) | 0.30(4) | 0.21 | 0.25(3) |
Notes. The numbers in brackets denote the uncertainty of the last digit.
aSvensson et al. (1976), correcting the previous 0.23 ± 0.02 eV of Gelius (1974). bEsteva et al. (1983). cTeodorescu et al. (1993), no estimate of the uncertainty was provided. dAvaldi et al. (1995).Download table as: ASCIITypeset image
Table 5.
Parameters Associated with the  Transition from the Excited
  Level
Level
| Parameter | This Work | Wang | McGuire | Chase | Walters | Gorczyca | Palmeri | Behar | Sampaio |
|---|---|---|---|---|---|---|---|---|---|
| 2012a | 1969b | 1971c | 1971d | 2003e | 2008f | 2002g | 2015h | ||
![${{\rm{\Gamma }}}_{[\mathrm{eV}]}$](https://content.cld.iop.org/journals/0004-637X/836/2/166/revision1/apjaa54baieqn222.gif)
|
0.261(5) | 0.273 | 0.263 | 0.269 | 0.245 | 0.291 | 0.258 | 0.0038i | 0.296 |
![${{\rm{\Gamma }}}_{a[{eV}]}$](https://content.cld.iop.org/journals/0004-637X/836/2/166/revision1/apjaa54baieqn223.gif)
|
0.257(6) | 0.269 | 0.258 | 0.265 | 0.241 | 0.287 | 0.253 | ⋯ | 0.291 |
![${{\rm{\Gamma }}}_{\gamma [{eV}]}$](https://content.cld.iop.org/journals/0004-637X/836/2/166/revision1/apjaa54baieqn224.gif)
|
0.0036(5) | 0.004 | 0.0049 | 0.0038 | 0.0040 | 0.0043 | 0.00477 | 0.0039j | 0.00468 |

|
0.0138(21) | 0.0147 | 0.0185 | 0.0143 | 0.0164 | 0.0147 | 0.0185 | ⋯ | 0.0159 |
| fik | 0.059(9) | ⋯ | 0.072 | ⋯ | ⋯ | 0.072 | 0.077 | 0.062 | ⋯ |
Notes. For comparison, some of the present experimental data are listed along with the available theoretical results. The parameters given in the table are explained in the text. Numbers in brackets indicate the uncertainty of the last digit(s).
aWang et al. (2012). bMcGuire (1979). cChase et al. (1971). dWalters & Bhalla (1971). eGorczyca et al. (2003). fPalmeri et al. (2008). gBehar & Netzer (2002). hSampaio et al. (2015). iThe entry in their Table 1 is assumed to be a misprint; hence, the total Auger width and the fluorescence yield
  are not provided here. A later correction by Gorczyca et al. (2003) suggests
  = 0.0215.
jThe entry in their Table 1 is only for the Ne+(
= 0.0215.
jThe entry in their Table 1 is only for the Ne+( ground level (Gorczyca et al. 2003); here the Ne+(
 ) level is included.
Download table as: ASCIITypeset image
Many of the theoretical widths are outside the experimental range. More work should be carried out to resolve that discrepancy. It should be noted, though, that the recent result from a large-scale theoretical calculation of the width of the isoelectronic  K-vacancy level in O− is in excellent agreement with the corresponding experimental value (Schippers et al. 2016a). This shows that atomic-structure theory is also capable of producing accurate results for highly correlated systems if an appropriate effort is made.
The natural width of the  level found to be
  in the present experiment is the sum of partial widths of the various individual channels into which the initial level can decay:

with the partial widths for photoemission  , for one-electron emission
  , for two-electron emission
  , and for three-electron emission
  . Higher-order electron-emission processes can be safely neglected. The n-electron emission channels are due to different Auger-decay mechanisms. The sum
  is the total Auger width and includes all relevant autoionizing decays of the initial excited level. The partial widths
  are closely related to the decay probabilities Ax and the partial lifetimes
  for decays into channels
  , respectively. All these quantities can be derived from the present measurements, which include absolute cross-sections for n-electron emission with
  . From these cross-sections and the measured natural width, one can also derive branching ratios
  for photoemission (the fluorescence yield) and for the emission of one, two, or three electrons. The key to the fluorescence yield is the relation between the total resonance strength S for photoabsorption populating the excited level k from the initial level i and the associated oscillator strength fik for absorption (the relevant equations have been provided by Müller 2015):

where Eγ is the photon energy and  is the total cross-section for absorption. The quantity fik, in turn, is related to the radiative (dipole) decay rate Aki of the excited level (Wiese & Fuhr 2009),

with Aki in units of s−1, the transition wavelength λ in nm, and the statistical weights gi and gk of the initial and final levels i and k, respectively.
For the  level, all the decay rates and associated quantities are derived in the following on the basis of the present experiments. From the cross-sections displayed in Figure 8, one can determine the areas under the lowest-energy peaks in panels (a)–(c) at 848.66 eV. For single ionization S1e = 6.02 Mb eV is obtained, for double ionization S2e =0.348 Mb eV, and for triple ionization S3e = 0.015 Mb eV. The total absorption strength is
  =6.38 Mb eV +
  .
.
In a first approximation, the cross-section for the photoemission channel and hence the associated resonance strength  , is neglected relative to Auger decay. With a slightly too small number for S, 6.38 Mb eV, an approximate oscillator strength
  results from Equation (11). According to Equation (12) the slightly too small transition rate
  s−1 is obtained for the
  transition and
  s−1 for the
  transition. Here, identical oscillator strengths fik are assumed for the transitions
  and
and  . This assumption is well justified. An extended calculation using the Cowan code with consideration of a broad basis of relevant configurations gives
  for both transitions (a number that is about 20% above the experimental result).
The resulting partial widths  are 0.0012 eV for the
  transition and 0.0024 eV for the
  transition. Both numbers are indeed negligible compared to the total natural width of 0.261 eV of the
  level. Including radiative transitions from the excited
  level in addition to Auger decays adds very little, 0.0036 eV, to the total natural width. The resonance strength
  for photoabsorption with subsequent emission of electric dipole radiation is
  , which is approximately 6.38 Mb eV
  = 0.088 Mb eV. With this first-order approximation, one can correct the total absorption strength to obtain the second-order result S = 6.38 Mb eV +
  = 6.47 Mb eV, which is only 1.4% different from the first-order approximation. This difference is already by far smaller than the experimental uncertainty of the cross-section measurements. Higher-order corrections beyond the second order are therefore not required.
The second-order approximations for the decay quantities related to the excited  level addressed in the previous paragraphs are listed in Table 5 together with the theoretical data. Table 6 summarizes additional parameters for the decay of the Ne+(
 ) level, which can be inferred from the present experiment.
Table 6.
Summary of the Parameters for the Decay of the Excited  Level that Have been Inferred from the Present Experiment and are Not Already Shown in Table 5
![${S}_{[\mathrm{Mb}\mathrm{eV}]}$](https://content.cld.iop.org/journals/0004-637X/836/2/166/revision1/apjaa54baieqn269.gif)
|
![${S}_{1e[\mathrm{Mb}\mathrm{eV}]}$](https://content.cld.iop.org/journals/0004-637X/836/2/166/revision1/apjaa54baieqn270.gif)
|
![${S}_{2e[\mathrm{Mb}\mathrm{eV}]}$](https://content.cld.iop.org/journals/0004-637X/836/2/166/revision1/apjaa54baieqn271.gif)
|
![${S}_{3e[\mathrm{Mb}\mathrm{eV}]}$](https://content.cld.iop.org/journals/0004-637X/836/2/166/revision1/apjaa54baieqn272.gif)
|
![${S}_{\gamma [\mathrm{Mb}\mathrm{eV}]}$](https://content.cld.iop.org/journals/0004-637X/836/2/166/revision1/apjaa54baieqn273.gif)
|
![${A}_{{ki}[{10}^{12}{{\rm{s}}}^{-1}]}$](https://content.cld.iop.org/journals/0004-637X/836/2/166/revision1/apjaa54baieqn274.gif)
|
![${A}_{a[{10}^{14}{{\rm{s}}}^{-1}]}$](https://content.cld.iop.org/journals/0004-637X/836/2/166/revision1/apjaa54baieqn275.gif)
|

|
![${\tau }_{[{10}^{-15}{\rm{s}}]}$](https://content.cld.iop.org/journals/0004-637X/836/2/166/revision1/apjaa54baieqn277.gif)
|
![${\tau }_{\gamma [{10}^{-13}{\rm{s}}]}$](https://content.cld.iop.org/journals/0004-637X/836/2/166/revision1/apjaa54baieqn278.gif)
|
| 6.47(98) | 6.02(90) | 0.348(52) | 0.015(3) | 0.088(14) | 3.63(55)/1.81(28) | 3.90(9) | 0.985(10) | 2.52(5) | 1.83(4) |
Note. The parameters are explained in the text. Two Aki values are provided separately for the final levels  and
and  in the ground term of the Ne+ ion. Uncertainties of the last digit(s) are given by the number in brackets following each entry. The quantities τ and
  are the natural lifetime and the partial lifetime for radiative decay, respectively.
Download table as: ASCIITypeset image
In a similar manner, the other resonance peaks in the spectra shown in Figure 8 which belong to the Rydberg series of the  levels can be analyzed. It is interesting to note the branching ratios for the second peak at about 885 eV labeled
  in Figure 8, forming a 2P term. The peak areas are 1.34, 0.89, and 0.0403 Mb eV and the resulting branching ratios for one-, two- and three-electron emission are approximately 59.0%, 39.2%, and 1.8%, respectively, quite different from the corresponding probabilities for the
  level. Assuming that radiative stabilization can be neglected, an absorption oscillator strength of f = 0.021 is inferred for the transition
  from the summed peak areas. The branching ratios found for
  ions are comparable to those for
  transitions in neutral neon forming Ne
  . The associated branching ratios measured by Morgan et al. (1997) for the first K-shell excited term in neutral Ne are 65%, 32%, and 2%, not too far from the present
  result for Ne+ ions.
3.2.3. Decay Mechanisms
From the observations of different neon ion charge states generated as a consequence of K-vacancy production, some interesting conclusions on possible decay mechanisms of K-vacancy states can be drawn. In a previous experiment on five-electron C+ ions, the observation of  product ions provided unambiguous proof for the occurrence of triple-Auger decay, which is a four-electron Auger process in which three electrons are simultaneously ejected while the fourth electron jumps into the K-shell vacancy (Müller et al. 2015). Net single, double, or triple ionization as a consequence of an initial K-shell excitation of Ne+ ions can directly result from single-, double-, or triple-Auger decay (see Figure 11) but other decay paths also have to be considered.
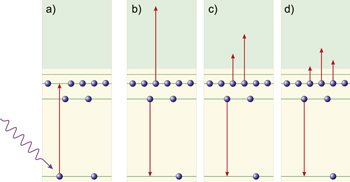
Figure 11. Photoexcitation of the  level (a) and subsequent possible Auger decay mechanisms: single-Auger decay (b), double-Auger decay (c) and triple-Auger decay (d). The decay pathways shown in panels (b)–(d) are only meant to be representative of whole classes of Auger decays. For example, single-Auger decay may also involve two of the 2p electrons or both 2s electrons in addition to the K–L
 L
L pathway depicted in panel (b). In principle, all possible levels associated with a certain class of Auger decays have to be considered in a full ab initio theoretical treatment. These considerations also hold for Figures 12 and 13, where many more configurations and levels may be involved.
Download figure:
Standard image High-resolution imageIn the case of net single ionization, which is observed long after the initial K-shell excitation, one single electron is ejected from the excited parent particle. In the present experiment the parent ion was Ne+, and Ne2+ product ions were detected. The flight times of ions between photoexcitation and subsequent charge-state analysis in the demerger magnet were at least 3 μs for absolute cross-section measurements. Decay times of atomic transitions are typically very much shorter than microseconds so that the detected product ions can be safely assumed to be in their final charge state and with a high probability even in their ground level. The simplest process that can lead to the ejection of one electron is the normal Auger decay, which involves two electrons from the L shell at the strongest resonance in the single-ionization spectrum. That resonance is associated with the  K-vacancy level. There may also be processes that involve additional excitation of outer-shell electrons via shake-up during the Auger decay; however, there is no immediate evidence for such higher-order processes available in the single-ionization cross-section function measured in this experiment.
When net double ionization is observed, i.e., when triply ionized Ne3+ product ions are detected, the simplest mechanism for this observation channel is a (one-step) double-Auger process (Carlson & Krause 1965) occurring after excitation of ground-term Ne+ to  . When the K vacancy after the
  excitation is filled by an L-shell electron, two additional electrons are ejected in that case by a correlated process (see panel (c) in Figure 11).
Cascades of two consecutive electron emission processes can also contribute to net double ionization. For the discussion of possible mechanisms, it is helpful to have an idea about the binding energies of electrons in the  ,
,  , and
, and  subshells of Ne+. By using the Cowan code for ionization in configuration-averaged mode the following binding energies were obtained: 993.7 eV for the
  , 76.0 eV for the
  , and 47.2 eV for the
  subshells of
  . The fine-structure splitting of the
  subshell is negligibly small in this context. The energy difference between the
  and the
  levels is not sufficient to support an
  –
– L
L Auger or, more correctly, a super Coster–Kronig decay, where a
  vacancy would be filled by a
  electron and a second
  electron is released. Thus, a simple Auger cascade started by a K–
 L single-Auger decay is energetically not possible. Figure 12 shows the possible two-step two-electron emission processes. Panel (a) illustrates a first decay step in which a regular Auger decay involving the
  vacancy and two electrons in the
  subshell, a
  transition, produces a Ne2+ ion with two vacancies in the
  subshell. Panel (b) shows a subsequent three-electron Auger decay where two
  electrons simultaneously jump into the
  vacancies produced in the first step and give their combined transition energy to a third
  electron, which then finds itself in the continuum. It is not immediately obvious though that this process is energetically allowed. A very simple calculation with the Cowan code suggests that the combined energy of the two
  transitions is not sufficient to release another
  electron. When doing level-resolved ionization calculations including configuration interactions, the process turns out to be possible with a kinetic energy of the released electron of only about 0.1 eV.
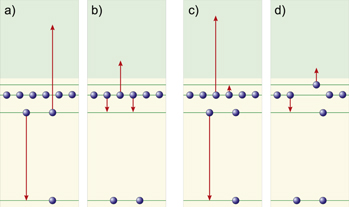
Figure 12. Two possible indirect decay schemes for  ions ending up in the Ne3+ channel after ejecting two electrons. The direct process is a double-Auger decay, depicted in panel (c) of Figure 11. Panels (a) and (b) show a regular K–L
 L
L single-Auger decay followed by a three-electron Auger process in which two electrons join in giving energy to a third one that is released to the continuum. The second scheme involves an Auger decay with the additional excitation (shake-up) of a third electron, shown in panel (c), followed by a regular Auger decay (panel (d)) ejecting the excited electron. Note the explanation given at the end of the caption to Figure 11.
Download figure:
Standard image High-resolution imageA less energy-restricted two-step process becomes possible when the first step, single-Auger electron emission, is accompanied by the excitation of a second electron to a high Rydberg state, which is so loosely bound that a rearrangement of the remaining electrons in the L shell can result in the ejection of the Rydberg electron (see panels (c) and (d) in Figure 12). In any case, the net result of double ionization, i.e., the ejection of two electrons from K-shell excited  ions, requires interactions of three electrons at the same time.
The situation becomes even more complex when Ne4+ product ions are detected, i.e., when three electrons are ejected from the K-shell excited  ion. The source of energy is solely the existence of one K-shell vacancy below a completely filled L shell. Direct triple-Auger decay involving the interaction of four electrons (Müller et al. 2015) is a possible scenario (see panel (d) in Figure 11). An alternative could be a multistep decay involving the transition of a
  electron into the initial K vacancy ejecting a second
  electron to the continuum while, at the same time, two L-shell electrons are excited to loosely bound Rydberg levels (see panel (a) of Figure 13). In one or two subsequent steps, the two
  vacancies can be filled by electrons from the
  or
or  subshells ejecting a Rydberg electron each (see panel (b) of Figure 13). The first step in this scenario would also be a four-electron decay mechanism, similar to direct triple-Auger decay. Another variation would be a double-Auger decay accompanied by excitation of a third electron to a level that has to be sufficiently loosely bound so that a subsequent Auger process can happen (see panels (c) and (d) of Figure 13). All such scenarios require four-electron Auger decays either in one step or during the course of an electron-emission cascade. Such a strong statement without measuring electron energies is possible in this particular case, where there is only the L shell above the K vacancy and where the subshells of the L shell are separated from one another by energy differences too small to facilitate simple Auger cascades. If the splitting between the
  (
( ) and the
  (
( ,
,  ) subshells were sufficiently big, a sequence of an initial
  Auger decay and two subsequent super Koster–Cronig transitions such as
  would be conceivable; however, the
  energy gap in Ne+ is too small to facilitate such a cascade of one-electron emissions adding up to the ejection of three electrons altogether. Instead, multi-electron processes are required for the release of three electrons as detailed above. This is also supported by our recent theoretical and experimental investigation of resonant double and triple detachment of isoelectronic O− ions (Schippers et al. 2016a). There it was found that the theoretical description of triple detachment requires the inclusion of Auger emission accompanied by a double shake-up of L-shell electrons, i.e., such four-body interactions have to be accounted for in the calculations.
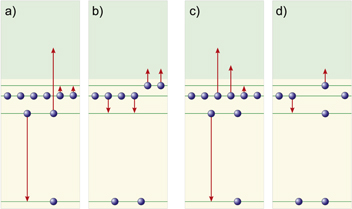
Figure 13. Two possible indirect decay schemes for  ions ending up in the Ne4+ channel after ejecting three electrons. The direct process is a triple-Auger decay, depicted in panel (d) of Figure 11. Panels (a) and (b) show an Auger decay accompanied by the excitation of two electrons followed by two Auger processes ejecting two electrons in either a single event or in two separate steps. The second scheme involves an Auger decay with ejection of two electrons plus the additional excitation of a fourth electron, shown in panel (c), followed by a regular Auger decay (panel (d)) ejecting the excited electron. Note the explanation given at the end of the caption to Figure 11.
Download figure:
Standard image High-resolution image3.2.4. Comparison with Theory
Photoabsorption by Ne+ ions near the K edge has been investigated theoretically by Gorczyca (2000), Juett et al. (2006), and Gatuzz et al. (2015), and by Witthoeft et al. (2009), with both groups using R-matrix theory (Burke & Berrington 1993; Burke et al. 2006, pp. 237–318). Based on an ab initio theoretical approach with a close-coupling expansion that is necessarily restricted to a finite basis, R-matrix calculations can differ in many aspects concerning suitable representation of wave functions and Hamiltonians for describing excitation and decay processes. For details of the calculations we refer the reader to the original papers. The most significant difference between the calculations by Gorczyca et al. and Witthoeft et al. appears to be in the treatment of Auger decay subsequent to K-shell vacancy production. Gorczyca et al. employed an optical potential method that had been introduced by Gorczyca & Robicheaux (1999) to account for autoionization channels, which can otherwise be missed in a calculation using a finite basis set. The effect of the optical potential is the extreme broadening of resonance profiles in inner-shell excitation of atoms and ions compared to the results of a standard R-matrix calculation.
The two available theoretical approaches do not distinguish between single, double, and triple ionization of the Ne+ ion. The quantities that can be compared are the photoabsorption cross-sections from theory and the sum of the partial cross-sections obtained by the present experiments, where, however, the channel of radiative stabilization of K-vacancy states was not observed. This is insignificant, though, since the sum of the measured cross-sections for single, double, and triple ionization is expected to be approximately 98.5% of the total photoabsorption cross-section (see the discussion in Section 3.2.2). At the same time, the systematic uncertainty of the experimental cross-sections is 15%. Figure 14 provides an overview of the theoretical and experimental photoabsorption cross-section of Ne+ in the energy range 841–920 eV. Cross-sections are plotted on a logarithmic scale so that small and large features can be seen with similar detail. The energy spread in the experiment was about 500 meV. Therefore, the theoretical data were convoluted with Gaussians of 500 meV FWHM in order to model the experimental conditions.
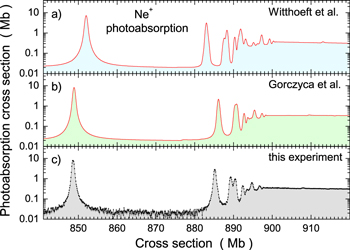
Figure 14. Cross-sections for total photoabsorption by Ne+ ions near the K edge at a photon energy bandwidth of 500 meV. Panel (a) shows the result of a calculation by Witthoeft et al. (2009); panel (b) presents the theoretical cross-section obtained by Gorczyca (2000), Juett et al. (2006), and Gatuzz et al. (2015). Both theoretical curves were convoluted with a Gaussian distribution of 500 meV FWHM in order to model the experimental conditions. Panel (c) shows the sum of the measured cross-sections for single, double, and triple ionization from Figure 8, which is expected to make up 98.5% of the total photoabsorption cross-section.
Download figure:
Standard image High-resolution imageMuch of the fine structures seen in Figure 1, mostly in the data of Witthoeft et al., is smoothed out after the convolution. Now the peak sizes in the theoretical spectra are similar to those found in the experiment, indicating that the total resonance strength in each peak is well represented by the theoretical approaches. In particular, the photoabsorption cross-section at 920 eV is approximately 0.3 Mb both in the theoretical and the experimental data. While the peaks obtained by Gorczyca (2000), Juett et al. (2006), and Gatuzz et al. (2015) line up quite well with the present experimental resonance features, there are irregular shifts in the peak positions calculated by Witthoeft et al. (2009). The reason for this may be a too small basis set in the expansion, which did not include pseudostates.
Some of the measurements on Ne+ ions were carried out with improved energy resolution as indicated already in Figure 9. The cross-section for the double ionization of Ne+ recorded at a photon energy bandwidth of 113 meV is displayed in Figure 15, where many more details are now resolved in comparison to the measurements shown in Figure 8 in panel (b). The assignments of resonance peaks are suggested on the basis of calculations with the Cowan code. The first resonance at 848.66 eV is associated with a 2S term because the  excitation fills the L shell completely so that the orbital angular momentum and the spin of the remaining K-shell electron determine the spectroscopic notation of that resonance. A second 2S term is visible at about 885.9 eV. It is associated with a
  transition. All other obvious peaks in the spectrum are predominantly of 2P character and belong to
  excitations with two Rydberg series of excited levels
  and
and  . The series limits
  and
and  have been calculated to be at 896.05, 896.15, 896.21, and 899.63 eV, respectively, using the Cowan code. They are indicated in Figure 15 by the vertical bars. These series limits are the onsets of direct removal of K-shell electrons with different final levels.

Figure 15. Experimental cross-section for double ionization of Ne+ ions at a photon energy bandwidth of 113 meV. The energy axis is interrupted between 851 and 884 eV, where no resonances occur. Assignments of levels are provided for the obvious resonances, which belong to two Rydberg series converging to series limits 3P and 1P1. The series limits were obtained by using the Cowan code and are indicated by vertical bars.
Download figure:
Standard image High-resolution imageIt is elucidating to take a closer look at the high-resolution cross-section for double ionization of Ne+ in connection with theory. The experimental data obtained at a bandwidth of 113 meV are presented in panel (c) of Figure 16. Also shown in the same figure are the appropriately convoluted theoretical photoabsorption cross-sections obtained by Witthoeft et al. (2009) in panel (a) and by Gorczyca (2000), Juett et al. (2006), and Gatuzz et al. (2015) in panel (b). While the cross-sections cannot be directly compared, the resonance positions and profiles should be identical. Much more than in the overview provided in Figure 14, differences between the theoretical approaches and the experimental results become obvious. The present figure is closely related to Figure 1, where the natural line profiles of the two theoretical results are compared with one another.
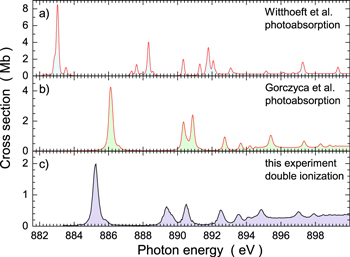
Figure 16. Cross-sections for photoabsorption by Ne+ ions at bandwidth 113 meV calculated by Witthoeft et al. (2009), panel (a), and by Gorczyca (2000), Juett et al. (2006), and Gatuzz et al. (2015), panel (b). Panel (c) shows the experimental cross-section for double ionization of Ne+ ions at 113 meV resolution. Although the theoretical and experimental cross-sections cannot directly be compared with one another, the resonances should have identical positions and profiles.
Download figure:
Standard image High-resolution imageResonance positions, resonance structures, and line shapes are quite different in the three spectra displayed in Figure 16. The detailed analysis of the strongest K-shell photoionization resonance in the context of Figure 9, which is associated with the  level, showed that the experimental energy spread of 113 meV is almost sufficient to measure the natural profiles. It is known further that the widths of resonances associated with higher principal quantum numbers n, which have a tendency to increase with n, should not differ very much from that of the first resonance. This had been suggested by King et al. (1977) and was confirmed later by several groups (see, for example, Teodorescu et al. 1993; Coreno et al. 1999; Campbell & Papp 2001). The same trend has been found in the present work for
  excitations in neutral neon. As a result of the relatively large natural widths of all resonances, the experimental spectrum should be close to the natural cross-section function. In contrast to that, the theoretical spectra feature smaller widths and the result of Witthoeft et al. (2009) especially shows quite narrow peaks. Apparently, the natural widths of the resonances with high n are underestimated by theory and especially by the model of Witthoeft et al. This is also evident from the peak sizes of the theoretical spectra. Although the theoretical resonance strengths agree with one another as well as with the experiment (see Figure 14), i.e., the convoluted cross-sections at 500 meV photon-energy bandwidth are in overall agreement, the peaks in the theoretical spectra at better resolution (113 meV bandwidth) differ in size, which can only be due to the different natural widths in the calculations. (In this context one has to keep in mind that the experimental spectrum in Figure 16 is only the cross-section for double ionization so that peak heights cannot be compared with the theoretical curves, which are for total photoabsorption).
At a higher resolution of the data presented in Figure 16, the differences in resonance energies in the calculations and in the experiment become very obvious. Again, the calculation by Witthoeft et al. agrees less with the experiment in that it provides peak positions shifted by up to several eV with respect to the experimental resonances. Clear differences are also visible in the number of peaks and their contributions to the overall picture. The comparison with the calculation by Gorczyca (2000), Juett et al. (2006), and Gatuzz et al. (2015) is much more favorable. Each single feature in the experimental cross-section is also seen in the result of the optical potential R-matrix calculations—though with small energy shifts and slightly underestimated natural widths.
As mentioned above, the present experiment was extended to energies well beyond the lowest K edges into the region where double excitation by a single photon can play a role. Figure 17 shows a comparison of the theoretical and experimental photoabsorption cross-sections at 500 meV resolution. In the energy range 904.5–920 eV, a measurement was carried out with improved statistics so that cross-section features can be seen in greater detail. The relative statistical error bars were brought down to the level of 0.65%, making excursions in the otherwise smooth cross-section for direct K-shell ionization visible, although they are of a relative size of less than 7%. At least two resonances with different Fano line profiles can be clearly distinguished. They have to be due to double excitation processes. On the basis of calculations with the Cowan code, we suggest that the two main resonances are due to the transitions  →
→  and
and  →
→  . The theoretical curves show an amazing agreement with the experiment both in the size and shape of the cross-section. The only downside in this comparison is that the spectrum of Witthoeft et al. (2009) had to be shifted by −5.1 eV, and that of Gorczyca (2000), Juett et al. (2006), and Gatuzz et al. (2015) by −1.6 eV to match the present resonance positions. The slight cross-section difference of the Gorczyca et al. result from the experiment of less than 8%, and the incredible agreement of the Witthoeft et al. spectrum with the experiment are insignificant because the systematic uncertainty of the present experimental data is 15%. It is worth noting that double ionization makes up for about 90% of the total photoabsorption in the energy range of Figure 17.
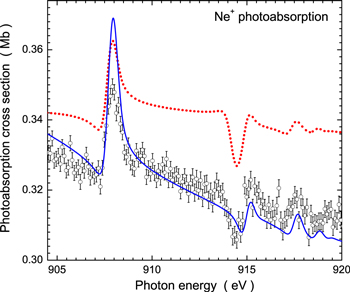
Figure 17. Detail of the experimental cross-section for photoabsorption by Ne+ ions in the energy range of the lowest-energy double excitations. For comparison, the calculations by Gorczyca (2000), Juett et al. (2006), and Gatuzz et al. (2015) (dotted line) and by Witthoeft et al. (2009) (solid line) are shown. The theoretical curves have been convoluted with a Gaussian of 500 meV FWHM in order to model the experimental conditions. The spectrum obtained by Gorczyca et al. was shifted in energy by −1.6 eV and that of Witthoeft et al. was shifted by −5.1 eV to match the positions of the two main resonance features, which are suggested to be assigned to the  and
and  levels, respectively.
Download figure:
Standard image High-resolution image
4. Summary
A photon–ion merged-beams approach has been employed to measure absolute cross-sections for single, double, and triple ionizations of Ne+ ions near the K edge. For the purpose of photon-energy calibration, high-resolution K-shell ionization spectra were measured for neutral neon by employing a dilute gas target equipped with electron detectors. The natural line widths of the  (
( ) resonances were determined at a photon energy bandwidth of only 32 meV to be 248 ± 2 meV, 260 ± 3 meV, 297 ± 5 meV, and 286 ± 9 meV, respectively. As expected, these numbers are comparable to the natural line width of 261 ± 5 meV obtained for the
  level. Theoretical predictions for this width range from 245 to 296 meV. Numerous calculations have been carried out for the excitation of the
  level, which happens to be the inverse of the
  and
and  de-excitations observable when the K shell of neutral neon is ionized. With the present study a new level of precision has been reached for the natural widths of neon atoms with a K vacancy.
Resonance energies for Ne+ were determined with uncertainties of ±0.2 eV. The limitations in the present experiment were mainly the uncertainties of the known calibration lines for neutral gases in the present energy range of interest. Obviously, experimental uncertainties of the resonance energies of such lines are often underestimated in the literature, which leads to mutually contradicting results.
Cross-section ratios of single to double to triple ionization depend on the photon energy. They indicate the branching ratios of Auger decays from different K-shell excited levels in the Ne+ ion. Since the cross-sections are absolute, the absorption oscillator strengths of individual resonantly excited levels can be derived and hence the transition probability for radiative stabilization of the excited state. For the  level, the single-electron emission yield is 0.93, the two-electron yield is 0.054, and the three-electron yield 0.002. The experimentally derived fluorescence yield is approximately 0.014 with error bars estimated to be of the order of the systematic uncertainty of cross-section measurements, i.e., about 15%.
A detailed analysis of possible mechanisms for the observed multiple-ionization channels reveals that double ionization must involve higher-order Auger decay processes in which three electrons interact simultaneously. Triple ionization is only possible if at least one four-electron Auger decay is involved.
Comparison of the experimental cross-sections with two different R-matrix calculations shows amazing agreement as well as substantial discrepancies in different parts of the cross-section functions. Substantial differences occur mainly in the positions of resonances and in the K-shell ionization thresholds. In the calculations by Witthoeft et al., the natural line widths resulting from theory are by far too small, resulting in a cross-section function that greatly deviates from the experiment at high resolution. However, that same calculation is in excellent agreement with the experimental observations in the range of double excitations beyond the K edge. The double-excitation resonances observed are associated with the  transitions from ground-term Ne+.
The statistical quality, the energy range, and the number of channels investigated in the present experiment on Ne+ are unique in the context of K-shell photoexcitation and photoionization of ions. Only a previous experiment with C+ ions (Müller et al. 2015) has provided a similarly comprehensive, high-quality set of absolute cross-section data for photon–ion interactions in the energy range around the K edge.
The experimental data allow for a clear distinction between the existing theoretical approaches, at least at energies up to the lowest K-shell ionization thresholds. For astrophysical modeling of photoabsorption by neutral Ne and Ne+ ions, precise absolute cross-section data are made available. The partial cross-sections for multiple ionizations of Ne+ making up the total absorption cross-section are useful for modeling the charge-state distribution of gases in astrophysical environments that are exposed to x-radiation.
We are grateful for several grants (contract numbers 05K10RG1, 05K10GUB, 05K16RG1, and 05K16GUC) from the Bundesministerium für Bildung und Forschung, Germany. A.L.D.K. acknowledges support by the Director, Office of Science, Office of Basic Energy Sciences, of the U.S. Department of Energy under Contract No. DE-AC02-05CH11231. We thank the P04 beamline team, Leif Glaser, Frank Scholz, and Gregor Hartmann, for their valued support. We thank Kaja Schubert, Hamburg University, for her help in some of the present measurements. We also thank Tom Gorczyca and Mike Witthoeft for helpful communications concerning the numerical data of their calculations. We are grateful to Masahiro Kato for providing the numerical data of his and his colleagues' experimental results on photoabsorption by neutral neon.