


ABSTRACT
For the X1.7 class flare on 2013 May 13 (SOL2013-05-13T01:53), its initiation process was well observed by the Atmospheric Imaging Assembly (AIA) on board the Solar Dynamic Observatory and the Extreme UltraViolet Imager (EUVI) on board STEREO-B. The initiation process incorporates the following phenomena: an X-ray precursor that started ∼9 minutes before flare onset, two hot magnetic loops (as seen with AIA hot channels) forming a sigmoidal core magnetic structure (as seen with the EUVI), a rapidly formed magnetic flux rope (MFR) that expands outward, and a flare loop that contracts inward. The two hot magnetic loops were activated after the occurrence of the X-ray precursor. After activation, magnetic reconnection occurred between the two hot magnetic loops (inside the sigmoid structure), which produced the expanding MFR and the contracting flare loop (CFL). The MFR and CFL can only be seen with AIA hot and cool channels, respectively. For this flare, the real initiation time can be regarded as being from the starting time of the precursor, and its impulsive phase started when the MFR began its fast expansion. In addition, the CFL and the growing postflare magnetic loops are different loop systems, and the CFL was the product of magnetic reconnection between sheared magnetic fields that also produced the MFR.
Export citation and abstract BibTeX RIS
1. INTRODUCTION
Solar flares come from the sudden release of free magnetic energy stored in the coronal magnetic field. However, limited by telescopes' temporal and spatial resolution, what initiates energy release for a flare is still a basic question in solar physics. It is well observed that flares are often preceded by precursors, which are transient brightenings before the onset of solar flares (Schmahl et al. 1989). Precursors are key physical processes in some flare models like the tether-cutting model, which predicts that initiation of a flare is caused by magnetic reconnection (e.g., Moore et al. 2001). Precursors have been identified in multiwavelength observations from radio to X-ray (Aurass et al. 1999; Warren & Warshall 2001; Contarino et al. 2003; Fárník et al. 2003; Chifor et al. 2007). Chifor et al. (2007) further revealed that preflare brightenings (precursors) often occur on or near the polarity inversion line. They discovered that the new flux emergence and cancelling are at the same location as that of the precursor brightenings, thus they thought that magnetic reconnection–associated brightenings probably trigger a flare's onset. However, it is still not quite clear how precursors trigger flares' onset.
One of the important phenomena associated with flares' initiation is the so-called sigmoid magnetic structure, which is a forward or reversed S-shaped emission configuration in soft X-ray (SXR) and extreme ultraviolet (EUV). A sigmoid frequently appears prior to the onset of solar flares and coronal mass injections (CMEs) (Harrison et al. 1985), and its appearance in active regions indicates a high probability of occurrence of an eruptive flare and a CME (Rust & Kumar 1996; Canfield et al. 1999; McKenzie & Canfield 2008; Liu et al. 2010). As a whole, a sigmoidal shape in hot EUV or SXR emissions is actually composed of two sheared J-shaped features (Aurass et al. 1999; Canfield et al. 1999; McKenzie & Canfield 2008; Liu et al. 2010; Cheng et al. 2014a, 2014b; Cheng & Ding 2016). It is believed that once the sheared loops become unstable, for some reasons reconnection will occur. Reconnection sometimes plays a key role in initiating solar flares, which produces a disruption of the magnetic field leading to the expulsion of a flare or CMEs. During the initiation process, a sigmoid structure is rapidly transformed into an arcade structure. However, a direct observation for the reconnection process is very rare. Meanwhile, the formation process of sigmoidal structures prior to its disruption is equally essential for understanding the initiation of a solar flare. By analyzing two different flare events (E1 and E2) with a sigmoid-shaped SXR pattern that shares a striking spatial and temporal similarity in the process of energy releasing, Aurass et al. (1999) reported that for event E1, the sigmoidal structure was formed gradually through a series of small rearrangements accompanied by energy releases observed as subflares. However, for event E2, the "true" sigmoidal structure was formed during the rising phase of the flare. With the advent of high-cadence and high-resolution data observed by the Atmospheric Imaging Assembly (AIA; Lemen et al. 2012) on board the Solar Dynamic Observatory (SDO; Pesnell et al. 2012), there is hope of making further progress in understanding the formation process of sigmoidal structures.
In the past decades, a magnetic flux rope (MFR), which is defined as a magnetic channel with a set of magnetic field lines wrapping its central axis for more than one turn, has been regarded as the fundamental structure in the initiation for a CME/flare (Titov & Démoulin 1999; Chen 2011; Vourlidas et al. 2013). Observation of MFRs dates back to in situ measurements of magnetic clouds traveling in solar wind (Burlaga et al. 1982; Klein & Burlaga 1982). Studies for their nature and their role in solar eruptive processes began about half a century ago (e.g., Chen 1989; Vršnak 1990, 2008; Schmieder et al. 2015), including even direct imaging of helical magnetic field structures in Hα prominences (e.g., Vršnak et al. 1991) and by coronagraphs (e.g., Dere et al. 1999). MFRs are usually unstable, and kink and torus instability will cause them to erupt eventually (Török & Kliem 2005; Kliem & Török 2006). Recently, through intensive high-resolution multitemperature observations made by AIA on board SDO, MFRs are observed as a hot channel in the higher-temperature passbands (131 and 94 Å) during a solar eruption (Cheng et al. 2011; Zhang et al. 2012), and their counterparts in the lower-temperature passbands (e.g., 171 and 193 Å) are located in a so-called dark cavity as previously defined in the literature (e.g., Khan et al. 1998; Hudson et al. 1999; Maričić et al. 2004; Forland et al. 2013). The appearance of MFRs is regarded as a new initiation phenomenon preceding an eruptive flare and CME. Where and how an MFR is formed are still controversial items. Some authors think that an MFR was there as a sigmoidal structure prior to the onset of solar eruptions and then was transformed toward a semicircular shape during its eruption (Zhang et al. 2012). Other observations have shown that an MFR was the result of reconnection between two opposite J-shaped loops (Aurass et al. 1999; Liu et al. 2010; Green et al. 2011; Cheng et al. 2014a). More detailed studies for this problem are needed.
In recent decades, it was discovered that flaring loops display a kind of contraction motion at the initial phase of solar flares (Ji et al. 2004, 2006; Li & Gan 2005; Veronig et al. 2006; Vršnak et al. 2006; Joshi et al. 2007). During the contraction, flare footpoints have a converging and unshearing motion (Zhou et al. 2008, 2013) and loop-top X-ray sources at different energy bands are mixed together (Shen et al. 2008). Basically, a standard 2D magnetic reconnection model that includes a collapsing magnetic trap can reproduce the contracting flaring loops (CFLs). In the 3D case, magnetic reconnection occurs between or inside twisted magnetic flux tubes (Ji et al. 2007), and this kind of reconnection results in a sigmoid structure, shown in SXRs or even hard X-rays, and in an unshearing motion (Ji et al. 2008). Since the CFLs are related to the rising phase of flares, their role in the initiation of solar flares needs to be investigated.
In this paper, we report the initiation processes for the X1.7 class flare on 2013 May 13 (SOL2013-05-13T01:53). For this flare, an erupting MFR was revealed at hot passbands of AIA, and we find that it was produced by reconnection between two hot magnetic loops. The reconnection was actually activated by an X-ray precursor that started ∼9 minutes before onset of the flare. Meanwhile, a CFL was formed during the reconnection process.
In Section 2, we give a brief description for the data analyzed in this paper. Results are presented in Section 3, followed by a summary and discussion in Section 4.
2. OBSERVATION AND DATA ANALYSIS
The X-class flare occurred on 2013 May 13 in the active region of NOAA 11748, starting at 01:53 UT. It is a partially occulted flare with its footpoint hidden behind the solar limb as seen from the Earth's perspective. It was well observed by AIA on board SDO, as well as by the EUV Imager on board STEREO-B (EUVI; Wuelser et al. 2004; Howard et al. 2008). The AIA images take seven EUV and two UV passbands (at temperatures ranging from 0.06 to 20 MK) with a temporal cadence of 12 or 24 s and a spatial resolution of 1.2 arcsec. For this event, we used the AIA 131 Å as well as 94 Å to trace the hot coronal plasma during the flare initiation. Their emission comes from plasma with a higher temperature, and the two lines are especially selected for observation of flares and/or active regions (Fe xx; log T = 7.1 for 131 Å and Fe xviii; log T = 6.8 for 94 Å). Meanwhile, we used the 171 Å (Fe ix; log T = 5.8) and 304 Å (He ii; log T = 4.7) images to give a picture for cooler flaring loops. At the time of flare eruption, STEREO-B was located 141 59 from the Sun–Earth line. Therefore, the EUVI images observed the solar flare as a disk event. The flare was also well covered by RHESSI (Lin et al. 2002). We use the Clean algorithm (Hurford et al. 2002) with grids 3–8 to reconstruct the X-ray images in the energy bands at 6–9 keV to locate the energy release site. In this paper, as the title indicates, we report the initiation processes of the flare, starting from the precursor (∼01:44 UT) and ending at the onset of the flare's impulsive phase (01:56 UT).
3. RESULTS
The upper panel of Figure 1 gives the time profiles of the X-ray flux as observed by GOES and RHESSI during the period of 01:40–02:30 UT. According to the normal definition, the flare begins at 01:53 UT. From the light curves of GOES 0.4–5 Å and the RHESSI 3–6, 6–12, and 12–25 keV energy bands, we can see a precursor that began at ∼01:44 UT, nine minutes before the onset of the flare. The precursor also has its very weak response in GOES 1–8 Å. It is worth noting that the enhanced X-ray emission after the precursor does not decay to the background level before the flare; this is very obvious from the GOES 0.4–5 Å light curve. In other words, we see that the precursor continuously evolves into the flare phase.
Figure 1. Upper panel: Time profiles of the X-ray flux as observed by GOES and RHESSI (01:40–02:30 UT). Red and blue lines are for GOES 0.5–4 and 1–8 Å, and black lines are for RHESSI 3–6, 6–12, 12–25, and 25–50 keV, respectively (from top to bottom). Three vertical dotted lines indicate the starting time of the precursor (∼01:44), the flare (∼01:53), and the flare's impulsive phase (∼01:56:00). Middle panels: A sequence of SDO/AIA 131 Å images shows the development of the precursor and the simultaneous activation of the two overlying magnetic loops. Lower panels: Same as the middle panels but with a sequence of base-difference 131 Å images (based image at 01:40:10 UT). The images starting from the second column are overlaid with the 90% contour of a single coronal X-ray source at the 6–9 keV energy band. Please note the shifting of the RHESSI X-ray source to the intersection of the two hot loops. The timing for the images is denoted in the upper panel with five vertical black bars, while the bars in red and blue are for the timing of AIA base-difference images in Figure 3.
(An animation of this figure is available.)
Download figure:
Video Standard image High-resolution imageThe development of the precursor as observed at SDO/AIA 131 Å is given in the middle and lower panels of Figure 1. We can see that the precursor has raised above the limb as a small brightening point. A single RHESSI X-ray source is cospatial with the 131 Å brightening during the precursor. Accompanied with the X-ray precursor, two overlying loops become brightened. They are only visible in the AIA higher-temperature passbands (131 and 94 Å) but not in other cooler channels, implying that the plasma is very hot. After 01:47 UT, with the brightening of the two hot magnetic loops, the X-ray source begins to shift its position upward. At ∼01:52 UT, we can see that the X-ray source is located about 10 arcsec above its original site. Note that the X-ray source is very near the intersection site of the two hot loops. Meanwhile, we find that not only does the X-ray emission not decay, but neither do the two hot EUV magnetic loops, which become even brighter after the precursor (for the detailed process, see the online animated Figure 1).
The overall configuration of the active region of NOAA 11748 and the context of the two hot EUV loops inside it can be found from the EUVI's observation (Figure 2). The right two panels in Figure 2 show the EUVI's observation at the 195 Å passband (Fe xii, T = 1.5 MK). Prior to the eruption, the most obvious feature is that the overall configuration of the active region is inverse-S-shaped. We can see that the EUV brightening is located in the core region, appearing as a sigmoidal structure. Since the cadence of STEREO-B's observation is quite low, we cannot follow a detailed evolution of the core hot loops. Nevertheless, we find that the flare's initial brightening occurs in the middle of the sheared core magnetic loops. This is in agreement with the results given in Figure 1.

Figure 2. The left panel shows the interaction of the two activated hot magnetic loops as observed by AIA 131 Å, and the right two panels give the overall configuration of the active region observed by EUVI 195 Å. All three images are overlaid with the same set of the Sun's longitudinal and latitudinal grids. From the EUVI images, we can clearly see the sigmoidal core magnetic field. All three red arrows point to the initial brightening place after the starting time of the precursor. The black line in the left panel shows the position of a slit used for making the time-space image given in Figure 4.
Download figure:
Standard image High-resolution imageFollowing the definition of Cheng et al. (2011) and Zhang et al. (2012), an erupting MFR was rapidly formed after the precursor phase. In Figure 3, a sequence of base-difference images (based image at 01:52:10 UT) at 131 Å observed by AIA shows the formation of the MFR and its final eruption (for the detailed process, see the online animated Figure 3). From Figure 1, we have seen that the precursor activated two overlying magnetic loops before the onset of flare. In Figure 3, we can see that the two intersected hot loops undergo a series of topological reconfiguration, leading to an expanding MFR and a CFL. The topological reconfiguration was very probably caused by magnetic reconnection of the two hot EUV loops. To show our speculation clearly, the two magnetic hot loops at 01:52:10 UT (panel (a1)) are outlined with two arch-shaped red lines to show the topological changes. A number of red arrows point out the slow formation process of the expanding MFR. At the beginning of the figure, a progenitor of the MFR is formed around the intersection part between the two hot magnetic loops, around which the single hard X-ray coronal source is also located.
Figure 3. A sequence of base-difference images (based image at 01:52:10 UT) at 131 Å observed by AIA showing the formation and eruption of the MFR from the magnetic reconnection of the two activated magnetic loops. For readers' visual clarity, the two magnetic hot loops at 01:52:10 UT (panel (a1)) are outlined with two arch-shaped red lines. A series of red arrows is added to point out the slow formation process of the MFR after the activation (from 01:52:56 to 01:55:44 UT). All images, except for panels (a1), (a3), and (e5) (for clarity reasons), are overlaid with the 90% contour of the single RHESSI X-ray source at the 6–9 keV energy band. At ∼01:54:55 UT (panel (a3)), the two intersected magnetic loops evolve into an MFR, which an arrow points toward, and a separated flaring loop, which is outlined by a red arch line. The red arch line in panel (a3) is the lower part of the two red arches in panel (a1). It is also drawn in panel (e5) to show the contraction of the flaring loop. The timing for these images is denoted in the upper panel of Figure 1 with red and blue bars.
(An animation of this figure is available.)
Download figure:
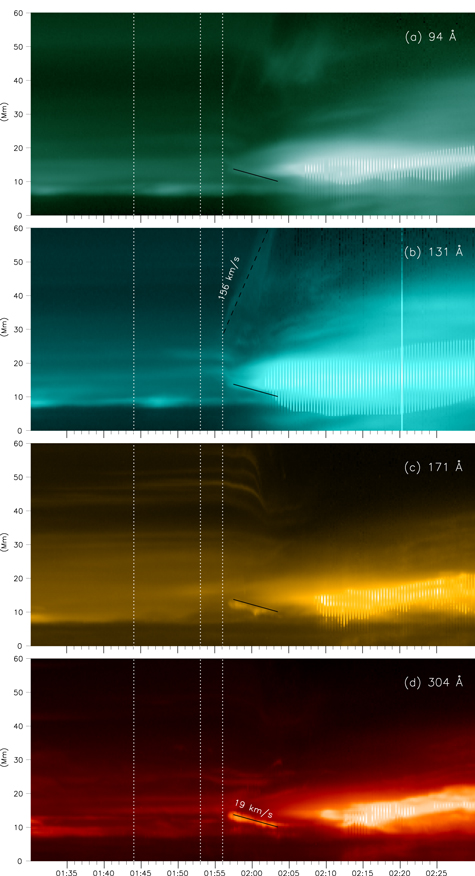
Video Standard image High-resolution imageThe outer part of the two intersected loops develops into a semicircular structure, and the inner part develops into a lower separated flaring loop (panel (e5)). At ∼01:56 UT, the MFR starts to erupt, reaching a speed of ∼156 km s−1; meanwhile, the lower flaring loop begins its contraction at a speed of ∼19 km s−1 (also see Figure 4). We find that this moment corresponds to the onset of the flare impulsive phase, which is marked by the appearance and rapid enhancement of a hard X-ray emission (≥25 keV, see Figure 1). After ∼01:57 UT, the two hot magnetic loops disappear, being completely converted into the expanding MFR and the CFL.
Figure 4. The space-time diagrams obtained by staking (a) 94, (b) 131, (c) 171, and (d) 304 Å intensity images along the slit shown in the left panel of Figure 2. As in Figure 1, three vertical dotted lines indicate the starting time of the precursor (∼01:44 UT), the flare (∼01:53 UT), and the flare's impulsive phase (∼01:56 UT).We can see that the contraction of the flaring loop begins at the same time as the fast eruption of the MFR. Meanwhile, from the 171 to the 304 Å diagrams, we can see that the CFL is actually separated from the expanding postflare loops. The two sloping lines are in the same position, and the slope gives the contracting speed as 19 km s−1. Note that the CFL's high-temperature component (171 Å) is obviously below its low-temperature (304 Å) counterpart.
Download figure:
Standard image High-resolution image
To show the kinematics of the MFR and the flaring loop, we take four spacetime diagrams obtained by staking 94, 131, 171, and 304 Å intensity images along a slit shown in the left panel of Figure 2 (the eruption direction of the MFR). Figures 4(a) and (b) show the staking images in the 94 and 131 Å passbands, from which we can see that the MFR begins its fast eruption at around 01:56 UT. The CFL begins its descending at the same time as the fast eruption of the MFR. It is worth noting that the CFL is obvious only in the cooler AIA passbands (e.g., 171 Å, 304 Å and even 1600 Å), which is in contrast with the fact that the erupting MFR is observable only in the hot AIA passbands (131 and 94 Å). The contraction of the flaring loop lasts for about seven minutes and then the postflare loops begin to grow at ∼02:04 UT. From the 171 to 304 Å diagrams, we can see that the CFL is actually detached from the growing postflare loops. In addition, the 171 Å CFL is lower than its 304 Å counterpart, indicating a cooling of the contracting loops.
4. SUMMARY AND DISCUSSION
In this paper, we report the well-observed initiation process for the 2013 May 13 X1.7 partially occulted flare through analyzing space observations made by SDO/AIA, STEREO-B/EUVI, and RHESSI. In studying this event, a number of initiation processes, which have usually been separately reported and analyzed in the literature, can be understood in a comprehensive way. They include an X-ray precursor, a sigmoidal structure, an erupting MFR and its formation, and a CFL. An overall picture can be summarized as following: two magnetic loops are heated or activated with the occurrence of the X-ray precursor, and the heated magnetic loops constitute the inner core sigmoidal magnetic structure of the active region. Magnetic reconnection occurs between the two hot magnetic loops or inside the core sigmoidal magnetic structure, giving rise to an erupting MFR and a CFL. The flare's impulsive phase begins when the MFR starts to erupt. Therefore, the flare's initiation period can be defined as being between the starting time of the precursor and the starting time of the impulsive phase. In addition, the real onset time for this flare can be taken as the starting time of the precursor, since the precursor did not decay. A similar case can be found in a recent paper by Li et al. (2016), who reported that quasi-periodic slipping magnetic reconnection occurs along the flux rope–related quasi-separatrix layers (QSLs) in the preflare stage (precursor), which drives the later eruption of the flux rope and an associated flare. QSLs are defined as 3D magnetic volumes with very sharp gradients of magnetic field connectivity (e.g., Démoulin et al. 1996). For that event, the precursor also directly develops into subsequent flaring.
Compared with the two events (E1 and E2) studied by Aurass et al. (1999), we find that this event shares partial similarity with both events reported in their work. Regarding the formation process of an unstable sigmoidal magnetic structure, the event reported here first looks similar to event E1. For event E1, the sigmoidal structure was formed gradually through a series of small rearrangements accompanied by energy releases observed as subflares. It stayed there for several hours before its eruption. For this event, the unstable sigmoidal structure (seen as hot EUV channels) was formed during a microflare (precursor). Its eruption occurred ∼9 minutes later. In fact, as in the events studied by Aurass et al. (1999), the precursor represents a confined flare that generated an unstable structure that erupted after being formed. This may give rise to a new term—"waiting time." In this way, event E2 studied by Aurass et al. (1999) can be regarded as a case of zero waiting time: the formed sigmoidal structure was extremely unstable and exploded immediately as an eruptive two-ribbon flare. In this regard, the flare analyzed in this paper lies between events E1 and E2. With high-cadence and high-resolution multitemperature space observations, the new finding of this paper is that magnetic reconnection plays an essential role for destabilizing the sigmoidal structure. The signatures for magnetic reconnection look obvious: a topological change that gives rise to a hot erupting flux rope, a cool CFL, and a single coronal X-ray source around the intersection of the two apparent hot EUV channels.
For the first time, we link a CFL with the production of an MFR. Previously, CFLs and expanding postflare loops were regarded as the same set of magnetic loops, which contract first and expand later. In addition, CFLs reported in the literature are hot X-ray-emitting loops: they are generally interpreted as collapsing magnetic traps in the framework of a 2D magnetic reconnection (Veronig et al. 2006) and being accompanied with an unshearing motion if we add the third dimension (Ji et al. 2006, 2007, 2008). For this event, we know that the CFL is one of the two products of magnetic reconnection between two sheared magnetic loops; that is different from postflare loops, which are caused by a reconnection between the magnetic field lines being stretched up by an erupting MFR. It is a unique case that needs further investigation, and it is not necessarily applicable to the majority of eruptive flares. A question raised here is why the temperature of the CFL is much lower than that of the erupting MFR, considering that they are both products of a magnetic reconnection.
A further question is how the overlying magnetic loops are activated with the occurrence of a precursor, being led to reconnect. The reconnection scenario looks very similar to the tether-cutting model (Moore et al. 2001), but it has one difference: in this event, the reconnecting magnetic loops are very hot. A similar case is the hard X-ray sigmoidal structure observed by RHESSI for a strong X-ray-class flare (Ji et al. 2008). The EUVI on STEREO-B observes that the two hot magnetic loops form a sigmoidal core magnetic field of the active region, which is supposed to be composed of two groups of J-shaped sheared loops lying along a magnetic polarity inversion line. Aurass et al. (1999) and Cheng et al. (2015) proposed that magnetic reconnection has played a role in transforming part of J-sheared loops into an MFR before the eruption of a flare. According to a statistical study from Chifor et al. (2007), X-ray precursors usually occur along polarity inversion lines. The heating process may be associated with the enhancement of electric current, which will cause anomalous resistivity (Sagdeev 1967).
The authors would like to thank the anonymous referee for helping to improve the quality of the paper. SDO is a project of NASA. This work was supported by the West Light Foundation CAS grant no. XBBS201323 and by the Strategic Priority Research Program—The Emergence of Cosmological Structures of the Chinese Academy of Sciences, grant no. XDB09000000. This work was also supported by NSFC grants (nos. 11403087, 11333009, and 11673055) and by the CAS Key Laboratory of Solar Activity, National Astronomical Observatories. In the end, Haisheng Ji would like to thank the Talent Importing Program offered by the government of Xinjiang Uygur Autonomous Region.