


ABSTRACT
The primary astrophysical source of the rare-earth elements is the rapid neutron capture process (r process). The rare-earth peak that is seen in the solar r-process residuals has been proposed to originate as a pile-up of nuclei during the end of the r process. We introduce a new method utilizing Monte Carlo studies of nuclear masses in the rare-earth region, that includes self-consistently adjusting β-decay rates and neutron capture rates, to find the mass surfaces necessary for the formation of the rare-earth peak. We demonstrate our method with two types of astrophysical scenario, one corresponding to conditions typical of hot winds from core-collapse supernovae and stellar-mass accretion disks, and one corresponding to conditions typical of the ejection of the material from the tidal tails of neutron star mergers. In each type of astrophysical condition, this method successfully locates a region of enhanced stability in the mass surface that is responsible for the rare-earth peak. For each scenario, we find that the change in the mass surface has qualitatively different features, thus future measurements can shed light on the type of environment in which the r process occurred.
Export citation and abstract BibTeX RIS
1. INTRODUCTION
The majority of the solar system rare-earth elemental abundances are attributed to the rapid neutron capture process of nucleosynthesis (r process) (Burbidge et al. 1957). Observational evidence suggests that r-process nuclei are formed in at least two separate ways (Wasserburg et al. 1996; Sneden et al. 2008), sometimes called a weak r process and a main r process. The main r process is what forms the rare-earth elements, creating the peak at around A = 165 shown in Figure 1. The astrophysical location of the main r process has remained a mystery, despite numerous proposed sites; see reviews by Arnould et al. (2007), Thielemann et al. (2011), Mumpower et al. (2016) and references therein.

Figure 1. Simulations of the r process with no rare-earth peak in hot (red solid line) and very neutron-rich cold (green dashed line) conditions compared to the solar r-process residuals from Arnould et al. (2007; black points).
Download figure:
Standard image High-resolution imageEarly on it was shown that an r process that proceeds with an equilibrium established between neutron captures and photodissociations, (n, γ)–(γ, n) equilibrium, could produce an abundance pattern roughly matching the observed solar residuals. Supernovae were considered natural places to look for the required high temperatures (T ∼ 1–2 GK) and neutron densities (nn ∼ 1022–25 g cm−3); in the 90s studies by Meyer et al. (1992), Woosley et al. (1994) identified the supernova neutrino-driven wind as an attractive possibility. Additional support for a supernova site came from spectroscopic observations of stars in the Milky Way halo. The level and scatter in r-process enhancements found at low metallicity seemed most comfortably reproduced in galactic chemical evolution simulations assuming an early-onset source (Argast et al. 2004). However, so far self-consistent models of the supernova neutrino-driven wind (Fischer et al. 2010; Hüdepohl et al. 2010; Roberts et al. 2012; Martínez-Pinedo et al. 2014), in the absence of additional physics such as sterile neutrino oscillations (McLaughlin et al. 1999), do not quite make up the entire pattern. Other proposed sites that could host a hot, (n, γ)–(γ, n) equilibrium r-process include heated outflows from stellar-mass accretion disks, e.g., Metzger et al. (2008), and MHD jets from rare supernovae, e.g., Winteler et al. (2012).
The challenges of the supernova site combined with recent astrophysical evidence (Berger et al. 2013; Ji et al. 2016) suggest instead that the source of r-process elements could be linked to compact object mergers. Within mergers there are several nucleosynthetic sites, but the ejecta from the tidal tails is the most favorable site for a main r process because it is a very neutron-rich environment and therefore guaranteed to make the even the heaviest r-process elements (Lattimer & Schramm 1974; Meyer 1989). In addition, it is considered a "robust" environment because it tends to produce a very similar pattern of abundances from the second peak up until the actinides (Goriely et al. 2011; Rosswog et al. 2014; Wanajo et al. 2014; Just et al. 2015; Mendoza-Temis et al. 2015). This similarity in the pattern is observed in metal-poor halo stars (Sneden et al. 2008; Roederer et al. 2016). Whether or not galactic chemical evolution studies that assume a merger r-process source can correctly predict the degree of scatter between stars in the overall level of r-process elements is currently under study (Ishimaru et al. 2015; Matteucci et al. 2015; Wehmeyer et al. 2015).
A tidal tail merger r process differs considerably from the classic hot (n, γ)–(γ, n) equilibrium r process. It is expected to be much more neutron-rich and colder, such that (n, γ)–(γ, n) equilibrium, if it is established at all, will fail due to a drop in temperature rather than an exhaustion of available neutrons, as expected for a classic hot r process. These differences should be discernible in the details of the final abundance pattern produced.
The features seen in the r-process pattern arise from the interplay of nuclear masses, β-decay rates and neutron capture rates with the astrophysical temperature and density conditions as well as their gradients. The primary proposed mechanism by which the rare-earth peak forms is through a dynamical process involving neutron capture at the late stages of the r process when the nuclei decay back to stability (Surman et al. 1997; Mumpower et al. 2012a). In this scenario, a feature exists in the neutron separation energies or neutron capture rates which "hangs up" the nuclei in the rare-earth region. Other places in the r process where material becomes "hung up" occur at closed neutron shells (Arcones & Bertsch 2012) and correspond to the main r-process peaks (the second main peak at A = 130 and the third main peak at A = 195 can be seen in Figure 1). In these cases, a nuclear structure feature exists in stable nuclei and is assumed to extend into the region off of stability. In contrast, in the rare-earth region no such feature is seen in the stable nuclei. In order to confirm the theory of the dynamical formation mechanism, one needs to experimentally examine nuclei which are approximately 10 to 15 units in neutron number away from stability (Mumpower et al. 2012b).
Some of the theoretical mass models commonly used in r-process calculations predict a nuclear physics feature away from stability that leads to dynamical rare-earth peak formation, e.g., Möller et al. (1995), though the peak is not always of the correct size and shape to match the solar pattern. Other mass models, e.g., Goriely et al. (2013a), show no such feature. Carefully chosen linear combinations of astrophysical conditions have been shown to improve the fit to observation (Kratz et al. 2014). An alternate formation mechanism has been proposed that suggests the rare-earth peak is made up of fission fragments resulting from a vigorous fission recycling r process (Schramm & Fowler 1971). This mechanism hinges upon a specific distribution of fission daughter products (Goriely et al. 2013b) that is untestable by experiment. Thus, it can only be supported by indirect evidence, including the elimination of the dynamical mechanism as a viable alternative.
In this manuscript, we introduce a new method by which the nuclear structure features that are necessary to produce characteristics of the r-process abundance pattern are determined by a Monte Carlo analysis. We apply this procedure to the portion of the isotopic solar abundances that includes the rare-earth region, and we search for a persistent, non-local feature in the mass surface that leads to dynamical rare-earth peak formation matching the solar pattern.
2. MASS SURFACE MODELING
There are two generic types of thermodynamic conditions that could exist toward the end of the r process. We define "hot" environments as those where the material stays in  equilibrium until the neutron number is no longer sufficiently high to maintain this equilibrium and "cold" environments as those where the equilibrium is broken because the temperature becomes too low. Hot environments include the standard supernova neutrino wind, winds from accretion disks around stellar-mass black holes or from neutron stars, and possibly supernova MHD outflows, whereas the ejection of material from the tidal tails of neutron star mergers is both cold and very neutron rich. We apply our Monte Carlo procedure to both types of environments.
As few mass measurements currently exist in the region in which we are interested, we require a theoretical baseline mass model. For our baseline model, we choose Duflo–Zuker (DZ; Duflo & Zuker 1995) since it has little structure in the masses away from stability in the rare-earth region. To verify this, we use the DZ mass model to compute neutron capture and beta decay rates and then run a set of r-process simulations for different astrophysical conditions. The neutron capture rates are computed using CoH (Kawano et al. 2016), an implementation of Hauser–Feshbach similar to the commonly used TALYS (Goriely et al. 2008) and NONSMOKER (Rauscher & Thielemann 2000); when the same set of nuclear masses is assumed, CoH produces output in the rare-earth region generally within a factor of 3 of TALYS/NONSMOKER. For the β-decay rates, we use the underlying Gamow–Teller β-decay strength function, i.e., the nuclear matrix element information, from Möller et al. (2003). We compute the phase space factor to be consistent with the DZ masses, as in Mumpower et al. (2015). Our treatment of fission is largely schematic, as in Beun et al. (2008), with spontaneous fission set to occur for A > 240 and a simple asymmetric split assumed for the fission daughter product distributions. This allows us to explore scenarios with fission recycling where the fission fragments (A ∼ 130) do not contribute to rare-earth peak formation. Examples of the results of r-process simulations with this set of nuclear data are shown by the red and green curves in Figure 1 for a hot and a cold, very neutron-rich scenario, respectively. As expected the abundance pattern shows no feature in the rare-earth region. This suggests the DZ mass model is missing the ingredient that leads to dynamical rare-earth peak formation.
Since we have a baseline model without structure in the rare-earth region we are free to determine the missing component of the mass model which is required to match the r-process residuals. Previous studies have suggested that a kink in the separation energies as a function of neutron number is required (Surman et al. 1997; Mumpower et al. 2012a), but we wish to start with as little preconceived notion as possible about what this structure should be. Therefore, instead of choosing a parameterized form for a kink structure, we let an additional mass term float freely in neutron number, N:

Here, M(Z, N) is the new mass generated from the baseline DZ mass, MDZ(Z, N), where Z and N represent the number of protons and neutrons in the nucleus. The aN are coefficients, one for each set of isotones with neutron number spanning the range from 95 to 115. For a given neutron number, aN controls the overall magnitude and sign of the change to the base model. The parameter C controls the center of the strength in proton number, and f sets the falloff strength in Z. The latter we keep fixed at f = 40 because we are looking for a persistent feature in the mass surface.
We now proceed to determine the aN and C using the Metropolis algorithm (Metropolis et al. 1953). In brief, our procedure works as follows. As our initial guess we take all the aN = 0 and C = 60, since 60 is roughly the center of the rare-earth peak in proton number for a typical late-time r-process path. With each change in mass we calculate self-consistently neutron capture rates and β-decay rates as previously described and we perform an r-process simulation, comparing the output to the r-process residuals. We then choose new values for the aN and C and repeat. At each step the parameters aN are chosen from a normal distribution centered at the current value with a spread of 0.025 MeV, and the parameter C is chosen from a normal distribution with spread 0.1.
The current values of the parameters are updated in accordance with the Metropolis prescription. The likelihood function is calculated using the chi-square match of the current step's calculated abundance pattern to that of the solar isotopic residuals. The summation in the computation of the chi-square runs from A = 150 to A = 180 and the assumed uncertainty of the rare-earth abundances is 0.1 dex. We calculate the acceptance of a particular step using a ratio of the likelihood function of the current step to the previous step. If the acceptance ratio is greater than unity, the candidate step is more likely than the previous step so we accept the step and update the parameters to the values of the current step. If the acceptance ratio is less than unity, the candidate step is taken as successful with probability equal to the aforementioned ratio. Otherwise, the step is rejected and the parameters are reset back to those defined by the last successful step.
This procedure is repeated many times until we achieve convergence. In addition to the computation of the likelihood function at the end of every Monte Carlo step, we also calculate the running averages of each parameter. We adopt the commonly used convergence criterion that the running averages of all the parameters are within their respective standard deviations. We find that our Monte Carlo runs take roughly 10,000–30,000 steps to converge for each astrophysical trajectory considered. When the algorithm is close to maximum likelihood the successful steps are averaged over many times thus making them more important than the starting points. We find that Monte Carlo parameters that have a large impact on the formation of the rare-earth peak have relatively small variance, while those that do not show larger variation with a final mean value near the original parameter value.
The application of our algorithm produces final values of the Monte Carlo parameters with an estimation of the uncertainty, as shown in Figure 2. In this figure we show the kernel density estimation for select Monte Carlo parameters using two astrophysical trajectories. A clear distinction between the resultant parameter spaces can be seen in the three panels for most of the parameters. For some parameters, the two simulations have similar final values within the uncertainty, as is the case for a102 in the second panel and the value of C in the third panel.
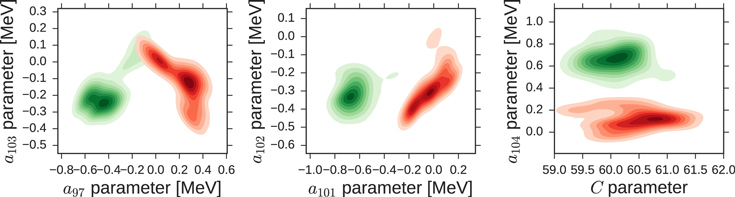
Figure 2. Kernel density estimation (KDE) of several Monte Carlo parameters of Equation (1) for two astrophysical conditions. The converged parameter space in the case of a hot r process is colored red, and the very neutron-rich cold scenario is green. The darker shading of the contours indicates a more likely parameter value with each shade representing a 0.05 increase in the value of the KDE. The white region represents parameter space where the KDE is smaller than 0.1.
Download figure:
Standard image High-resolution image3. RESULTS FOR TWO TYPES OF ASTROPHYSICAL ENVIRONMENTS
In Figure 3 we display the calculated final r-process abundances using the new predictions of nuclear masses in the rare-earth region from the application of our framework to two types of astrophysical conditions. The astrophysical conditions of potential r-process environments are under constant study, so we focus on two broad categories of conditions and choose reasonable variations within these categories. The hot conditions used are parameterized winds all with long duration  equilibrium having entropies 30, 200, and 110 in units of kB/baryon with timescales 70, 80, and 160 in units of ms and electron fractions 0.2, 0.3, and 0.2, respectively (Mumpower et al. 2012a). The high entropy trajectories are consistent with the hydrodynamics expected for the neutrino-driven wind, though we employ lower electron fractions than typically found in detailed models. The low entropy conditions are similar to those of accretion disk winds with the expected values of Ye. The very neutron-rich, cold conditions used are merger tidal tail ejecta trajectories from the simulations of Goriely et al. (2011) and Just et al. (2015).
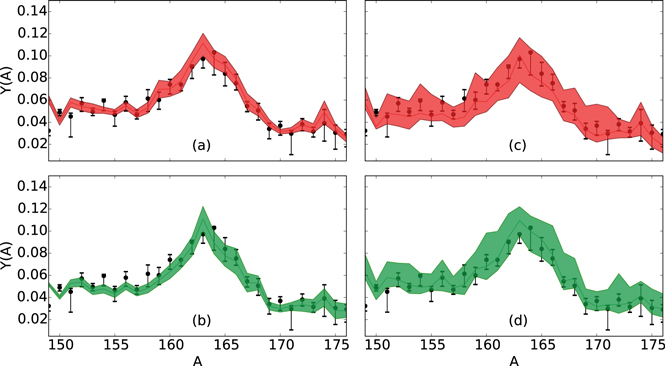
Figure 3. Final rare-earth peak abundances for a single hot [S = 30 kB/baryon, 70 ms, Ye = 0.20] (a) and very neutron-rich, cold (Goriely et al. 2011) (b) r-process trajectory compared to solar r-process residuals from Arnould et al. (2007; black points). The final abundance uncertainties, denoted by the shaded regions, originate from the predictions in the mass surface and represent the standard deviation from the Markov chain after application of the Metropolis algorithm. A superposition of astrophysical hot (c) and very neutron-rich, cold (d) r-process conditions are shown in the right panels. The final shaded regions in this case indicate an additional uncertainty which comes from the possible variation in similar astrophysical conditions in an r-process event.
Download figure:
Standard image High-resolution imageThe left two panels (a) and (b) of Figure 3 show results for two individual trajectories, where the width of the shaded bands indicates the standard deviation resulting from the Metropolis algorithm. To obtain the error bands in the left two panels we follow the same computational procedure as the running average for the Monte Carlo parameters. Success steps are added to the abundance array history per value of A, while in the case of failures, the Y(A) of the last successful step is appended instead. This procedure encodes the Markov chain history into the abundance array. We finally compute the error bands by taking the standard deviation of this multidimensional array for each value of A. The shaded bands fall within the error ranges of almost all of the solar residual data showing the success of our algorithm.
To construct the abundance patterns shown in the right panels (c) and (d) of Figure 3 we compute the averages and standard deviations for multiple Metropolis algorithm runs, with the averaging performed separately for hot and very neutron-rich, cold trajectories. This ensures we have sufficient statistics and that we draw general conclusions which are not based on particular details of a single trajectory. The error bands are larger for the right panels due to the variation found in averaging the results of similar astrophysical conditions.
We use the results of our calculations to examine more closely the dynamical formation mechanism of the rare-earth peak predicted by the algorithm for hot and very neutron-rich, cold scenarios. Three stages in the evolution of the rare-earth peak are depicted for both types of scenarios in Figure 4, hot in the top set of panels, and very neutron-rich and cold in the bottom set. In the hot calculation there is little sign of the rare-earth peak during the majority of the r process (left panel), but as the rare-earth peak begins to form during the late stages (middle panel) it forms in the same mass number region as the peak in the r-process residuals. In contrast, when the rare-earth peak first forms in the cold scenario (bottom middle panel), it forms at slightly lower mass number than the r-process residuals and it is late-time neutron capture that moves the peak to its correct position (bottom right panel).

Figure 4. Evolution and formation of the rare-earth peak via the dynamical neutron capture mechanism in a hot (top panel) and a very neutron-rich, cold (bottom panel) r process. Snapshots show the break from  equilibrium (left), the start of peak formation (center), and the final abundances (right).
Download figure:
Standard image High-resolution imageBecause we observe that the rare-earth peak forms differently in hot and very neutron-rich, cold scenarios, as shown in Figure 4, we anticipate that the required structure in the mass surface is different for different astrophysical conditions. We investigate this by looking at the modifications to the DZ masses which correspond to Figure 3. These are shown by shaded bands in Figure 5.

Figure 5. Differences in mass data sets from Duflo–Zuker along the Z = 60 (Nd) isotopic chain. The shaded regions show the predicted change to the Duflo–Zuker mass surface using the Monte Carlo technique from this paper for a hot (red) and very neutron-rich, cold (green) r-process. Points show experimental data from the latest Atomic Mass Evaluation Audi et al. (2012). Note peak formation depends on trends in the mass surface, not the absolute values of the masses.
Download figure:
Standard image High-resolution image
In the top panel of Figure 5 we show the result for hot scenarios and in the bottom panel we show the result for very neutron-rich, cold scenarios along the Z = 60 (neodymium) isotopic chain. The most striking feature of this figure is that in both types of astrophysical conditions a dip in this curve in the general region of N = 100 is required. The dip represents a region that has enhanced stability, allowing material to be hung up when the r-process path passes through it. Thus, this feature is primarily responsible for the formation of the rare-earth peak.
A second important observation from this figure is that the shape of these two curves is different for the two distinct sets of astrophysical conditions, both in the depth of the dip and in its location. Under hot r-process conditions the relative minimum is relatively shallow; the highest to lowest points span no more than 1 MeV. The shape of the curve under very neutron-rich, cold conditions shows a larger range in the mass differences with a span of over 1 MeV between the highest and lowest points.
The position of the local minimums relative to the DZ masses also differs. For hot conditions, the minimum is around N = 100, 102, and 104. For cold scenarios, it is shifted to lower N, consistent with an initial formation of the peak at lower mass number A. In these scenarios, the minimum of the mass surface relative to DZ is around N = 97, 99, and 101. This propensity of the system to favor even neutron numbers in hot scenarios and odd neutron numbers in cold scenarios is connected to the formation mechanism. For hot conditions, in which  equilibrium persists for long times, the material tends to collect in even masses (Surman et al. 1997). But for cold scenarios, neutron capture rates are most important, thus favoring odd masses (Mumpower et al. 2012a, 2012b). A second strong feature is seen at N = 110 for very neutron-rich, cold scenarios. We find this feature to be required to fill in the hole to the right of the rare-earth peak that exists in our baseline model, shown in Figure 1.
We set out to find a global feature in the masses, slowly varying in Z, and so we kept the falloff parameter f at a fixed, large value. We allow the center in Z, C, to float, and we find that as long as the initial value is around C ∼ 58–62 it does not vary much upon application of the Metropolis algorithm. The modeled mass surface changes therefore are similar for all the isotopic chains surrounding neodymium. Our tests with smaller fixed values of f show that additional solutions may be possible for a feature more tightly localized in Z, however such localized features need to be significantly larger than those shown in Figure 5 for the simulations to produce a good match to the solar pattern.
Another possibility for late-time r-process dynamics is that there is some amount of reheating in the ejecta either from interaction with a shock front, as in Arcones et al. (2007), or from the radioactive decay of the participating nuclei (Meyer 1989; Freiburghaus et al. 1999; Goriely & Martínez-Pinedo 2015; Lippuner & Roberts 2015; Mendoza-Temis et al. 2015). We do not consider either type of outflow in this work. The freeze-out temperature profile can change depending on the extent and duration of reheating. Whether or not this impacts rare-earth peak formation depends on the timing of the reheating relative to the production of these nuclei during the decay back to stability. We leave the investigation of such an intriguing possibility for a future study.
4. IMPLICATIONS FOR THE r-PROCESS SITE
Since there is a clear difference between the predicted mass surface for hot and very neutron-rich, cold astrophysical environments, future mass measurements in the rare-earth region can shed considerable light on the astrophysical scenario of the main r process by determining whether there is a region of enhanced stability in the mass surface and, if so, its depth and position. Dips at lower neutron numbers or local minimums at odd nuclei would favor very neutron-rich, cold conditions, whereas dips at high neutron numbers or local minimums at even nuclei would favor scenarios such as hot MHD or neutrino-driven outflows from supernovae or accretion disks. Our framework is sufficiently general such that the favored mass surface for robust rare-earth peak formation in other proposed sites of the r process can be analyzed in a similar manner.
If no discernible shape in the mass surface akin to that shown in Figure 5 is found, then either the rare-earth peak forms dynamically in a way not captured by our model—for example, the site of the r process is one we have not considered, e.g., Banerjee et al. (2011), Nakamura et al. (2015), or the mass feature responsible is sharp and local instead of smooth and global—or the rare-earth peak comes partially or fully from the daughter products of fission cycling. The latter outcome strongly favors compact object mergers as the site of the r process and would have implications for our understanding of the fission properties of heavy neutron-rich nuclei.
Current and future radioactive ion beam facilities are opening extensive regions of the nuclear chart for measurement, including neutron-rich nuclei of interest for the r process (see Mumpower et al. 2016 and references therein). Experiments at these facilities, when combined with astronomical data, astrophysical simulations, and nuclear theory, promise enormous progress on solving the mysteries of the r process. Here we have introduced a powerful method by which key nuclear properties can be identified that, when measured, can potentially constrain r-process conditions. We look forward to future measurements of masses, β-decay properties, and neutron capture strength functions, as well as nuclear theory work on fission and other quantities, in combination with advanced astrophysical simulation to further refine our results and provide better diagnostics of r-process conditions.
This work was supported in part by the National Science Foundation through grant number PHY1554876 (A.W.S.) and the Joint Institute for Nuclear Astrophysics grant numbers PHY0822648 and PHY1419765 (M.M.), and the U.S. Department of Energy under grant numbers DE-SC0013039 (R.S.) and DE-FG02-02ER41216 (G.C.M.). A portion of this work was also carried out under the auspices of the National Nuclear Security Administration of the U.S. Department of Energy at Los Alamos National Laboratory under Contract No. DE-AC52-06NA25396 (M.M.).
Software: CoH (3.3.3) (Kawano et al. 2016).