


Abstract
A high-resolution multi-wavelength simultaneous imaging system from visible to near-infrared bands with a solar adaptive optics system, in which seven imaging channels, including the G band (430.5 nm), the Na i line (589 nm), the Hα line (656.3 nm), the TiO band (705.7 nm), the Ca ii IR line (854.2 nm), the He i line (1083 nm), and the Fe i line (1565.3 nm), are chosen, is developed to image the solar atmosphere from the photosphere layer to the chromosphere layer. To our knowledge, this is the solar high-resolution imaging system with the widest spectral coverage. This system was demonstrated at the 1 m New Vaccum Solar Telescope and the on-sky high-resolution observational results were acquired. In this paper, we will illustrate the design and performance of the imaging system. The calibration and the data reduction of the system are also presented.
Export citation and abstract BibTeX RIS
1. Introduction
All large-scale solar activities such as flare, erupting prominences, and coronal mass ejection (CME) have some connections with solar tiny-scale structure. An important direction in the domain of solar physics is to find the evolution rule from the tiny-scale solar activities to large-scale solar activities. Several models have been proposed to predict or explain some of the large-scale dynamic structures (Wang et al. 2015). In order to validate the models, the most possible method is to build a link between ground-based high-resolution tomographic images for the solar photosphere and chromosphere and the images of the transition region and corona with short-wavelength from the space-based solar telescope such as the Solar Dynamics Observatory (SDO), the Transition Region and Coronal Explorer (TRACE), the Solar and Heliosphere Observatory (SOHO), Hinode (Solar B), and so on. The multi-wavelength simultaneous imaging system is one of the most important instruments for this purpose. The Dutch Open Telescope (DOT) solar telescope employed six visible imagings to observe the solar atmosphere at the photosphere layer and the chromosphere layer (Sütterlin et al. 2001). The high-quality tomographic results have been observed by using the speckle reconstruction method (Rutten et al. 2004a, 2004b; de Wijn et al. 2005; Leenarrts & Wedemeyer-Böhm 2005; Tziotziou et al. 2005). The selected spectral lines are blue continuum (432 nm), red continuum (654 nm), G band (430.5 nm), Ca ii H (396.8 nm), Hα line (656.3 nm), and Ba ii (455.4 nm) respectively. A broadband imager (BBI) with a solar adaptive optics (SAO) system has also been equipped for the GREGOR solar telescope to produce the first images. The high-resolution observing results at 430 nm (von der Lühe et al. 2012) and 590 nm (Schmidt et al. 2012) wavelengths have been published. In the New Solar Telescope (Cao et al. 2010a), six broadband wavelengths had initially been selected to observe the solar atmosphere at different heights. However, two channels at the TiO band and the Hα line had finally been implemented due to the compact space of the Nasmyth Bench. The corresponding observation and speckle reconstruction results were published in Cao et al. (2010a, 2010b). Besides that, several small full-disk telescopes with the multi-wavelength imaging system had been constructed one after another. For example, the Chromospheric Telescope (ChroTel) in Europe started commission by using Ca ii K line, Hα line, and He i line in 2012 (Bethge et al. 2011). A Full-Disk Patrol module made the observation of the full-disk images at high cadence in the Ca ii K line, the Hα line, and the He i line in 2011 June (Pevtsov et al. 2011). The new multi-wavelength solar telescope—ONSET (i.e., Optical and Near infrared Solar Eruption Tracer)—reported its first light results at the wavelengths of 425 nm, 360 nm, in the Hα line and the He i line in 2012 (Fang et al. 2013). Currently, in the two largest solar telescopes, i.e., DKIST and EST, the multi-wavelength imaging instrument will also be one of the most important instruments and the first light instruments. The Visible Broadband Imager (Wöger et al. 2010) and the BBI (Munari et al. 2010) will be built for DKIST and EST respectively.
In this paper, we will introduce a new multi-wavelength imaging system for revealing the evolution process and rule of large-scale solar activities, such as flare, CME, erupting prominences, and so on. It has seven channels with different center wavelengths and bandwidths, which are the G band (430.5 nm) with 0.5 nm bandwidth, the Na i line (589 nm) with 0.0035 nm bandwidth, the Hα line (656.3 nm) with 0.025 nm bandwidth, the TiO-band (705.7 nm) with 0.7 nm bandwidth, Ca ii IR(854.2 nm) with 0.02 nm bandwidth, the He i line (1083 nm) with 0.05 nm bandwidth, and the Fe i line (1565.3 nm) with 5 nm bandwidth respectively. This system has been tested at the 1 m New Vacuum Solar Telescope (NVST; Liu & Xu 2011). In particular, before the simultaneous imaging system, a 151-element high-order SAO system was used to correct static and dynamic optical aberrations for high-resolution imaging (Rao et al. 2012). To our knowledge, this is the solar high-resolution simultaneous imaging system with the widest spectral coverage. In this paper, we will introduce the new high-resolution multi-wavelength simultaneous imaging system in detail. The newest imaging results will be given at the first time.
The paper is organized as follows. In Section 2, we will introduce the selected spectral line and its function. In Section 3, we will demonstrate the whole system including the NVST, SAO, and the high-resolution multi-wavelength simultaneous imaging system. We will give the observing results of seven-wavelength high-resolution simultaneous imaging results in Section 4. Finally, we will summarize and outlook the high-resolution multi-wavelength simultaneous imaging system in Section 5.
2. Wavelength Selection
In order to decide the candidate spectral lines for studying the evolution process of solar activities, it is common knowledge that the observational spectral lines of the ground-based solar telescope should cover the different heights of the solar atmosphere from the photosphere layer to the chromosphere layer at least.
In our system, seven spectral lines were selected to image the solar atmosphere at the photosphere layer and the chromosphere layer. These different spectral lines cover from visible to near-infrared, and they are motivated by the following.
- 1.G band: It has better contrast for granular observation than the other spectral lines. This line can also be used to study the evolution of small-scale magnetic features, especially for small inter-granular magnetic elements (Berger & Title 2001) and flux tubes in the deep photosphere.
- 2.Na i line: The Na i line carries information at about 800 km height in solar atmosphere, which corresponds to the position between the lower chromosphere and the upper photosphere.
- 3.Hα line: It is sensitive to conditions in the upper chromosphere. The chromospheric morphology and dynamics process can be observed by using this spectral line.
- 4.TiO band: It is a good spectral line for sunspot observation because of its high sensitivity property for temperature. We can study temperature fluctuations of sunspot penumbrae and umbrae.
- 5.Ca ii IR line: Ca ii IR line is sensitive to dynamic property in chromospheres. It is also sensitive to temperature variation.
- 6.He i line: It can be used to study the chromospheric morphology and dynamical property and coronal morphology.
- 7.Fe i line: It is used to observe the images at the low photosphere layer. In the current configuration, the bandwidth is too broad to isolate the Fe i line. This channel will be upgraded by employing a narrowband filter in the future.
3. System Description
The high-resolution multi-wavelength simultaneous imaging system ranging from visible to near-infrared was tested at NVST with the high-order SAO system, which locates at the post-focus of the NVST.
3.1. NVST System and SAO System
The NVST system is illustrated in Figure 1, and it is located on the northeast shore of the Fuxian Lake, Yunnan province, China. It employed a modified double-Gregorian optical design, and the clear aperture is 0.985 m. The total effective focal length is 45 m, and the corresponding imaging F-number is about F/45. Refer to Liu & Xu (2011) for more information about the NVST.

Figure 1. Optical diagram of NVST.
Download figure:
Standard image High-resolution imageFigure 2 shows the optical layout of the high-resolution multi-wavelength simultaneous imaging system and the 151-element high-order SAO system. The 151-element SAO system mounted after F3 of the telescope is an updated system from the old 37-element low-order SAO system (Rao et al. 2012; Zhu et al. 2012). As shown in Figure 2, the M1 and M2 will guide the sunlight into the collimation mirror, OAP1 mirror (Off-Axis Parabolic mirror), which collimates the sunlight into a collimation beam with 62 mm aperture size. The M3 will feed the collimation beam into the tip/tilt mirror (TTM) and the deformable mirror (DM). The DM is conjugated to the entrance pupil, and the distance from the TTM to DM is about 690 mm. The pupil wander caused by the non-conjugation distance of TTM is less than 1.9%, which can be neglected. A reimaging system composed of the OAP2 mirror and the OAP3 mirror contract the beam size into 16 mm. The M4 and M5 are fold mirrors to guide the beam into the reimaging system. The first two dichroic beam splitters BS1 and BS2 will split the beam into three channels: one channel is for the near-infrared imaging from 800 to 1600 nm, and another channel is for the visible imaging, and the last channel is for the correlation tracking sensor and the correlation wavefront sensor of the high-order SAO system.

Figure 2. Optical schematic diagram of the multi-wavelength imaging system with the high-order SAO system. (a) SAO system and the four wavelength imaging system (G band, Na i line, Ha line, and TiO band) and (b) the three near-infrared imaging system (Ca ii IR line, He i line, and Fe i line).
Download figure:
Standard image High-resolution imageThe high-order SAO system consists of a fine tracking loop and a high-order wavefront correction loop. This system was put into routine operation at NVST in 2016. In the high-order wavefront correction loop, a DM with 151 actuators, a correlating Shack–Hartmann wavefront sensor, and a custom-built real-time controller are used. The frame rate of the wavefront sensor was up to 3500 Hz by using the Phantom V311CMOS camera, which delivers 10-bit-per pixel data in the format of 320 × 320 pixels. The number of pixels per sub-aperture is 24 × 20 pixels and the reference image size is 12 × 10 pixels. The pixel scale of each sub-aperture is 1 0 pixel−1, and the field of view (FOV) of the wavefront sensor is 24'' × 20''. For working stably under bad seeing conditions, the sunspot and the solar pore are often used as the target to measure the turbulence aberration accurately. With the help of the fine tracking loop, which includes a tracking sensor and a TTM (shown in Figure 2), the FOV of the wavefront sensor is always located at the center of the observing FOV. The fine tracking loop can stabilize the images within 006 in both X and Y directions, and you can refer more information about the fine tracking loop from the articles of Rao et al. (2016b, 2016c). The wavefront gradients of 102 sub-apertures can be calculated by the real-time controller based on FPGA and DSP with the Absolute Difference Square Algorithm. This SAO system is the fastest system, and it can work with the Fried parameter r0 at the 500 nm wavelength larger than 3 cm. According to our analytic results from the calculated wavefront residual error, according to the recorded wavefront sensor data (Rao et al. 2016b), the Strehl Ratio of the imaging results corrected by SAO system in TiO band channel for solar pore is superior to 0.75 with the Fried parameter r0 larger than 10 cm after the first 65 modes of the Zernike aberrations are corrected.
3.2. High-resolution Multi-wavelength Simultaneous Imaging System
The high-resolution multi-wavelength simultaneous system is located behind the high-order SAO system. Seven channels, i.e., four visible wavelength channels (shown in Figure 2(a)) and three near-infrared wavelength channels (shown in Figure 2(b)), are split into two main parts by the first dichroic beam splitter BS1. In the near-infrared imaging channel shown in Figure 2(b), the lenses L14 and L15 are used to relay the pupil plane into the Lyot filter, and lenses L16, L17, and L18 are the imaging lenses for the Ca ii IR line, the He i line, and the Fe i line respectively. The reflected light beam from BS1 is separated into two beams by the dichroic beam splitter BS2. The light beam ranging from 600 to 750 nm is reflected to the second part for Hα line and TiO band imaging. The lenses L10 and L11 relay the pupil plane to the Lyot filter, and L12 and L13 are imaging lenses for the Hα line channel and the TiO band channel respectively. The mirrors M8 and M9 are used to fold the optical configuration. The transmitted light beam from BS2 ranges from 380 to 600 nm. Lenses L1 and L2 are relay optics, and L3, L4, and L5 are imaging lenses of the Na I line channel, the G band channel, and the tracking sensor. In the correlating Shack–Hartmann wavefront sensor, L6 and L7 relay the pupil plane to the Lens Array position, and L8 and L9 are zoom lenses to match the aperture size of the WFS camera. The specifications of these beam splitters are listed in Table 1.
Table 1. Specifications of the Beam Splitters
| Name | Reflectivity at Different Wavelength | Transmission at Different Wavelength/(nm) |
|---|---|---|
| BS1/BS2 | ≥97.5% at G band at 500 nm at Na i line at Hα line at TiO band | ≥98.5% at Ca ii line at He i line at Fe i line at G band at 500 nm at Na i line |
| BS3/BS4 | ≥97.5% at G band at 500 nm | ≥96.5% at Na i line at 500 nm |
| BS5 | ∼5% at 500 nm | ∼95% at 500 nm |
| BS6/BS7/BS8 | ≥97.5% at TiO band at Ca ii line at He i line | ≥98.5% at Hα line at He i line at Fe i line |
Download table as: ASCIITypeset image
We employ three kinds of optical filters to select these seven spectral lines: three interference filters for G band, TiO band, and Fe i line channels, three Lyot filters for the Hα line, the Ca ii IR line, and the He i line, and an atomic filter for the Na i line shown in Figure 3 respectively. The interference filters for broadband channels were brought from the ANDOVER Corporation. The Lyot filters were developed by the Nanjing Institute of Astronomical Optics & Technology, the National Astronomical Observatories, the Chinese Academy of Sciences (CAS), and the atomic filter (magneto–optical filter, MOF) in the Na i line was developed by the Wuhan Institute of Physics and Mathematics, CAS. The central wavelength and the bandwidth of the seven imaging channels are listed in Table 2. The requirement of incidence angle of these Lyot filters is up to ±2°, and the performance should not be influenced over full FOV. In our practical system, the incidence angle ranges from −1 5 to +15, and the maximum wavelength shift is about 0.05 Å. Certainly, if the Lyot filter is put into a telecentric beam, the wavelength shifts over FOV can be further reduced. The multi-wavelength solar images are fed into seven CCD or CMOS cameras. Three identical CMOS cameras from PCO.edge with 2560 × 2160 pixel are used in the G band, the Na i line, and the TiO band channel respectively. Two of the same EMCCD cameras brought from Princeton Instruments for the Hα line and the Ca ii IR line channel have 1024 × 1024 pixels. Moreover, the near-infrared imaging cameras for the He i line and the Fe i line are also from Princeton Instruments, and their resolutions are 640 × 512. According to the system parameters, the corresponding spatial resolution and the ultimate FOV of all seven imaging channels are also listed in Table 2.

Figure 3. Filters used in the practical system. (a) Interference filter, (b) Lyot filter, and (c) atomic filter (magneto–optical filter, MOF).
Download figure:
Standard image High-resolution imageTable 2. System Parameters and Performance of the Multi-wavelength Simultaneous Imaging System
| Spectral Line | G band | Na i line | TiO band | Hα line | Ca ii IR line | He i line | Fe i line |
|---|---|---|---|---|---|---|---|
| Wavelength | 4305 Å | 5890 Å | 7057 Å | 6563 Å | 8542 Å | 10830 Å | 15653 Å |
| Bandwidth | 5 Å | 0.035 Å | 7 Å | 0.25 Å | 0.2 Å | 0.5 Å | 50 Å |
| Filter type | Interference | Atomic | Interference | Lyot | Interference | ||
| Tuning | Fixed | Tunable (±5 Å) | Tunable (±10 Å) | Tunable (±5 Å) | Fixed | ||
| Pixel resolution | 0044 pixel−1 |
0034 pixel−1 |
00345 pixel−1 |
0135 pixel−1 |
0176 pixel−1 |
011 pixel−1 |
010 pixel−1 |
| Pixel numbers | 2560 × 2160 | 1024 × 1024 | 640 × 512 | ||||
| Ultimate FOV | Φ1 6 6 |
Φ12 |
Φ12 |
Φ23 |
Φ30 |
Φ094 |
Φ085 |
| Spatial resolutiona | 0147 |
0160 |
0178 |
0170 |
0203 |
0246 |
0342 |
| Temporal resolutionb | 0.014 s | 0.03 s | 0.014 s | 0.14 s | 0.14 s | 0.06 s | 0.04 s |
| Temporal resolution for reconstructed imagec | 2.14 s | / | 2.14 s | 21.4 s | 21.4 s | 8.8 s | 6.0 s |
Notes.
aSpatial resolution the high-order SAO correction for the atmospheric coherence length r0 = with 8.6 cm at 500 nm. bTemporal resolution for the recorded AO-corrected continuous images. cTemporal resolutions are reconstructed from 150 frames of continuously observed images.Download table as: ASCIITypeset image
Figure 4 shows the practical optical and mechanical layout of the multi-wavelength simultaneous imaging system together with the high-order SAO system. It is a very compact system, and two levels were included. As shown in Figure 4, four visible channels (i.e., the G band channel, the Na i line channel, the Hα line channel, and the TiO band channel respectively) and 151-element high-order SAO system are located at the top level, and the other three channels (i.e., the Ca ii IR line channel, the He i line channel, and the Fe i line channel respectively) lies in the down level. In practical operation, the multi-wavelength simultaneous imaging system will work simultaneously together with the high-order SAO system.

Figure 4. Optical and mechanical layout of the AO-assisted multi-wavelength simultaneous imaging system.
Download figure:
Standard image High-resolution image4. System Calibration and Data Reduction
4.1. Calibration on the Spectral Profile of the Narrowband Filters
For the narrowband filters, the center spectral line profile and its tunable range, which decide what we observe, are the most important parameters. For Lyot filters, the solar spectrometer is employed to test the solar radiation spectrum distribution directly. The transmission profile for each Lyot filter can be calculated by a division operation between the measured solar radiation spectrum distribution with and without the Lyot filter. The Figures 5(a)–(c) show the spectral line profiles and tuning performance at the Hα line, the Ca ii IR line, and the He i line respectively. The center lines are 6562.81, 8542.144, and 10830 Å and the corresponding full width at half maximum (FWHM) bandwidth are 0.25 Å, 0.2 Å, and 0.5 Å respectively.

Figure 5. Performance of Lyot filters and atomic filter (magneto–optical filter, MOF) in the Na i line. (a) Transmission profile and its redshift test at the Hα line, (b) transmission profile and its tuning performance at the Ca ii line, (c) transmission profile at the He i line, and (d) transmission profile at the Na i line.
Download figure:
Standard image High-resolution imageIn the Na i line, we employed an atomic filter (Haberreiter et al. 2007), which is a kind of MOF, to do the solar observation from upper photosphere to lower chromosphere (Yong et al. 2016). In the current system, the information of Doppler shifts in the Na i line cannot be obtained because the atomic filter has only a single peak transmission. In the calibration, a laser source with continuous tunable wavelength and narrowband is used. When the laser is directed into the filter and scanned at the wavelength near the Na i line, the detector can record the corresponding transmission power passing from the atomic filter. Thus the curve drawn from the relationship between the transmission power and the wavelength will be obtained. The measured line center and the FWHM bandwidth are 5891.58 Å and 0.035 Å respectively, as shown in Figure 5(d).
4.2. Calibration on the Pixel Resolution of the Imaging System
For evaluating the performance of the seven channel imaging system, we have calibrated the spatial resolution per each pixel for each channel. A special reference object with known size is put on the Coudé focus plane (as shown in Figure 2). The number of pixels of its image can be calculated from the cameras of seven channels. Then the real spatial resolution can be calculated. The calibrated pixel resolutions are 00437 pixel−1 at G band, 00338 pixel−1 at Na i line, 0132 pixel−1 at Hα line, 00348 pixel−1 at TiO band, 0174 pixel−1 at Ca ii IR line, 0108 pixel−1 at He i line, and 0098 pixel−1 at Fe i line, respectively. The calibration results are very close to the design values, which are 0044 pixel−1 at G band, 0034 pixel−1 at Na i line, 0135 pixel−1 at Hα line, 00345 pixel−1 at TiO band, 0176 pixel−1 at Ca ii IR line, 011 pixel−1 at He i line, and 010 pixel−1 at Fe i line, respectively.
4.3. Estimation of Real Spatial Resolution after SAO Correction
We have also statistically analyzed the performance of the high-order SAO system for the multi-wavelength imaging system, and the resolution of the TiO band characterized by the relationship between its FWHMs and the atmospheric conditions have been presented in a previously published paper (Liu & Xu 2011). The FWHM resolutions of other imaging bands can be derived from the total closed-loop variances including the residual variances of the corrected low-order modes, the variances of the uncorrected high-order modes and the aliasing error variances (Zhong et al. 2014a). The complete procedure can be found in Liu & Xu (2011). Figure 6 shows the estimated resolutions of the G bands with different atmospheric conditions, where the dots are calculated by the wavefront variances and the dashed line is a −5/3 exponential Model. The resolutions of the seven imaging bands are depicted in Figure 7.

Figure 6. Resolutions of the G band with different atmospheric conditions.
Download figure:
Standard image High-resolution image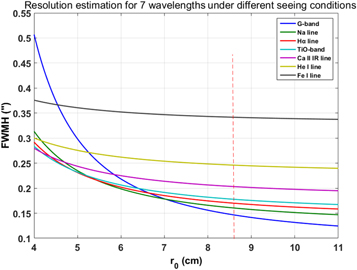
Figure 7. Resolutions of the seven imaging bands with different atmospheric conditions.
Download figure:
Standard image High-resolution imageAccording to the monitoring results of seeing conditions, the Fried parameter r0 at the 500 nm wavelength ranges from 5 to 10 cm at different times, and the practical r0 value when the results shown in the Figure 10 were observed was about 8.6 cm. From the statics results shown in Figure 7, the real spatial resolution at seven wavelengths are 0147, 0160, 0170, 0178, 0203, 0246, and 0342 respectively, also listed in Table 2. The estimation results for the real spatial resolution are based on the SAO system. The practical spatial resolution after speckle reconstruction should obviously be better.
4.4. Data Reduction
Besides the ultra-fast high-order SAO system, we also employ the speckle image reconstruction technique to further improve the quality of the images. The speckle reconstruction technique (Labeyrie 1970; Von der Lühe 1993: Rao et al. 2015) is based on the analysis of a sequence of short exposure images, by combining the recovered Fourier amplitude and the Fourier phases of the object (Weigelt 1977: Puschmann & Sailer 2006), the intensity of the object can be obtained. The main procedures in the reconstruction are listed in the Figure 8. The resolution of the reconstructed image can approach the diffraction limit of the telescope at the whole FOV of the observation. The Fourier amplitude is recovered with the Labyrier method, which used the speckle transfer function (STF) to obtain the power spectrum of the object. The STF are calculated from the Fried parameter of the turbulence at the same time of the observation. The bi-spectrum method was implemented to recover the Fourier phases of the object.
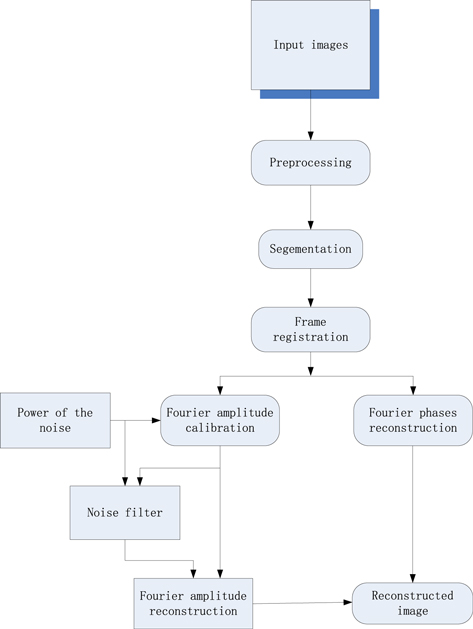
Figure 8. Speckle image reconstruction of the SAO images.
Download figure:
Standard image High-resolution imageThe STFs after AO correction are field dependent. In the reconstruction, the angle dependence of the compensation is modeled as the annular distribution of STF due to the angular dependence of AO compensation. The Field dependent STFs are calculated with the method proposed by Friedrich Wger Pehlemann & Von Der Lühe (1989), and the information used in this method is obtained from the data of the wavefront sensor and the voltages to the DM. The combined AO STF obtained by our team (Wöger & von der Lühe 2007) will be introduced in the reconstruction process after some modification. In this paper, all observed images are reconstructed by using the speckle reconstruction method, and more information about the method is available in Zhong et al. (2014a, 2014b).
5. Observation Results from the High-resolution Multi-wavelength Simultaneous Imaging System
The first light of the multi-wavelength imaging system was taken in 2015 October. According to the imaging camera's performance, the images of the G band, the Na i line, and the TiO band can be recorded more than 70 frames per second. The data frame rates for the Hα line, the Ca ii IR line, the He i line, and the Fe i line are 7 frames s−1, 7 frames s−1, 17 frames s−1, and 25 frames s−1 respectively.
The atomic filter (MOF) in the Na i line channel is a new experimental filter. Currently, an obvious non-common path aberration, which comes from the MOF itself, is included, and it cannot be corrected alone by using the current SAO system. Besides that, the bandwidth of the Na i line channel is about 3.5 pm (as shown in Table 2), and the signal-to-noise ratio (S/N) of the image is very low. Figure 9 shows the observed result from Na i line channel in 2016 March 18. We plan to change the atomic filter (MOF) to the F-P tunable filter in next step.
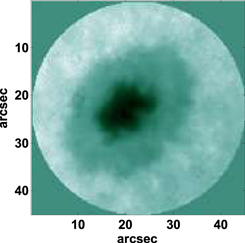
Figure 9. Observed result from the Na i line channel by using the atomic filter (mageto-opitcal filter, MOF) at center wavelength 5890 Å with 3.5 pm bandwidth.
Download figure:
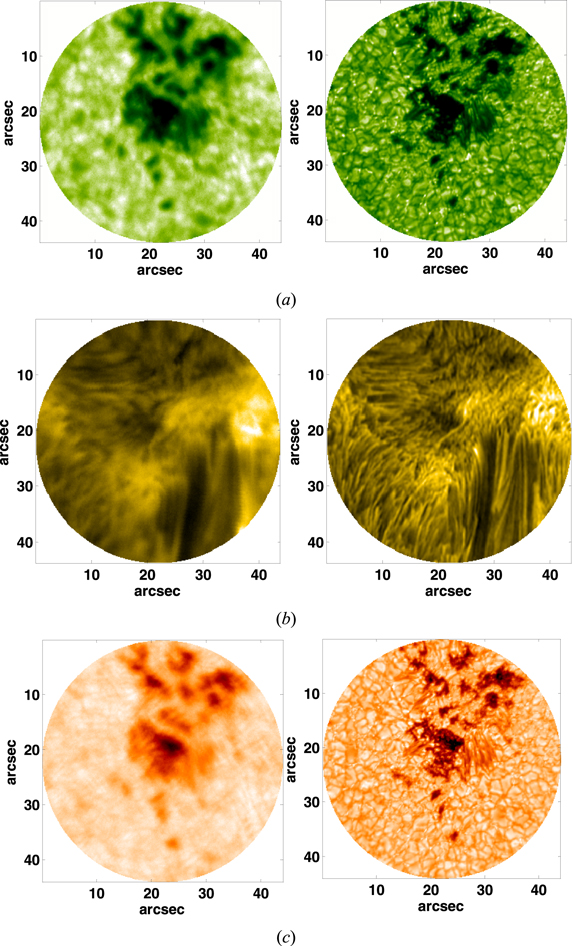
Standard image High-resolution imageFigure 10 shows the imaging observation results from the other six channels without SAO correction and with image reconstruction based on the SAO correction. These results were observed at 11:36 AM, 07/10/2016 at NOAA 12598. The observation parameters are described in Table 2, including the temporal resolution without and with speckle reconstruction. Panels (a)–(f) show the simultaneous images of the G band (4305 Å, 5 Å), the Hα line l (6563 Å, 0.25 Å), the TiO band (7057 Å, 7 Å), the Ca ii IR line (8542 Å, 0.2 Å), the He i line (10830 Å, 0.5 Å), and the Fe i line (15653 Å, 50 Å) respectively. The corresponding exposure times of the recorded images are 10 ms, 40 ms, 1.5 ms, 20 ms, 4 ms, and 2 ms respectively. The FOV of the first five channels are all displayed Φ 44'', and the FOV of the Fe i line channel is about Φ 35''. From these figures, you can find the different features at different heights of solar atmosphere with high spatial resolution.
Download figure:
Standard image High-resolution image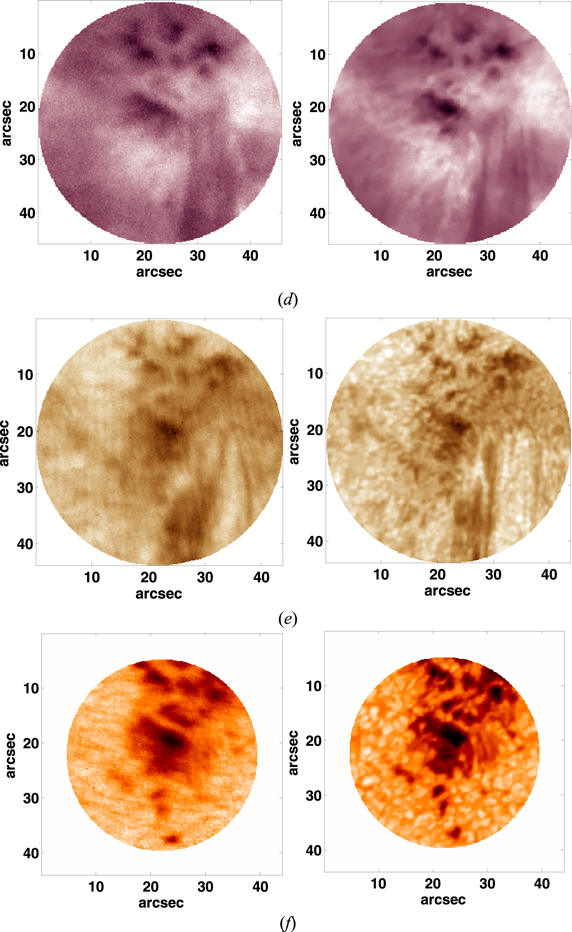
Figure 10. Comparison of the observed results without SAO and with speckle reconstruction of the SAO image. These images were taken from the six imaging channels. (a) the G band, (b) the Hα line, (c) the TiO band, (d) the Ca ii IR line, (e) the He i line, and (f) the Fe i line.
Download figure:
Standard image High-resolution imageWe also monitor the evolution process with the time elapse by using the Hα line channel. The pictures of the Figure 11 are the part of continuous observing movie in 2015 November 08 at NOAA 12449. The obvious difference in the upper right corner at different times can be found. It can be used to track the evolution rule with the time at chromosphere layer.
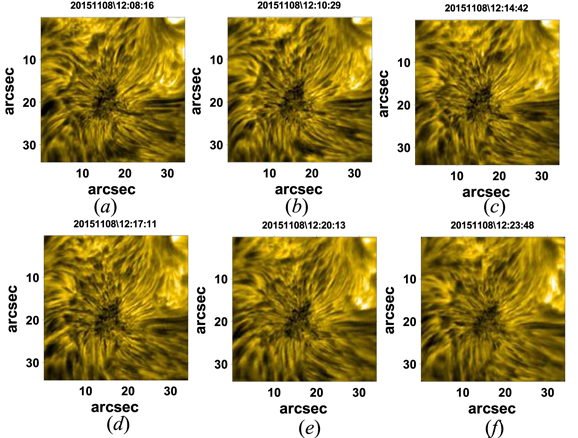
Figure 11. Monitoring results with time elapse from the Hα line imaging channel. (a)–(f) are the selected images from the continuous monitoring movie at different times (2015 November 08, NOAA 12449).
Download figure:
Standard image High-resolution imageFigures 12 and 13 give the blue and red wings of Hα line and Ca ii IR line respectively. At the top of these two figures, the letter "B" or "R" means the blue wing or red wing, and the number after the letter "B" or "R" illustrates the quantity of the blueshift or redshift from the line center. For example, B040 in Figure 12 stands for the blue Hα line wing at blueshift 40 pm, and the R010 stands for the red Hα line wing at redshift 10 pm. There are nine pictures for each figure including four blue wings, one center line, and four red wings, and the spectral gap is 10 pm. We can find the obvious difference at different blue- or redshift from the center line. We have also calibrated the wavelength offset for these two channels, i.e., the Hα line channel and the Ca ii line channel, in the laboratory, and the calibration results shown in Figures 5(a) and (b) in Section 4.1. For these two filters, the scanning time is about 20–30 s from −5 Å to 5 Å with the 1 Å step. The practical time elapse of these nine figures in two channels is listed in Table 3.
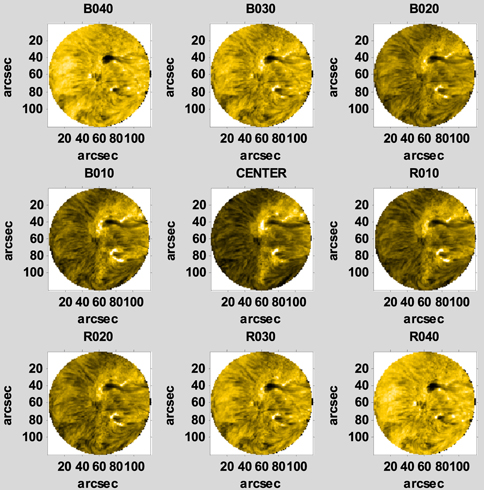
Figure 12. Monitoring results with time elapse from the Hα line imaging channel. (a)–(f) are the selected images from the continuous monitoring movie at different times (2015 November 08, NOAA 12449). The exposure time is 40 ms.
Download figure:
Standard image High-resolution image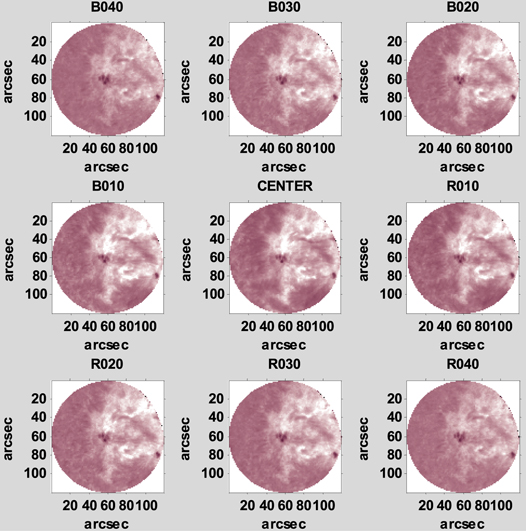
Figure 13. Monitoring results with time elapse from the Ca ii IR line imaging channel. (a)–(f) are the selected images from the continuous monitoring movie at different times (2015 November 08, NOAA 12449). The exposure time is 20 ms.
Download figure:
Standard image High-resolution image
Table 3. Time Elapse of the Wavelength Scanning in Both Figures 12 and 13
| Channel | R010 | B010 | R020 | B020 | R030 | B030 | R040 | B040 | Center |
|---|---|---|---|---|---|---|---|---|---|
| Hα line | 0 s | 44 s | 65 s | 91 s | 130 s | 156 s | 183 s | 208 s | 308 s |
| Ca ii IR line | 0 s | 34 s | 61 s | 99 s | 126 s | 161 s | 190 s | 228 s | 320 s |
Download table as: ASCIITypeset image
6. Conclusion
In this paper, we have introduced the multi-wavelength simultaneous imaging system with SAO. The observation results have also been demonstrated on the NVST. From the given observation images, the high-order SAO system and the multi-wavelength simultaneous imaging system worked well. We trust that more observational data will be obtained in the future. Meanwhile, we will make some necessary modifications for this multi-wavelength simultaneous imaging system to fit the Chinese Large Solar Telescope (CLST; Véran et al. 1997) system as one of the first light instruments of the CLST. It is necessary to note that the He i line and the Fe i line are sensitive to magnetic field. In particular, the magnetic field measurement in Fe i line has high contrast and high S/N because of the weak background at this spectral line. We will use this spectral line to measure the weak magnetic strength with the help of the near-infrared polarimeter in the future.
This work was funded by the National Natural Science Foundation of China (grant Nos. 11178004, 11643008, and 11727805). We are grateful to Profs. Zhong Liu, Zhenyu Jin, and Jun Lin of the Yunnan Astronomical Observatory for their help during the system setup and solar observation. A special acknowledgment should be given to Prof. Wenhan Jiang from the IOE, for his revision benefited us greatly. The reviewers are also acknowledged for their very valuable comments and suggestions.