


Abstract
The dwarf planet Ceres (diameter 939 km) is the largest object in the main asteroid belt. Recent investigations suggest that Ceres is a thermally evolved, volatile-rich body with potential geological activity, a body which was never completely molten but possibly differentiated into a rocky core, an ice-rich mantle, and which may contain remnant internal liquid water. Thermal alteration and exogenic material infall contribute to producing a (dark) carbonaceous chondritic-like surface containing ammoniated phyllosilicates. Here we report imaging and spectroscopic analyses of Occator crater derived from the Framing Camera and the Visible and Infrared Spectrometer onboard Dawn. We found that the central bright spot (Cerealia Facula) of Occator is ∼30 Myr younger than the crater itself. The central spot is located in a central pit which contains a dome that is spectrally homogenous, exhibiting absorption features that are consistent with carbonates. Multiple radial fractures across the dome indicate an extrusive formation process. Our results lead us to conclude that the floor region was subject to past endogenic activity. Dome and bright material in its vicinity formed likely due to a long-lasting, periodic, or episodic ascent of bright material from a subsurface reservoir rich in carbonates. Originally triggered by an impact event, gases, possibly dissolved from a subsurface water/brine layer, enabled material rich in carbonates to ascend through fractures and be deposited onto the surface.
Export citation and abstract BibTeX RIS
1. Introduction
The Dawn spacecraft (Russell & Raymond 2012) is equipped with two Framing Cameras (FC1 and FC2). To date (2017 February) camera FC2 has obtained ∼56,000 images of Ceres in seven colors (0.44–0.98 μm) and one clear filter (Sierks et al. 2012), performing global color mapping of its surface at a resolution of ∼140 m/pixel (Russell et al. 2016). However, for selected sites, higher-resolution color data with ∼35 m/pixel have been obtained. One of the prime imaging targets is the crater Occator, which hosts the brightest features on Ceres (Nathues et al. 2015a). These features have been commonly referred to as "bright spots" and show evidence of a diurnal brightness variation that is attributed to local haze (Nathues et al. 2015a; Thangjam et al. 2016). Spectral analysis by De Sanctis et al. (2016) using the Visible and Infrared Spectrometer (VIR) onboard the Dawn spacecraft, revealed that these bright spots are predominately carbonates mixed with some dark ammoniated phyllosilicate minerals. They also concluded that carbonates and ammoniated minerals are present on Occator's floor as well as on a global scale.
Here, we report our analyses of Occator's interior landforms using our own higher-level FC and VIR data products, which are based on available imagery in the Planetary Data System (PDS, https://pds.nasa.gov/) archive, their compositions, morphologies, and formation processes. Our results provide comprehensive new insights into the composition and geologic evolution of the crater and its bright spots—Ceres' most enigmatic features.
2. Data Processing And Method
The Dawn Framing Camera (FC) has imaged the entire illuminated surface of (1) Ceres from different orbits in 2015/16. Ceres was mapped from Survey, HAMO (High-Altitude Mapping Orbit), and LAMO (Low-Altitude Mapping Orbit) at spatial resolutions of ∼400 m/pixel, ∼140 m/pixel, and ∼35 m/pixel, respectively. Framing Camera color images exist in three standard levels: 1a, 1b, and 1c (color only), from which we used level 1b (clear filter) and 1c (colors). For further details see Nathues et al. (2014, 2015b). Level 1b/c data are converted to reflectance (I/F) by dividing the observed radiance by solar irradiance from a normally solar-illuminated Lambertian disk. Color cubes are derived by applying an in-house image processing pipeline as described in Reddy et al. (2012) and Nathues et al. (2014, 2015b). Color cubes are photometrically corrected to standard viewing geometry (i.e., 30° phase, 30° incidence, and 0° emission angle) using Hapke functions (Hapke 2012 and references therein). Hapke light scattering parameters have been iteratively derived from the Approach, Survey, and HAMO mission phases. For this correction and the visualization of the results, we used the HAMO Ceres shape model deduced from FC clear filter images and produced by the Jet Propulsion Laboratory (Park et al. 2016). The resulting reflectance data are map-projected in several steps, and co-registered to align the color frames, creating color cubes for our analysis. All produced maps have their prime median at crater Kait (Roatsch et al. 2016).
In parallel with the FC observations, the cerean surface has been scanned by the VIR imaging spectrometer covering the wavelength range between 0.25 and 5.0 μm (De Sanctis et al. 2011). Radiometrically calibrated, VIR radiance data of level 1b are available at the PDS, and were further processed at MPS. In order to allow a comparison with the FC color data, the VIR level 1b data were converted to reflectance (I/F) using the same solar spectrum as for FC data. In a subsequent step, the thermal emission of Ceres was removed by applying a method described in Clark et al. (2011) adapted for the VIR spectral range. Like those authors, we solved for spectral reflectance and temperature empirically, because the match of the topography to the VIR data could not be identified with the necessary accuracy for the retrieval of the respective reflectance levels. Finally, all spectra were smoothed by a 3 pixel-wide boxcar filter. In order to increase the signal-to-noise ratio (S/N) of the spectra, we used averaged spectra of 2 by 2 pixels. Due to VIR data S/N limitations we restricted ourselves to a qualititative analysis (i.e., whether a diagnostic absorption band is present or not and whether specific absorption bands are amplified or reduced). All color data used in this study have been obtained at LAMO with an FC resolution of ∼35 m/pixel while the VIR data are from HAMO with a resolution of ∼370 m/pixel.
3. Geology Of Occator Crater
Occator (19 82N, 23933E) is a ∼92 km diameter5
complex impact crater exhibiting a central pit and a remnant central peak (Figures 1 to 4). The central pit hosts the brightest surface feature on Ceres, which we call thereafter the "primary spot", while a cluster of bright spots, called the "secondary spots" are observed to the east of the pit (Figures 1 and 2). The pit has a circular, plan-view diameter of ∼11 km, is ∼0.6 km deep, and is bounded by peripheral fractures (Nathues et al. 2015a). In the center of the pit, a bright fractured, ∼0.4 km × ∼3 km (height × basal diameter) dome formed (Figures 2, 4(b)). Remnants of a former central peak encompass the central pit to the west and east. The highest remaining peak rises at the pit's western periphery, reaching a height of ∼0.75 km relative to the surrounding crater floor. Occator has been modified by syn- and post-formation wall collapse events that resulted in the formation of small-to-large-scale debris avalanche deposits (unit l in Figure 3); the largest deposit covers almost the entire floor (Figures 3 and 4). A large crater wall segment collapsed (inferred extent is marked in Figure 3); the material traveled first toward the center of the crater and was then deflected by the elevated remnant central peak toward the NE and W. The NE lobe impinged onto crater terrace material and its surface is characterized by a rough, hummocky to ridged texture. The terminus of the NE lobe is located near the lowest point (−2425 m) of the crater floor (unit cfs in Figure 3) suggesting a lobe thickness up to 1000 m. The western branch of the deposit is marked by a hummocky surface textures. Its margin shows in places a smooth texture, which may be the result of subsequent deposition or remobilization of crater terrace material (unit ct in Figure 3) onto the flow deposit. It is noted that the debris avalanche likely also spilled into the central pit partially burying pre-existing bright material. The largest lobate deposit (unit l in Figure 3) is cut by a fracture system that extends across much of Occator's floor (Figure 3).
82N, 23933E) is a ∼92 km diameter5
complex impact crater exhibiting a central pit and a remnant central peak (Figures 1 to 4). The central pit hosts the brightest surface feature on Ceres, which we call thereafter the "primary spot", while a cluster of bright spots, called the "secondary spots" are observed to the east of the pit (Figures 1 and 2). The pit has a circular, plan-view diameter of ∼11 km, is ∼0.6 km deep, and is bounded by peripheral fractures (Nathues et al. 2015a). In the center of the pit, a bright fractured, ∼0.4 km × ∼3 km (height × basal diameter) dome formed (Figures 2, 4(b)). Remnants of a former central peak encompass the central pit to the west and east. The highest remaining peak rises at the pit's western periphery, reaching a height of ∼0.75 km relative to the surrounding crater floor. Occator has been modified by syn- and post-formation wall collapse events that resulted in the formation of small-to-large-scale debris avalanche deposits (unit l in Figure 3); the largest deposit covers almost the entire floor (Figures 3 and 4). A large crater wall segment collapsed (inferred extent is marked in Figure 3); the material traveled first toward the center of the crater and was then deflected by the elevated remnant central peak toward the NE and W. The NE lobe impinged onto crater terrace material and its surface is characterized by a rough, hummocky to ridged texture. The terminus of the NE lobe is located near the lowest point (−2425 m) of the crater floor (unit cfs in Figure 3) suggesting a lobe thickness up to 1000 m. The western branch of the deposit is marked by a hummocky surface textures. Its margin shows in places a smooth texture, which may be the result of subsequent deposition or remobilization of crater terrace material (unit ct in Figure 3) onto the flow deposit. It is noted that the debris avalanche likely also spilled into the central pit partially burying pre-existing bright material. The largest lobate deposit (unit l in Figure 3) is cut by a fracture system that extends across much of Occator's floor (Figure 3).

Figure 1. Color mosaic of Occator crater in perspective view. This projected mosaic has been obtained from a distance of 1470 km at ∼140 m/pixel resolution (HAMO) and wrapped on the HAMO Digital Terrain Model provided by JPL (Park et al. 2016); vertical exaggeration in this view is three times. Used RGB colors are: R = 0.96 μm, G = 0.75 μm, B = 0.44 μm. Occator crater exhibits several bright areas (spots) on its floor. The brightest area (Cerealia Fecula) is located within a central pit containing a dome. The arrow points to north.
Download figure:
Standard image High-resolution image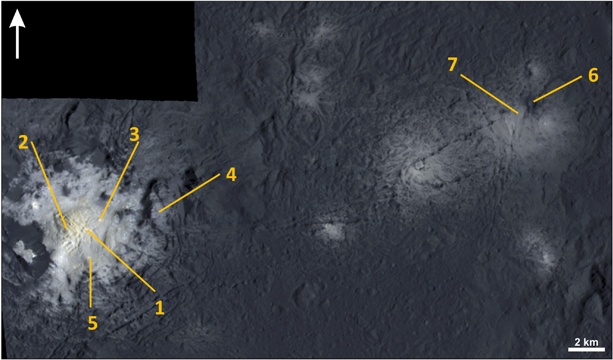
Figure 2. Central pit, dome, and "secondary" bright spots on Occator's floor. Color images for this mosaic were acquired from a distance of 374 km (LAMO; ∼35 m/pixel). Used RGB colors are: R = 0.96 μm, G = 0.75 μm, B = 0.44 μm. The brightest area is located in a central pit (left, named Cerealia Facula) containing a central dome, while a number of secondary bright spots (middle to right, named Vinalia Faculae) are observed on a lobate flow deposit. The central pit exhibits fractures at its periphery, likely originating from collapses of the pit region. Bright material covers several elevated regions within the central pit. Secondary spots are associated with fractures as well. Numbers mark sites whose color spectra are shown in Figures 7 and 8. The arrow points to north.
Download figure:
Standard image High-resolution image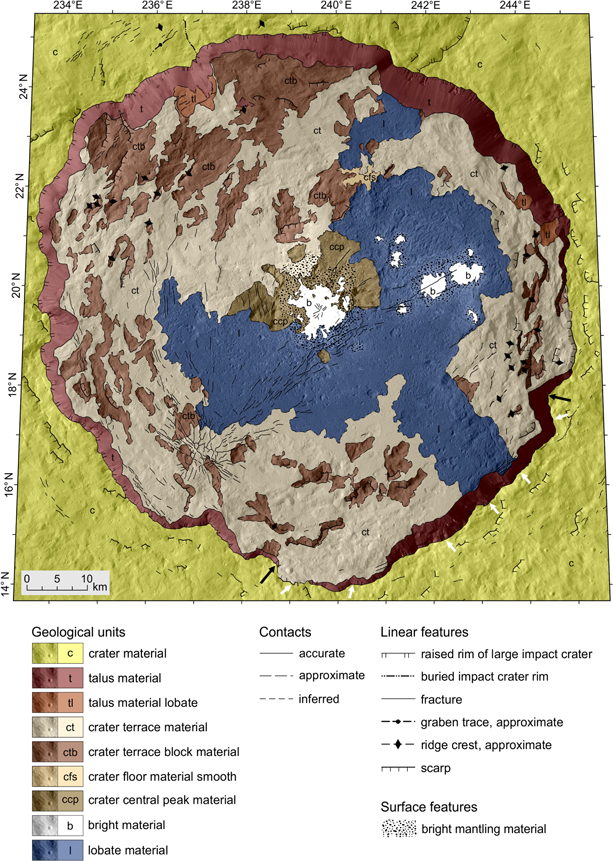
Figure 3. Simplified geological map of the interior of Occator crater. The 92 km diameter crater is characterized by syn- and post-formation crater wall collapse as evidenced by the rim's rectangular disruptions. The last major collapse event occurred along the southeastern wall (inferred maximum extent of collapsed wall segment: black arrows; collapse direction: white arrows) forming the debris avalanche deposit (unit l), which covers the central portion of Occator. The flow deposit's SE margin is partially buried by smooth textured terrace material. Extensive fracture systems interior and exterior to Occator are noted. The map is presented in Transverse Mercator projection centered at 19.5°N/239.5°E.
Download figure:
Standard image High-resolution image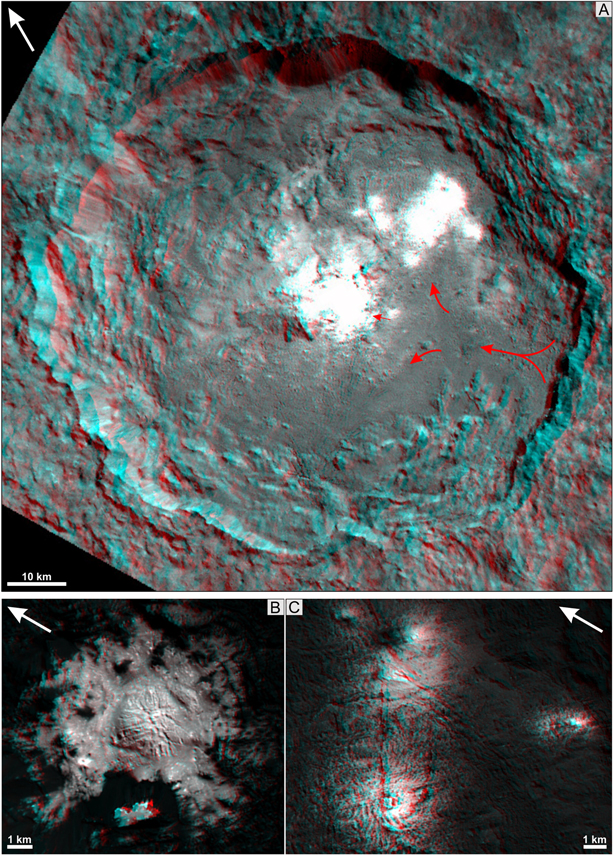
Figure 4. 3D anaglyphs of Occator crater. (A) HAMO anaglyph of Occator crater showing crater terrace material, lobate flow deposits, central pit, remnants of a central peak, and the bright spots. Red arrows mark the flow direction of the largest lobate deposit. Note that the central pit was also partially buried by the lobate deposit. (B) LAMO anaglyph of the dome within the central pit (Cerealia Facula). Note the isolated bright material deposit on an elevated region is visible close to the lower boarder of the sub-figure. (C) LAMO anaglyph of the brightest secondary spots of Vinalia Faculae. Arrows point to north.
Download figure:
Standard image High-resolution imageThe secondary spots are spatially confined to the distal portion of the largest debris avalanche deposit that resulted from a crater wall collapse of the SE wall (unit l in Figure 3). Bright material thickness at the secondary spots is rather thin as it mostly mantles the rough surface of the flow deposit. Near the most prominent secondary spot (next to #6 in Figure 2), two impact craters of ∼0.3 km and ∼0.44 km diameter are observed, which excavated solely dark flow material. Since no bright patches within the ejecta of these craters are observed, this implies that the bright material was fully penetrated by the projectile and is likely only a few meters or less thick. There are further smaller impact craters in the vicinity of the brightest secondary spot, but those craters (or their ejecta) are coated with bright material, testifying to ongoing deposition of bright material on continuously forming impact craters. In contrast, up to 12 small impact craters (diameter range 0.08−0.3 km) are present on the central dome and the surrounding bright material inside the pit. These craters are entirely composed of bright material, indicating the projectiles impacted solely into bright material. This in turn suggests that the thickness of the bright material on the dome and its vicinity is on average higher than for the secondary spots; it is likely that the dome is entirely composed of bright material. Multiple bright fractures of different lengths crisscross the entire surface of the dome in a radial pattern. This radial fracture pattern is most consistent with a predominantly extrusive origin of the dome. In contrast, the central pit may have formed by subsidence as inferred by peripheral ring fractures.
Extensive wall collapse and subsequent terrace formation and avalanche deposition is evident at Occator. Portions of terrace material along crater walls display isolated sub-parallel fracture systems, mostly oriented parallel to crater wall segments (Figure 3). The largest fracture system is located at the SW portion of Occator primarily within the terrace material where two fracture systems intersect. One is trending from S to N and the second from SW to NE. These fractures are up to 250 m wide.
The intersection of the two sets of fractures occurs on lower sloped terrace material. Here, some fracture segments show minor vertical offsets on the order of about 10 m. The overall fracture pattern coupled with minor offsets may suggest a coupled process of updoming and minor subsidence due to either subsurface material cooling (i.e., expansion of a brine reservoir) and minor removal of subsurface material, respectively, or by contraction. A set of sub-parallel fractures extend toward the NE across the large debris avalanche deposit to its distal portion. Here, the secondary bright spots are genetically linked to fractures.
4. Crater-based Model Ages
Morphology and crater-based age dating suggest that Occator is a young crater. The formation of floor materials has been estimated to be as young as ∼6.9 ± 0.9 Ma (Nathues et al. 2016) while the crater itself formed ∼34 ± 2 Ma ago (Nathues et al. 2015a) and is thus significantly older. The latter age is derived from the crater size–frequency distribution exposed on Occator's ejecta (see Nathues et al. 2015a) but was reassessed by applying the improved lunar-derived chronology and production functions of Hiesinger et al. (2016) in the same crater diameter range. The age difference between the crater floor and ejecta materials is due to crater wall collapse events and subsequent floor modification by multiple depositional processes. Our recent crater counting results (see also Appendix, Figure 11) are based on a complete LAMO image coverage of Occator and our new effort to map its interior for which we also utilized a composite 3D LAMO anaglyph (Figures 4(b) and (c)) to identify impact craters on rough textured surfaces. The methodology to derive crater-based model ages of geological units is described in Platz et al. (2013) and uses the lunar-derived chronology and production functions of Hiesinger et al. (2016). Craters were mapped using the ArcGIS add-on CraterTools (Kneissl et al. 2011) and the resulting crater size–frequency distributions were analyzed in Craterstats (Michael & Neukum 2010; Michael 2016) and tested for randomness (Michael et al. 2012). For the large debris avalanche deposit (unit l in Figure 3) a model age of ∼9.2 ± 2 Ma is inferred (see the
5. Composition of Bright Spot and Floor Materials
The floor and terraces of Occator are rather dark; their average reflectance is between ∼0.02 and ∼0.04 at 0.55 μm, and thus similar to the average cerean surface. However, some areas on the floor are remarkably bright (>0.3 at 0.55 μm at LAMO resolution), especially inside the central pit. This large absolute reflectance difference between floor and bright spots is striking, making the spots distinct from the rest of the cerean surface. For the present analysis we investigated FC color cubes as well as one VIR cube covering the wavelength ranges 0.4–1.0 μm and 1.0–4.2 μm, respectively. In order to identify compositional differences across the central pit and floor, we investigated spectra of specific sites (Figures 2 and 5) as well as reference surface areas. Color spectra are plotted in Figures 6 and 7, and some associated VIR spectra are presented in Figure 8. Framing Camera high-resolution color imagery resolves details of the central pit's dome (Figure 2), which is spectrally rather homogeneous, showing only minor spectral color differences (spectra #1, #2, #3, #5 in Figures 6/7). Also the VIR spectra of the dome show minor shape variation, but it should be noted that the spatial resolution of these spectra is significantly coarser than those of the FC color data. Moving radially outwards from the bright dome, the overall color spectral shape gradually changes, finally reaching the shape of the floor material. This gradual change (Figure 7) is an indication of progressive material mixing: the bright material, likely also getting thinner, is more and more contaminated with dark floor and central peak material. The IR spectra of VIR also show a gradual spectral change. The dome and its immediate vicinity exhibit distinct absorption bands at ∼3.4 μm and ∼3.9 μm (Figure 8) which have been attributed to carbonates (De Sanctis et al. 2016). These absorption bands are also clearly present in spectra of the secondary spots (e.g., #7 in Figure 8) but are ambiguous in the VIR floor spectra (e.g., #9). Floor and bright areas show different absorption bands, especially different strengths, and thus different compositions. This is supported by significant differences in surface texture, morphology, and interpreted formation. As shown in Figures 6 and 7, color spectra of (flow) floor (south) material (#8) are similar to Occator background material (#9),6
with the exception that the floor spectra show higher reflectances at 0.44 μm. This observation, together with a comparison between the IR spectra of the (flow) floor (south) material (#8 in Figure 8) and the average of Ceres (see Figure 9) led us to conclude that the dark floor material is close to Ceres' average surface material and clearly distinct from the bright material. According to De Sanctis et al. (2015, 2016), the average cerean surface is a mixture of low albedo materials, magnesium phyllosilicates, ammoniated phyllosilicates, and carbonates. De Sanctis et al. (2016) also concluded that the composition of the Occator floor material is close to the cerean average material. However, in contrast to De Sanctis et al. (2016) we cannot confirm the presence of a ∼3.4 μm carbonate absorption band in any of the inspected floor spectra (e.g., see Figure 8, #6 and #9). Also, the presence of the ∼3.9 μm carbonate absorption in floor spectra is unclear, since the spectral uncertainty is of the same order as the potential band depth even after spectral smoothing.7
Figure 9 displays the average IR spectra of Ceres from RC3 orbit after thermal removal. This spectrum shows among others a distinct absorption at ∼3.9 μm which is likely due to carbonates (Rivkin et al. 2006). However, the global presence of the weaker carbonate absorption at ∼3.4 μm is uncertain. Carbonates show absorptions at ∼3.9 and ∼3.4 μm depending on their type, i.e., the cation (e.g., Ca2+, Mg2+, Fe2+, Na+) bonded to the CO , their abundance and the physical properties (Blaney & McCord 1989; Wagner & Schade 1996; Cloutis et al. 2000; Palomba et al. 2009). From the laboratory work of Wagner & Schade (1996) on carbonate mixtures it is known that the ∼3.4 μm absorption is often below instrumental detection limits.
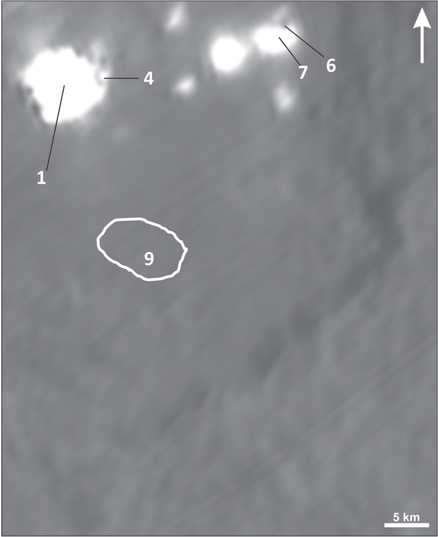
Figure 5. VIR HAMO image showing the southern portion of Occator crater. Numbered sites are similar to Figure 2. Respective IR spectra are shown in Figure 8. VIR HAMO spatial resolution is ∼10-times lower than FC LAMO resolution in Figure 2. The arrow points to north.
Download figure:
Standard image High-resolution image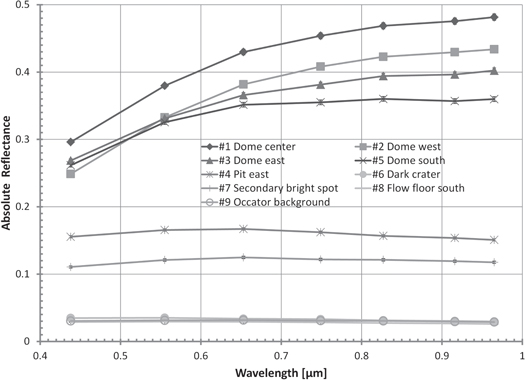
Figure 6. Absolute FC color spectra of selected sites. Dome spectra (#1 to #3, #5) are brightest and entirely red sloped, while on the dome's immediate surrounding reflectivities (e.g., #4) are mostly significantly lower. On average the reflectivity gradually lowers with increasing distance to the central dome, reaching Ceres average reflectivities (e.g., #9) on the floor (#8). Statistical errors are on the order of symbol size.
Download figure:
Standard image High-resolution image
Figure 7. Relative color spectra of selected sites. Color spectra of the dome show steepest positive spectral slopes across the entire wavelength range (#1 to #3), while spectra of bright pit material (#4) and secondary spots are less sloped (#7). With increasing distance from the dome the material on average darkens, the spectral slope between 0.44 μm and 0.65 μm lowers and the slope longward of 0.65 μm gets more and more negatively sloped. This is a result of mixing between bright and dark (floor) material. The spectral shape of the dark crater (#6) almost matches that one of the (flow) floor spectrum (#8) and the Occator background spectrum (#9). The spectrum of the secondary bright spot (#7) lies intermediate between the dark material and the bright dome material. Relative statistical errors are presented.
Download figure:
Standard image High-resolution image
Figure 8. Relative IR reflectance spectra of selected sites at Occator. Selected sites are marked in Figure 6. While the dome center spectrum (#1) shows distinct ∼3.4 and ∼3.9 μm carbonate absorption bands, both bands vanish for less bright sites. Floor spectra (flow) floor south (#9) and dark crater (#6) do not show the ∼3.4 μm band but possibly the ∼3.9 μm band, which is in the same order as the data uncertainty. A 3 pixel-wide boxcar average was applied to each spectrum. Several potential absorption features are within the order of the noise level of the spectra (see Figure 9); spectra have been corrected for thermal emission.
Download figure:
Standard image High-resolution image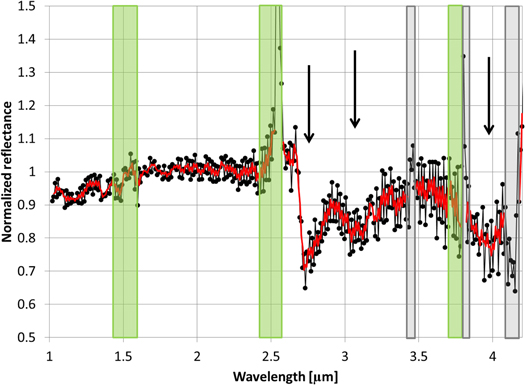
Figure 9. Average spectrum of Ceres from RC3 orbit. More than 2500 spectra of Ceres have been averaged to derive this global spectrum which has been corrected for thermal emission. The red spectrum is smoothed by a running 3 pixel-wide boxcar. Green boxes mark wavelength ranges which are heavily influenced by the instrument's order sorting filters. Gray boxes mark wavelength ranges that are considered to be "artifacts" (De Sanctis et al. 2015, 2016). Absorption bands at ∼2.7 μm, ∼3.1 μm, and ∼3.9 μm are certain; weaker absorptions are uncertain.
Download figure:
Standard image High-resolution imageVIR spectra of the dome's center clearly differ from other bright and dark sites (Figure 8). It seems that these other bright sites consist of mixtures of dome and dark floor material. For instance, the dark sites' absorption band minima of the 2.7 μm feature due to OH- bonding in phyllosilicates is at a slightly shorter wavelength than for the bright dome; other bright sites are intermediate. The weak absorption at ∼3.1 μm due to ammoniated clays (De Sanctis et al. 2015) is weak in floor material and absent in spectra of the dome; other bright sites seem to be intermediate. The ∼3.4 and ∼3.9 μm absorption features of the bright regions are similarly intermediate: the bright dome center has the deepest absorption bands of all areas; the dark sites do not uniquely exhibit those two absorptions bands.
6. Discussion
The interior of Occator crater exhibits evidence of present and past endogenic activity, millions of years after crater formation. The presence of a central pit and remnants of a central peak are also observed at Gaue (ø = 80 km) and possibly also at Dantu (ø = 126 km). Central domes in complex, central-pit craters are also known to exist on Ganymede and Callisto. These domes are interpreted to have formed by surface uplift during or after impact by initiating formation and ascent of cryomagmatic material (Schenk 1993; Bray et al. 2012). It is commonly assumed that central peaks form by the rebounding of subsurface strata and that central pits form either by collapse of the central peak, violent release of target volatiles, or by collapse as a result of subsurface removal of melt material (e.g., Wood et al. 1978; Bray et al. 2012). Occator's impact event ∼34 ± 2 Ma ago obviously delivered sufficient energy to trigger processes that finally led to the present occurrence of bright spots on the surface. However, whether the impact energy triggered a long-lasting process in the sub-surface, leading to the bright spot formation or whether the instant mass removal during the cratering process was already sufficient to enable the ascent of deep-seated reservoir material, is unknown.
The pit's dome, exhibiting bright carbonate material, is essentially uncontaminated by ambient dark material and is fractured, which is indicative of one or more extrusive events. However, it seems less likely that a single extrusive phase can be responsible for the burial of most former dark peak material as well as the up-doming within the central pit. More likely, a long-lasting process appears to be prevalent, whereby periodically or episodically ascending bright material from a subsurface reservoir was deposited, expelled from fractures, and extruded onto the surface, forming the present-day central dome. Due to isolated bright material on several remnants of the central peak and other elevated regions within the pit, ballistic transport also seems reasonable. Alternatively, these isolated patches of bright material could be the result of a sedimentation process and subsequent pit collapse. However, such a process would require an enormous amount of replenished sub-surface brine to fill most of the pit, whereby the liquid water would evaporate quickly leaving behind carbonates. Both potential modes of bright material deposition may have occurred synchronously or asynchronously and completely buried the dark central peak material near the source vent(s) within the central pit. Beside the dome, the deposition of bright material beyond the central pit, where bright material thickness decreases with increasing distance from the center, is indicative of an extrusive and/or eruptive process along fractures or conduits. This notion is supported by the detection of unusual light scattering at the central floor that is attributed to haze development (Nathues et al. 2015a; Thangjam et al. 2016). One of the major remaining questions is about the processes leading to the past activity on the surface and the extended period of activity in the central pit more than ∼30 million years after crater formation.
According to several evolution models (e.g., Castillo-Rogez 2011; Travis et al. 2015) Ceres today contains large amounts of H2O in the form of an icy mantle and a large liquid reservoir ("ocean") at depth. The icy mantle probably contains fine-grained carbonaceous chondritic material captured during slow freezing of a convecting liquid shell, whereas the solid fraction of Ceres' core is composed of more coarse-grained carbonaceous chondritic particles (consolidated fragments, chondrules) gravitationally driven into an early core (Neveu & Desch 2015 and references therein). Upon heat loss to space and decay of short-lived and long-lived radio-nuclides (e.g., Travis et al. 2015), an ice-rich outer shell developed and the mass of residual liquid decreased while solute concentrations increased, finally resulting in a high-salinity brine layer or isolated lenses (Nathues et al. 2016). Due to its elevated density, the brine layer must be located between a muddy icy mantle and a silicate-rich core. Fines, early and continuously precipitated phases, carbonates like CaCO3, and patches of brine got trapped in the growing ice-rich shell. Due to continuous accumulation of exogenic material and continuous loss of water by sublimation, a surface lag layer of dark material formed and gradually thickened, protecting the water ice (or brine) from instantaneous sublimation (Figure 10). Inclusions of brine may have also sublimated during this process, leading to the precipitation of dissolved solids in the mechanically disturbed subsurface ice layer. This kind of cementation may contribute to the brittle behavior of the upper crust which differs from Ceres' plastically deforming icy mantle. The solute composition of Ceres' brine can be predicted only qualitatively: the mineralogy of carbonaceous chondrites is dominated by serpentine minerals including cronstedtite (Takir et al. 2013) together with olivine, pyroxenes, accessory carbonates and a large variety of subordinate phases. The major elemental constituents of CM chondrites, specifically Si4+, Al3+, ferrous and ferric iron, and Mg2+ are largely bound in ferrogmagnesian silicates, whereas other major cations, such as Ca2+, Na+,  , NH4+ are not incorporated into these minerals and can be assumed to be more readily incorporated into the developing high-salinity brine, along with Cl- and probably SO2-4. In an attempt to model the geochemical composition of such brines, Neveu & Desch (2015) found that a complex brine composition could form Mg–Fe-rich sheet silicates (including saponite and ammoniated clays) along with carbonates in the crust and on the surface of Ceres. Besides water, methane and carbon dioxide are probably the most abundant gas species dissolved in the pressure regime between the core and icy mantle. Regardless of the mechanism that produces ascending high-salinity brines, the salt minerals observed at Occator's bright areas require the precipitation of solutes upon sublimation of water. The latter can be triggered by larger impacts where the upper crust is mechanically disturbed such that deep-seated brines are enabled to ascend closer to the surface. The sub-surface brine is probably the cause for the bouguer (-gravity) anomaly at Hanami Planum where Occator is located (Park et al. 2016). The pressure release caused by this upward movement produces significant H2O losses, thereby oversaturating the liquid in carbonate and chloride minerals. Before the onset of sublimation, methane and carbon dioxide would exsolve from the solution, form vent systems, and escape through those vents along with relatively large proportions of water vapor (Figure 10). Episodic tapping of the hypersaline liquid by pressure release is probably an explanation for the formation of a rather thick salt deposit in the central pit.

Figure 10. Ceres' upper crust, ice and brine layers. The presented stratigraphy is in accordance with Nathues et al. (2016). The upper crust is made of dark carbonaceous chondritic like material rich in phyllosilicates (brown) intercalated with ice (light brown). Past endogenic activity at Occator was likely triggered by the introduced kinetic and thermal energy that lowered substantially the viscosity of subsurface ice (light gray). Underlying brine (light blue) ascended through vents which formed by exsolution of gas phase(s) (e.g., CO2, CH4). Brines finally reached the surface at the central pit, thereby losing the solvent (H2O) and precipitating the dissolved solutes (carbonates, and possibly other salt minerals; red areas). Small volumes of brine also migrated upwards along cracks reaching the surface and precipitating salts. Today water-ice sublimates at bright spot locations in Occator and cause a thin haze layer during daytime.
Download figure:
Standard image High-resolution imageHowever, the current weak activity of the secondary spots (Nathues et al. 2015a; Thangjam et al. 2016), is likely mainly driven by water-ice sublimation, entraining bright and dark material particles and near-vent deposition. This rather low activity takes place mainly in the vicinity of fractures from which the material originates.
Concentration and distribution of fractures at the SW portion of Occator indicate updoming and minor subsidence, probably as the result of thermal expansion (i.e., cooling of brines) and subsurface material removal. However, we note that the updoming effect is less than about 10 m (Figure 4). This is an indication of floor subsidence due to differential mass loading and wasting via the bright spots.
7. Conclusions
The central bright spot at Occator is about 30 Myr younger than the crater itself. This spot is located in a central pit, containing a central dome of ∼0.4 km height. The pit region is remarkably bright, showing reflectances >0.3 at 0.55 μm. The dome is spectrally homogenous, exhibiting absorption features that are consistent with carbonates. Multiple fractures across the dome indicate an extrusive nature. The vicinity of the dome displays a progressive material mixing between the bright carbonates and the dark pit and floor materials, which are spectrally close in composition to the average Ceres material. While the presence of the ∼3.4 μm carbonate absorption band in floor and in average Ceres materials is uncertain, the common presence of the ∼3.4 μm and ∼3.9 μm carbonate absorptions for the brightest sites in Occator is confirmed. Due to the signal-to-noise limitations of the VIR spectra, the type of carbonate proposed to be present in bright spot material(s) (De Sanctis et al. 2016) cannot be reproduced and confirmed.
Crater-based age determination of the various lithological units in Occator along with their morphologies and compositions led us to conclude that the floor region was subject to earlier and long-lasting activity. The central dome and bright material in its vicinity formed due to a long-lasting, periodic, or episodic ascent of bright material from a subsurface reservoir expelled through fractures or otherwise extruded onto the surface. Originally triggered by the Occator impact event, possibly methane and carbon dioxide originally dissolved from a region deep within Ceres, exsolved from brines and forced materials rich in carbonates to ascend toward the surface.
The Dawn spacecraft will orbit and monitor Ceres closer to perihelion passage, and thus increased activity due to sublimation processes might become clearly verifiable, as inferred by Küppers et al. (2014).
We thank the Dawn operations team for the development, cruise, orbital insertion, and operations of the Dawn spacecraft at Ceres. Also we would like to thank the Framing Camera operations team, especially P.G. Gutierrez-Marques, J. Ripken, I. Hall and I. Büttner. The Framing Camera project is financially supported by the Max Planck Society and the German Space Agency (DLR).
Appendix:

Figure 11. Crater-based model ages of selected units within Occator crater. The top panel shows the extent of the counting areas (blue outline) for the large debris avalanche deposit (lobate unit l, Figure 3) and the bright material (unit b, Figure 3) within the central pit (Cerealia Facula). Mapped craters are marked as red circles. The lower panels highlight the crater size–frequency distributions in a reverse logarithmic cumulative (left) and differential (right) plot. Data for the bright and lobate materials are shown in green and black, respectively. Upper insets represent the Monte Carlo-based randomness analysis for each crater population using the mean second-closest-neighbor distance (M2CND) and the standard deviation of adjacent areas (SDAA) methods with 500 iterations (iters).
Download figure:
Standard image High-resolution image
Footnotes
- 5
IAU approved diameter and center coordinate.
- 6
This reference site is about 200 km SW of Occator and is representative of the background.
- 7
In order to increase the detectability of absorption bands the VIR spectra have been smoothed by a running 3 pixel-wide boxcar.