


ABSTRACT
We provide a set of stellar evolution and nucleosynthesis calculations that applies established physics assumptions simultaneously to low- and intermediate-mass and massive star models. Our goal is to provide an internally consistent and comprehensive nuclear production and yield database for applications in areas such as presolar grain studies. Our non-rotating models assume convective boundary mixing (CBM) where it has been adopted before. We include 8 (12) initial masses for Z = 0.01 (0.02). Models are followed either until the end of the asymptotic giant branch phase or the end of Si burning, complemented by simple analytic core-collapse supernova (SN) models with two options for fallback and shock velocities. The explosions show which pre-SN yields will most strongly be effected by the explosive nucleosynthesis. We discuss how these two explosion parameters impact the light elements and the s and p process. For low- and intermediate-mass models, our stellar yields from H to Bi include the effect of CBM at the He-intershell boundaries and the stellar evolution feedback of the mixing process that produces the  pocket. All post-processing nucleosynthesis calculations use the same nuclear reaction rate network and nuclear physics input. We provide a discussion of the nuclear production across the entire mass range organized by element group. The entirety of our stellar nucleosynthesis profile and time evolution output are available electronically, and tools to explore the data on the NuGrid VOspace hosted by the Canadian Astronomical Data Centre are introduced.
Export citation and abstract BibTeX RIS
1. INTRODUCTION
All elements heavier than H can be formed in stars and their outbursts. Understanding the processes that have lead to the abundance distribution in the solar system is one of the fundamental goals of stellar nucleosynthesis and galactic astronomy. The solar system abundance distribution has been formed through nucleosynthesis in several generations of different stars. Despite significant progress, details regarding the chemical evolution of the Galaxy remain poorly understood (e.g., Tinsley 1980; Timmes et al. 1995; Goswami & Prantzos 2000; Travaglio et al. 2004; Gibson et al. 2003; Kobayashi et al. 2006). This makes understanding the origin of the solar abundances challenging. Complete, metallicity-dependent stellar yields would provide part of the answer, but the respective contribution from different stellar sources depends on the dynamical evolution of the Galaxy. The analysis of spectroscopic observations of unevolved stars in the local disk of the Galaxy carries a similar degeneracy to the analysis of stellar nucleosynthesis. The observation of evolved low- and intermediate-mass stars (e.g., Busso et al. 2001; García-Hernández et al. 2006; Abia et al. 2010, 2012; Hernandez et al. 2012) and of the ejecta of core-collapse supernova (CCSN; e.g., Isensee et al. 2010, 2012; Kjær et al. 2010; Hwang & Laming 2012) can provide information about the intrinsic nucleosynthesis of these objects and constrain some of the modeling uncertainties.
A closer source of information about stellar nucleosynthesis processes is hidden in primitive meteorites. Small dust grains of presolar origin—which were produced in ancient stars whose lives ended before the formation of our solar system—can be found on Earth preserved in meteorites (Bernatowicz et al. 1987; Lewis et al. 1987; Amari et al. 1990; Bernatowicz et al. 1991; Huss et al. 1994; Nittler et al. 1995; Choi et al. 1999). These are assumed to carry a relatively unmodified nucleosynthesis signature from the environments of their parent stars (e.g., Zinner 2003; Clayton & Nittler 2004).
Stars with different initial masses and metallicities contribute in different ways to the production of elements. Low- and intermediate-mass stars contribute to the chemical evolution of the interstellar medium over longer timescales than massive stars, first during the advanced hydrostatic phases via a stellar wind, and (predominantly) late in their lives during the asymptotic giant branch phase (AGB; e.g., Iben & Renzini 1983; Busso et al. 1999; Herwig 2005). These stars also have the possibility of contributing to element production much later in time as Type Ia supernovae (SN Ia; e.g., Nomoto 1984; Timmes et al. 1995; Hillebrandt & Niemeyer 2000; Domínguez et al. 2001; Thielemann et al. 2004; Travaglio et al. 2011; Pakmor et al. 2012; Seitenzahl et al. 2013; Hillebrandt et al. 2013). During the AGB phase, light elements like carbon, nitrogen, and fluorine can be significantly produced, depending on the initial stellar mass, in addition to heavy s-process elements (e.g., Herwig 2004b; Karakas et al. 2010; Bisterzo et al. 2011; Cristallo et al. 2011). In particular, low-mass AGB stars are responsible for the production of the main s-process component in the solar system, explaining the s-process abundances between strontium and lead; they are also responsible for the strong s-process component, which mainly contributes to the solar lead inventory (e.g., Gallino et al. 1998; Travaglio et al. 2001; Sneden et al. 2008).
Massive stars (M ≳ 8  ) provide the first contribution to the elemental chemical evolution owing to their short lifetimes. They produce metals both during their evolution and in the CCSN marking their deaths. During their evolution, massive stars contribute to the chemical enrichment of the interstellar medium via winds; in these winds it is predominantly light elements up to silicon that are released (for instance, carbon and nitrogen, which are H- and He-burning products; see, e.g., Meynet et al. 2006). Most α-elements up to the iron group are produced during the advanced evolutionary stages (e.g., Thielemann & Arnett 1985) and/or by the final CCSN (e.g., Woosley & Weaver 1995; Thielemann et al. 1996; Rauscher et al. 2002). Massive stars are also the main site for the weak s process (e.g., Käppeler et al. 2011). The weak s-process component (forming most of the s-process abundances in the solar system between iron and strontium; e.g., Travaglio et al. 2004) is produced during convective core He burning and convective shell C-burning stages (e.g., Raiteri et al. 1991a, 1991b; The et al. 2007; Pignatari et al. 2010). Since the s-process yields from massive stars are mostly ejected during the CCSN explosion, partial or more extreme modifications triggered by explosive nucleosynthesis need to be considered for these elements (e.g., Thielemann et al. 1996; Rauscher et al. 2002). One example is the classical p process (also known as the γ process) which forms proton-rich nuclei due to the photo-disintegration of s-process products in deep s-process-rich layers (Arnould & Goriely 2003).
The s process is responsible for about half of the abundances of trans-iron elements in the solar system. The r process is responsible for the production of a majority of the remaining abundances; however, there are some distinct discrepancies between the predictions from the r-process residual method (e.g., Arlandini et al. 1999) and direct observations of elemental abundances of metal-poor, r-process-rich stars (Sneden et al. 2008; Roederer et al. 2010). The astrophysical source of the r process has been associated with neutrino-driven winds during CCSN events, merging of their remnants or in jets from magnetorotationally driven SNe (e.g., Kratz et al. 2008; Thielemann et al. 2011; Winteler et al. 2012; Perego et al. 2014). The scenarios in which the conditions for r process nucleosynthesis are postulated to arise are the neutrino-induced winds from the CCSNe either before the formation of the reverse shock (e.g., Woosley et al. 1994; Wanajo et al. 2001; Farouqi et al. 2010) or after fallback has begun (e.g., Fryer et al. 2006; Arcones et al. 2007), polar jets exuding from rotating magneto-hydrodynamical explosions of CCSNe (Nishimura et al. 2006), and neutron-rich matter ejected from merging neutron stars (Freiburghaus et al. 1999) and neutron-star-black hole mergers (Surman et al. 2008). For a review of the different scenarios and recent r-process results, see Thielemann et al. (2011), Winteler et al. (2012), and Korobkin et al. (2012).
Many applications in astronomy and meteoritics require stellar yield and nuclear production data. Presently, for AGB stars one may use the yields of Karakas (2010b), which are available for a suitable range of metallicities and initial masses but are limited to providing only the light elements. Heavy element predictions for elemental compositions based on the parameterized post-processing method are available from Bisterzo et al. (2010). s-process yields from stellar evolution models are available for a wide range of metallicities from the FRUITY database (Cristallo et al. 2011, 2015). These yields are limited to low-mass stars ( ), except for low metallicities where models up to M = 6
  are included (Straniero et al. 2014). For super-AGB stars, there is a much more limited amount of choice and while one may use the models of Siess (2010) and Doherty et al. (2014), the yields for heavy elements are not provided. Several choices are available for massive star yields (e.g., Woosley & Weaver 1995; Chieffi & Limongi 2004; Nomoto et al. 2006). These different investigators have used different assumptions for the stellar micro-physics (e.g., opacities and nuclear reaction rates) and macro-physics (e.g., mixing assumptions and mass loss); the method with which the numerical solution to the equations of stellar evolution are found is also a factor that one cannot ignore. Thus, yield tables stitched together from a range of sources such as these do not only suffer from the inevitable uncertainties in many of the ingredients required for such calculations (see, e.g., Romano et al. 2010; Few et al. 2014; Mollá et al. 2015), but also from a significant internal inconsistency. This introduces an additional degree of degeneracy in the feedback obtained from galactical chemical evolution studies about the physics and the assumptions implemented in stellar models.
The NuGrid research platform aims to address this issue by providing different sets of stellar yields to be used for galactic chemical evolution (GCE), nuclear sensitivity and uncertainty studies, and direct comparison with stellar observations. Each set will represent adequate coverage of low-mass, intermediate-mass, and massive star models for a given set of physics assumptions and using the same modeling codes for all masses. In this work, we present our first step toward achieving these goals. The first set of stellar models and their yields in the NuGrid production flow (Set 1) includes a grid of stellar masses from 1.65 to 60 M⊙ at metallicity Z = 0.02, and from 1.65 to 25 M⊙ at metallicity Z = 0.01. Even though two different codes are still used in this study for massive stars and for low- and intermediate-mass stars, the same initial abundances, nuclear reaction rates, and opacity tables are used (see Section 2 for more details). Most importantly, the stellar models are post-processed with the same nucleosynthesis post-processing code. This allows us to compare the nucleosynthesis results from different stellar codes, disentangle nuclear physics uncertainties from stellar uncertainties, and infer about the impact of a number of approximations that have to be made in one-dimensional (1D) stellar codes (e.g., Jones et al. 2015; Lattanzio et al. 2015).
Our massive star simulations include 1D simplified CCSN models which are used in order to qualitatively study explosive nucleosynthesis. While other studies may have adopted a more realistic approach to the problem of explosive nucleosynthesis, the uncertainties and limits of simulation capabilities of CCSN nucleosynthesis in 1D remain a significant obstacle (see, e.g., discussion in Roberts et al. 2010; Ertl et al. 2016; Perego et al. 2015). Our goal is to provide an estimate of the explosive contribution to stellar yields, including a general understanding on how pre-explosive abundances are modified by the explosion (e.g., Woosley & Weaver 1995; Limongi et al. 2000; Rauscher et al. 2002; Nomoto et al. 2006). Therefore, the explosive supernova (SN) yields presented in this work can be used for GCE calculations and for direct comparison with observations (e.g., Pignatari et al. 2015), but keeping in mind their intrinsic limitations.
Together, the stellar models represent the stellar evolution and explosion (SEE) library and all of these models are then post-processed using mppnp to calculate the nucleosynthesis during the evolution of each model, which comprises the post-processing data (PPD) library. The SEE and PPD libraries associated with Set 1 and with this work are available (see Appendix
Simulations for super-AGB stars (e.g., Siess 2007; Poelarends et al. 2008; Doherty et al. 2010; Ventura & D'Antona 2011; Doherty et al. 2014), electron-capture SNe (e.g., Nomoto 1984; Hoffman et al. 2008; Wanajo et al. 2009), SN Ia (e.g., Hillebrandt & Niemeyer 2000; Seitenzahl et al. 2013), and r process (Thielemann et al. 2011; Winteler et al. 2012; Kratz et al. 2014; Nishimura et al. 2015) are not included in this work. The paper is organized as follows: in Section 2 the stellar evolution codes and CCSN models are described, and in Section 3 we present the post-processing calculations and the stellar yields of Set 1. Finally, in Section 4, we summarize the main conclusions of this work and discuss future prospects. Details regarding the physics assumption and published data can be found in Appendices
2. STELLAR EVOLUTION CALCULATIONS
The stellar evolution models for Set 1 were calculated with two stellar evolution codes, MESA and GENEC. MESA (described in detail in Paxton et al. 2011), revision 3372, was used for low- and intermediate-mass stars while GENEC (Eggenberger et al. 2008; Bennett et al. 2012; Pignatari et al. 2013) was used for massive stars. GENEC is a well established research and production code for simulating the evolution of stars (massive stars in particular), but is not designed to simulate in detail the complex thermal pulse (TP) evolution and nucleosynthesis during the AGB phase. On the other hand, MESA calculations have been shown to produce results that are quantitatively consistent with established stellar evolution codes that are designed specifically to simulate the evolution of AGB stars (e.g., EVOL; Herwig 2004b; Paxton et al. 2011). Models of non-rotating massive stars calculated using the MESA code provide results that are overall consistent with other stellar evolution codes, including GENEC (Paxton et al. 2011, 2013). A detailed analysis comparing different stellar codes is provided by Sukhbold & Woosley (2014) and Jones et al. (2015); Jones et al. (2015) also explored the impact of those differences on the nucleosynthesis until the end of central He burning.
Set 1 includes models at two metallicities: Z = 0.02 (Set 1.2) and Z = 0.01 (Set 1.1). Set 1.2 includes models with initial masses M = 1.65, 2, 3, 4, 5, 15, 20, 25, 32, 60  and Set 1.1 includes models with initial masses M = 1.65, 2, 3, 4, 5, 15, 20, 25
  . In particular, the M = 1.65
  stars are low-mass stars, the M = 2, 3, 4, and 5
  stars are intermediate-mass stars, and the M = 15, 20, 25, 32, 60
  stars are massive stars (Herwig 2005). The main input physics used in the models is described below. Note that the models do not include the effects of rotation and magnetic fields.
2.1. Input Physics
The massive star models computed using GENEC were calculated with the same input physics as the MESA low- and intermediate-mass models wherever possible. The main differences in the input physics between the two codes are concerned with the treatment of convective boundary mixing (CBM) and the prescriptions for mass loss; the differences are described in the corresponding sections below. Improvements in input physics such as updated solar composition from Asplund et al. (2009), low-temperature opacities from Marigo & Aringer (2009), and rotation (Ekström et al. 2012) and magnetic fields (e.g., Heger et al. 2005) were not included in these calculations for two main reasons. The first is to be able to compare to past results (e.g., Schaller et al. 1992; Woosley & Weaver 1995). The second is to provide a basic set of yields that will provide a standard of comparison for future grid of yields including these improvements in input physics.
2.1.1. Initial Composition and Opacities
In this work, the initial element abundances are scaled to Z = 0.01 and Z = 0.02 from Grevesse & Noels (1993) and the isotopic percentage for each element is given by Lodders (2003). The initial composition corresponds directly to the OPAL Type 2 opacity tables that were used in both MESA and GENEC for the present work (Rogers et al. 1996). For low temperatures outside of the OPAL domain, the opacities from Ferguson et al. (2005) are used.
2.1.2. Nuclear Reaction Network and Rates
In MESA, the agb.net nuclear reaction network was used, which includes the p-p chains, the CNO cycles, the triple-α reaction, and the following α-capture reactions:  (α, γ)
 ,
,  (α, γ)
 (e+, ν)
 ,
,  (α, γ)
 ,
,  (α, n)
 , and
, and  (α, p)
 . In particular, we assume that the He-shell flash convection is dominated by the triple-α reaction, and we did not consider the
  +α reactions.
GENEC also includes the main reactions for the hydrogen and helium-burning phases and in addition accounts for the fusion of carbon, the fusion of oxygen, and an α-chain network for the neon-, oxygen-, and silicon-burning phases. The following isotopes are included in the network explicitly:  ,
,  ,
,  ,
,  ,
,  ,
,  ,
,  ,
,  ,
,  ,
,  ,
,  ,
,  ,
,  ,
,  ,
,  ,
,  ,
,  ,
,  ,
,  ,
,  ,
,  ,
,  ,
,  . Note that additional isotopes are included implicitly to follow the p-p chains, CNO tri-cycles, and the combined (α, p)–(p, γ) reactions in the advanced stages.
In both codes, most of the reaction rates were provided by the NACRE compilation (Angulo et al. 1999). There are, however, a few exceptions that should be clarified. In GENEC, the rate of Mukhamedzhanov et al. (2003) was used for  (p,γ)
(p,γ) below 0.1 GK and the lower limit NACRE rate was used for temperatures above 0.1 GK. This combined rate is very similar to the more recent LUNA rate (Imbriani et al. 2004) at relevant temperatures, which was used in MESA. In both codes, the Fynbo et al. (2005) rate was used for the triple-α reaction and the Kunz et al. (2002) rate was used for
  (α, γ)
 . In GENEC, the
  (α, n)
 rate was taken from Jaeger et al. (2001) and used for T ≤ 1 GK; the NACRE rate was used for higher temperatures. The
  (α, n)
 rate competes with
  (α, γ)
 , where the NACRE rate was used The key reaction rates responsible for the energy generation are the same for the high- (GENEC) and intermediate- and low-mass (MESA) stellar models.
2.1.3. Mass Loss
For the low- and intermediate-mass stellar models, we adopted in MESA the Reimers mass-loss formula (Reimers 1975) with  for the RGB phase. For the AGB phase we used the mass-loss formula from Blöcker (1995) with
  for the O-rich phase. During the TP phase, carbon is recurrently mixed into the stellar envelope from the helium intershell by the third dredge-up. Once the surface C/O ratio exceeds about 1.15, we increased the mass-loss parameters to
  for the 1.65 and 2 M⊙ tracks and to
  for the 3
  tracks. This choice is motivated by observational constraints on the maximum level of C enhancement seen in C-rich stars and planetary nebulae (Herwig 2005), as well as by hydrodynamics simulations investigating mass-loss rates in C-rich giants (e.g., Mattsson et al. 2010; Mattsson & Höfner 2011). In order to explore the influence of the Mattson mass-loss rate for C-stars, we have calculated some preliminary stellar evolution tracks, and the mass-loss parameters were chosen to reflect findings from these tests (L. Mattsson et al. 2016, in preparation). The choice to enhance the mass-loss rate is also motivated by considering counts of C- and O-rich stars in the Magellanic Clouds (e.g., Marigo & Girardi 2007), which together indicate that the C-rich phase cannot last for more than at most a dozen TPs. While the Magellanic Clouds are more metal-poor than the AGB models considered here, theoretical hydrodynamics calculations by Mattsson et al. (2008) and observations of AGB stars in the galactic halo (e.g., Lagadec et al. 2012) and in metal-poor galaxies (e.g., Sloan et al. 2009) including the Magellanic Clouds (Groenewegen et al. 2009) indicate that mass-loss rates in the final C-rich AGB phase should not significantly change with metallicity. We refer to Nanni et al. (2013), Karakas & Lattanzio (2014), and Straniero et al. (2014) for more details.
The 5  tracks are dominated by hot-bottom burning (HBB) and do not become C-rich. We adopt
  from the beginning of the AGB phase for the models tracks with this mass.
For massive star models, several mass-loss rates are used depending on the effective temperature  and the evolutionary stage of the star in GENEC. For main-sequence massive stars where
  , mass-loss rates are taken from Vink et al. (2001). Otherwise the rates are taken from de Jager et al. (1988). For lower temperatures (
 ), however, a scaling law of the form
is used, where  is the mass-loss rate in
  yr−1 and L is the stellar luminosity. During the Wolf–Rayet (W–R) phase, mass-loss rates by Nugis & Lamers (2000) are used.
2.1.4. Convective Boundary Mixing
The Schwarzschild criterion was used in all models (MESA & GENEC) for the placement of the convective boundary. The MESA code allows for the exponential diffusive CBM or overshooting introduced by Herwig et al. (1997) based on hydrodynamic simulations by Freytag et al. (1996). More recent hydrodynamic simulations of He-shell flash convection zone also show convection-induced mixing at convective boundaries (Herwig et al. 2007, 2006). The nature of the instabilities observed in the deep interior, however, is different than the buoyancy-driven overshooting situation found in shallow surface convection studies by Freytag et al. (1996). We therefore refer to our exponentially decaying mixing model at the convective boundary rather as CBM which may represent a variety of physical processes causing mixing across the Schwarzschild boundary. Treating the CBM as a diffusive processes may be justified in the case of the formation of  pocket if the physics processes of internal gravity waves (Denissenkov & Tout 2003) applies. If the mixing process is more hydrodynamic in nature, an advection scheme may be more appropriate.
In MESA models, a CBM efficiency of  was used at all boundaries, except during the dredge-up, when
  was used to generate a
  -pocket for the s-process according to Herwig et al. (2003), and
  (where PDCZ stands for pulse-driven convective zone) was used at the bottom of the He-shell flash convection zone. Because of the latter choice, our models reproduce the observational constraints, especially the O mass fraction of ≈0.1–0.15, from H-deficient, post-AGB stars (Werner & Herwig 2006). This approach was followed as well by Miller Bertolami et al. (2006). AGB simulations without CBM at the bottom of the PDCZ have so far not been able to reproduce the abundance of H-deficient, post-AGB stars which show the exposed intershell of the former AGB star. Detailed AGB models adopting this CBM treatment have been presented by Weiss & Ferguson (2009) and their models show generally good agreement with our models (Section 2.2). Kamath et al. (2012) find that it is possible to explain the observed C/O and C isotopic ratios for AGB stars when adopting intershell abundances of models with CBM at the bottom of the PDCZ, for at least one globular cluster of the Magellanic Cloud. CBM at the bottom of the He-shell flash convection zone is supported by hydrodynamic simulations (Herwig et al. 2007).
The core overshooting value for the 1.65 M⊙ case is one-half of the value appropriate for higher masses, as motivated by the investigation of VandenBerg et al. (2006) using star cluster data on low-mass stars.
In GENEC, convective mixing is treated as instantaneous from hydrogen up to neon burning. From oxygen burning onwards (since the evolutionary timescale is becoming too small to justify the instantaneous mixing assumption), convective mixing in GENEC is treated as a diffusive process as is the case at all times in the MESA calculations. In GENEC overshooting is only included for hydrogen- and helium-burning cores, where an overshooting parameter of  is used as in previous non-rotating grids of models (Schaller et al. 1992).
A recent comparison between MESA and GENEC can be found in Jones et al. (2015), where  was used in MESA to match the
  in GENEC. For this study, we initially planned to use the EVOL code (Herwig 2000) for the low-mass models. We compared convective cores with overshooting in 9
  stellar models from the GENEC code and the EVOL code to ensure that convective core sizes are matching at the transition mass. For the EVOL code,
  matched approximately the GENEC model with
  . For stars around 2
  it was determined by Paxton et al. (2011) that
  matches observational constraints of the main-sequence width in MESA models, and we have adopted this value for main-sequence core convection in our MESA low- and intermediate-mass models. CBM and its dependence on initial mass is still uncertain but there is support for an overshooting efficiency that broadly increases with initial mass (Deupree 2000). The overshooting efficiencies adopted here for AGB and massive stars are well within the range of values used in the literature; see, e.g., Martins & Palacios (2013).
2.1.5. Additional  Code Information

The low- and intermediate-mass models (1.65, 2, 3, 4, and 5  ) have been calculated with the MESA code (rev. 3372), for which a comprehensive code description and comparison (including GENEC for massive stars) is provided by Paxton et al. (2011). Concerning stellar evolution before and during the AGB phase, results from MESA have been compared in detail to results obtained with the EVOL stellar evolution code (e.g., Blöcker 1995; Herwig 2000, 2004b). In particular, the 2
  , Z = 0.01 MESA stellar model has been compared to the corresponding track of Herwig & Austin (2004) from the pre-main-sequence to the tip of the AGB by Paxton et al. (2011). The two stellar models share a similar evolution in the H–R diagram, and key properties such as main-sequence lifetime and age at first TP, H-free core mass at the end of He-core burning and core mass at first TP differ by less than 5%. During the AGB, a similar occurrence and efficiency of third dredge-up, interpulse periods, and evolution of C/O ratio in the AGB envelope as well as subsequent C-star formation are obtained (Paxton et al. 2011).
The following settings were used in MESA.
- 1.Structure, nuclear burning, and time-dependent mixing operators were always solved together using a joint operator method.
- 2.In addition to the default MESA mesh refinement, enhanced resolution was applied in regions with gradients in H,, , and in order to resolve the pocket during the entire interpulse time. This is needed to accurately follow s-process nucleosynthesis.
- 3.The mixing-length parameter used is, as calibrated for a solar model.
- 4.Additional timestep controls are used to allow for sufficient resolution of the He-shell flashes as well as the evolution of the thin H-burning shell during the interpulse evolution.
- 5.OPAL Type 2 opacity tables (Rogers et al. 1996).
- 6.The atmosphere option simple_photosphere.


2.2. Stellar Evolution Tracks
The H–R diagram for low-mass and intermediate-mass stellar models is shown in Figure 1, and the evolution of central temperature and density in Figure 2. In Figure 3 we also show, as an example, the Kippenhahn diagram for the 3  , Z = 0.02 model. The final core masses and lifetimes calculated for all low-mass and intermediate-mass stellar models are shown in Table 1.
The main features during the AGB evolution are summarized in Tables 2–5. The AGB surface luminosity and temperatures at the bottom of the convective envelope are given in Figures 4 and 7. The 3 and 4
, Z = 0.02 model. The final core masses and lifetimes calculated for all low-mass and intermediate-mass stellar models are shown in Table 1.
The main features during the AGB evolution are summarized in Tables 2–5. The AGB surface luminosity and temperatures at the bottom of the convective envelope are given in Figures 4 and 7. The 3 and 4  models with Z = 0.02 have average luminosities of 11,000
  and 20,000
  , respectively. This is in good agreement with the results of Herwig et al. (1998) obtained with the EVOL code.
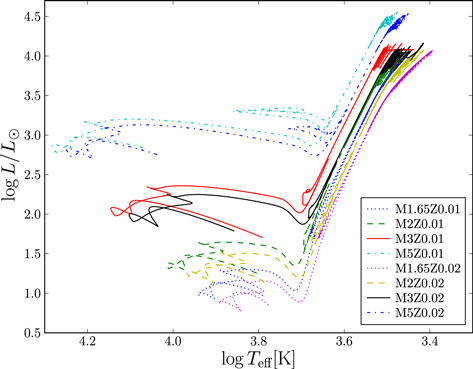
Figure 1. H–R diagram for low- and intermediate-mass models. Labels give the initial stellar mass followed by "S1" for Set 1.1 models (Z = 0.01) and "S2" for Set 1.2 models (Z = 0.02). Toward the end of the sequence, the tracks show wide loops, indicating an instability toward the end of the evolution that has been omitted from the plot for clarity (see the text for details).
Download figure:
Standard image High-resolution image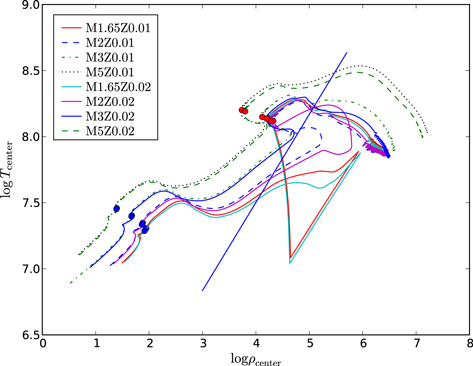
Figure 2. Central temperature, Tc, as a function of central density, ρc, for low-mass and intermediate-mass models from Set 1. The labels indicate initial mass and metallicity as in Figure 1. H- and He-ignition points for the core burning stages are indicated by blue and red colored points, which are determined at the point when the principal fuel is depleted by 1% from its maximum value.
Download figure:
Standard image High-resolution image
Figure 3. Top panel: Kippenhahn diagram of  stellar evolution calculation with Z = 0.02 from the pre-main-sequence to the end of the TP-AGB evolution. The position of convection zones and mass coordinates of the H- and He-free cores are shown as a function of the logarithm of the time left until the end of the TP-AGB. Bottom panel: zoom-in of top panel, showing the sequence of thermal pulses.
Download figure:
Standard image High-resolution image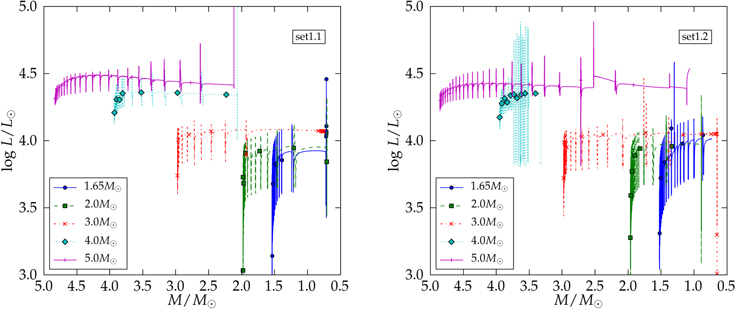
Figure 4. AGB luminosities of Set 1.1 and Set 1.2.
Download figure:
Standard image High-resolution imageTable 1. Final Core Masses Mfinal for the Set 1.2 and Set 1.1 AGB Stellar Models in Solar Mass Units, and Total Lifetime τtotal, Specified in Units of Years
| Set 1.2 Z = 0.02 | ||
|---|---|---|
| Initial Mass | MFinal | τtotal |
| 1.65 | 0.651 | 2.27 × 10⁹ |
| 2 | 0.620 | 1.42 × 10⁹ |
| 3 | 0.642 | 4.82 × 10⁸ |
| 4 | 0.818 | 2.15 × 10⁸ |
| 5 | 0.877 | 1.17 × 10⁸ |
| Set 1.1 Z = 0.01 | ||
| Initial Mass | MFinal | τtotal |
| 1.65 | 0.621 | 1.87 × 10⁹ |
| 2 | 0.621 | 1.28 × 10⁹ |
| 3 | 0.659 | 4.13 × 10⁸ |
| 4 | 0.841 | 1.88 × 10⁸ |
| 5 | 0.910 | 1.08 × 10⁸ |
Download table as: ASCIITypeset image
Table 2. Main Features for the Set 1.2 AGB Models
| Set 1.2 Z = 0.02 | ||||||||||
|---|---|---|---|---|---|---|---|---|---|---|
| Mini | mc | R* | NTP | N3DUP | tTPI | ΔMDmax | MD | tip | Mlost |

|
| (M⊙) | (M⊙) | (R⊙) | (106 years) | (10−2 M⊙) | (10−2 M⊙) | (years) | (M⊙) | (K) | ||
| 1.65 | 0.530 | 237 | 23 | 6 | 2.270E+03 | 0.3 | 0.751 | 90864 | 0.87 | 8.441 |
| 2.00 | 0.510 | 220 | 24 | 13 | 1.415E+03 | 0.5 | 4.230 | 116763 | 1.35 | 8.458 |
| 3.00 | 0.596 | 309 | 23 | 20 | 4.807E+02 | 0.7 | 9.747 | 57700 | 2.34 | 8.473 |
| 4.00 | 0.809 | 536 | 25 | 24 | 2.148E+02 | 0.4 | 6.522 | 10658 | 3.13 | 8.531 |
| 5.00 | 0.865 | 593 | 25 | 24 | 1.168E+02 | 0.2 | 3.715 | 5747 | 3.98 | 8.535 |
Notes.
Mini: initial stellar mass.
mc: H-free core mass at the first TP.
R*: approximated mean radius.
NTP: number of TPs.
N3DUP : number of TPs with 3DUP.
tTPI: time at first TP.
ΔMDmax: maximum dredged-up mass after a single TP.
MD: total dredged-up mass of all TPs.
tip : average interpulse duration of TPs.
Mlost: total mass lost during the evolution.
TPDCZ,max: maximum temperature during the TPAGB phase.
Download table as: ASCIITypeset image
Table 3. Main Features for the Set 1.1 AGB Models
| Set 1.1 Z = 0.01 | ||||||||||
|---|---|---|---|---|---|---|---|---|---|---|
| Mini | mc | R* | NTP | N3DUP | tTPI | ΔMDmax | MD | tip | Mlost | TPDCZ,max |
| (M⊙) | (M⊙) | (R⊙) | (106 years) | (10−2 M⊙) | (10−2 M⊙) | (years) | (M⊙) | (K) | ||
| 1.65 | 0.533 | 209 | 17 | 5 | 1.871E+03 | 0.2 | 0.901 | 109775 | 0.92 | 8.444 |
| 2.00 | 0.498 | 173 | 25 | 13 | 1.276E+03 | 0.6 | 4.547 | 145367 | 1.37 | 8.456 |
| 3.00 | 0.646 | 308 | 14 | 13 | 4.123E+02 | 0.8 | 7.425 | 48874 | 2.31 | 8.484 |
| 4.00 | 0.831 | 479 | 20 | 19 | 1.876E+02 | 0.3 | 3.985 | 9169 | 3.09 | 8.530 |
| 5.00 | 0.901 | 559 | 22 | 21 | 1.081E+02 | 0.2 | 2.562 | 4362 | 3.92 | 8.539 |
Notes.
Mini: initial stellar mass.
mc: H-free core mass at the first TP.
R*: approximated mean radius.
NTP: number of TPs.
N3DUP: number of TPs with 3DUP.
tTPI: time at first TP.
ΔMDmax: maximum dredged-up mass after a single TP.
MD: total dredged-up mass of all TPs.
tip: average interpulse duration of TPs.
Mlost: total mass lost during the evolution.
TPDCZ,max: maximum temperature during the TPAGB phase.
Download table as: ASCIITypeset image
Table 4. TPAGB Evolution Properties of Set 1.2
| Set 1.2 Z = 0.02 | |||||||||
|---|---|---|---|---|---|---|---|---|---|
| TP | tTP | TFBOT | THES | THS | TCEB | mFBOT | mHTP |

|
M* |
| (years) | (K) | (K) | (K) | (K) | (M⊙) | (M⊙) | (M⊙) | (M⊙) | |

|
|||||||||
| 1 | 0.00E+00 | 8.32 | 8.17 | 7.66 | 6.30 | 0.4948 | 0.5305 | 0.5315 | 1.521 |
| 2 | 2.14E+05 | 8.34 | 8.20 | 7.62 | 6.31 | 0.4998 | 0.5361 | 0.5365 | 1.521 |
| 3 | 3.31E+05 | 8.29 | 8.14 | 7.71 | 6.37 | 0.5104 | 0.5381 | 0.5401 | 1.520 |
| 4 | 4.40E+05 | 8.39 | 8.20 | 7.66 | 6.35 | 0.5078 | 0.5429 | 0.5432 | 1.519 |
| 5 | 5.53E+05 | 8.37 | 8.18 | 7.70 | 6.39 | 0.5141 | 0.5465 | 0.5469 | 1.517 |
| 6 | 6.65E+05 | 8.39 | 8.20 | 7.70 | 6.39 | 0.5183 | 0.5517 | 0.5519 | 1.514 |
| 7 | 7.77E+05 | 8.41 | 8.20 | 7.71 | 6.41 | 0.5250 | 0.5570 | 0.5573 | 1.510 |
| 8 | 8.85E+05 | 8.39 | 8.20 | 7.71 | 6.41 | 0.5316 | 0.5627 | 0.5629 | 1.505 |
| 9 | 9.88E+05 | 8.40 | 8.20 | 7.72 | 6.41 | 0.5387 | 0.5685 | 0.5686 | 1.498 |
| 10 | 1.09E+06 | 8.41 | 8.20 | 7.72 | 6.40 | 0.5459 | 0.5744 | 0.5745 | 1.488 |
| 11 | 1.18E+06 | 8.42 | 8.20 | 7.72 | 6.41 | 0.5531 | 0.5803 | 0.5804 | 1.477 |
| 12 | 1.27E+06 | 8.42 | 8.20 | 7.73 | 6.41 | 0.5604 | 0.5863 | 0.5863 | 1.462 |
| 13 | 1.35E+06 | 8.42 | 8.20 | 7.72 | 6.41 | 0.5677 | 0.5923 | 0.5922 | 1.443 |
| 14 | 1.43E+06 | 8.43 | 8.20 | 7.73 | 6.39 | 0.5748 | 0.5983 | 0.5978 | 1.419 |
| 15 | 1.51E+06 | 8.41 | 8.20 | 7.74 | 6.40 | 0.5817 | 0.6041 | 0.6030 | 1.387 |
| 16 | 1.58E+06 | 8.42 | 8.19 | 7.74 | 6.41 | 0.5883 | 0.6095 | 0.6081 | 1.344 |
| 17 | 1.65E+06 | 8.44 | 8.18 | 7.76 | 6.63 | 0.5948 | 0.6148 | 0.6120 | 1.291 |
| 18 | 1.72E+06 | 8.44 | 8.19 | 7.75 | 6.62 | 0.6001 | 0.6192 | 0.6179 | 1.251 |
| 19 | 1.79E+06 | 8.43 | 8.19 | 7.75 | 6.62 | 0.6074 | 0.6244 | 0.6241 | 1.207 |
| 20 | 1.84E+06 | 8.42 | 8.19 | 7.75 | 6.60 | 0.6148 | 0.6302 | 0.6302 | 1.155 |
| 21 | 1.90E+06 | 8.41 | 8.19 | 7.75 | 6.57 | 0.6214 | 0.6360 | 0.6361 | 1.090 |
| 22 | 1.95E+06 | 8.41 | 8.19 | 7.75 | 6.49 | 0.6277 | 0.6418 | 0.6419 | 1.002 |
| 23 | 2.00E+06 | 8.41 | 0.00 | 0.00 | 0.00 | 0.6339 | 0.6475 | 0.0000 | 0.870 |

|
|||||||||
| 1 | 0.00E+00 | 8.33 | 8.17 | 7.64 | 6.32 | 0.4690 | 0.5103 | 0.5113 | 1.963 |
| 2 | 4.24E+05 | 8.36 | 8.19 | 7.65 | 6.37 | 0.4782 | 0.5189 | 0.5194 | 1.963 |
| 3 | 7.09E+05 | 8.36 | 8.21 | 7.63 | 6.33 | 0.4877 | 0.5265 | 0.5269 | 1.962 |
| 4 | 8.45E+05 | 8.35 | 8.18 | 7.68 | 6.39 | 0.4941 | 0.5294 | 0.5303 | 1.962 |
| 5 | 9.67E+05 | 8.39 | 8.20 | 7.67 | 6.40 | 0.4964 | 0.5341 | 0.5345 | 1.961 |
| 6 | 1.09E+06 | 8.39 | 8.20 | 7.69 | 6.41 | 0.5021 | 0.5388 | 0.5392 | 1.961 |
| 7 | 1.22E+06 | 8.40 | 8.20 | 7.70 | 6.41 | 0.5078 | 0.5441 | 0.5444 | 1.960 |
| 8 | 1.34E+06 | 8.40 | 8.21 | 7.70 | 6.42 | 0.5143 | 0.5497 | 0.5500 | 1.958 |
| 9 | 1.45E+06 | 8.42 | 8.21 | 7.70 | 6.43 | 0.5212 | 0.5554 | 0.5557 | 1.956 |
| 10 | 1.56E+06 | 8.42 | 8.21 | 7.70 | 6.42 | 0.5284 | 0.5613 | 0.5614 | 1.954 |
| 11 | 1.66E+06 | 8.42 | 8.21 | 7.71 | 6.44 | 0.5356 | 0.5670 | 0.5670 | 1.951 |
| 12 | 1.76E+06 | 8.42 | 8.21 | 7.72 | 6.46 | 0.5428 | 0.5728 | 0.5722 | 1.948 |
| 13 | 1.85E+06 | 8.44 | 8.20 | 7.73 | 6.46 | 0.5496 | 0.5782 | 0.5769 | 1.943 |
| 14 | 1.94E+06 | 8.44 | 8.20 | 7.73 | 6.48 | 0.5555 | 0.5834 | 0.5815 | 1.937 |
| 15 | 2.03E+06 | 8.44 | 8.19 | 7.74 | 6.48 | 0.5613 | 0.5878 | 0.5852 | 1.930 |
| 16 | 2.11E+06 | 8.41 | 8.19 | 7.73 | 6.48 | 0.5662 | 0.5921 | 0.5886 | 1.920 |
| 17 | 2.20E+06 | 8.44 | 8.19 | 7.56 | 6.37 | 0.5708 | 0.5957 | 0.5920 | 1.908 |
| 18 | 2.27E+06 | 8.43 | 8.18 | 7.75 | 6.52 | 0.5751 | 0.5988 | 0.5948 | 1.896 |
| 19 | 2.35E+06 | 8.45 | 8.18 | 7.74 | 6.52 | 0.5786 | 0.6023 | 0.5976 | 1.878 |
| 20 | 2.42E+06 | 8.46 | 8.18 | 7.75 | 6.51 | 0.5823 | 0.6050 | 0.6002 | 1.859 |
| 21 | 2.49E+06 | 8.43 | 8.19 | 7.74 | 6.50 | 0.5854 | 0.6074 | 0.6032 | 1.837 |
| 22 | 2.56E+06 | 8.42 | 8.19 | 7.74 | 6.48 | 0.5889 | 0.6101 | 0.6059 | 1.762 |
| 23 | 2.62E+06 | 8.44 | 8.19 | 7.74 | 6.46 | 0.5922 | 0.6130 | 0.6093 | 1.623 |
| 24 | 2.69E+06 | 8.45 | 0.00 | 0.00 | 0.00 | 0.5966 | 0.6159 | 0.0000 | 1.423 |

|
|||||||||
| 1 | 0.00E+00 | 8.38 | 8.21 | 7.63 | 6.41 | 0.5708 | 0.5956 | 0.5945 | 2.978 |
| 2 | 7.03E+04 | 8.38 | 8.21 | 7.72 | 6.46 | 0.5722 | 0.5969 | 0.5974 | 2.977 |
| 3 | 1.28E+05 | 8.41 | 8.21 | 7.73 | 6.49 | 0.5752 | 0.6007 | 0.6008 | 2.977 |
| 4 | 1.90E+05 | 8.42 | 8.21 | 7.73 | 6.50 | 0.5799 | 0.6050 | 0.6047 | 2.976 |
| 5 | 2.53E+05 | 8.40 | 8.21 | 7.74 | 6.52 | 0.5848 | 0.6094 | 0.6084 | 2.974 |
| 6 | 3.15E+05 | 8.42 | 8.21 | 7.75 | 6.55 | 0.5898 | 0.6136 | 0.6118 | 2.972 |
| 7 | 3.77E+05 | 8.45 | 8.19 | 7.76 | 6.57 | 0.5943 | 0.6175 | 0.6143 | 2.970 |
| 8 | 4.40E+05 | 8.44 | 8.19 | 7.76 | 6.57 | 0.5981 | 0.6207 | 0.6166 | 2.966 |
| 9 | 5.02E+05 | 8.43 | 8.19 | 7.76 | 6.59 | 0.6015 | 0.6231 | 0.6186 | 2.962 |
| 10 | 5.63E+05 | 8.45 | 8.18 | 7.77 | 6.61 | 0.6043 | 0.6253 | 0.6202 | 2.957 |
| 11 | 6.23E+05 | 8.46 | 8.17 | 7.77 | 6.65 | 0.6067 | 0.6271 | 0.6218 | 2.952 |
| 12 | 6.83E+05 | 8.44 | 8.17 | 7.77 | 6.63 | 0.6090 | 0.6290 | 0.6230 | 2.946 |
| 13 | 7.41E+05 | 8.44 | 8.16 | 7.78 | 6.67 | 0.6106 | 0.6302 | 0.6236 | 2.939 |
| 14 | 8.01E+05 | 8.47 | 8.16 | 7.78 | 6.68 | 0.6118 | 0.6314 | 0.6246 | 2.931 |
| 15 | 8.58E+05 | 8.46 | 8.17 | 7.77 | 6.66 | 0.6131 | 0.6319 | 0.6255 | 2.869 |
| 16 | 9.13E+05 | 8.44 | 8.16 | 7.78 | 6.68 | 0.6142 | 0.6328 | 0.6261 | 2.794 |
| 17 | 9.69E+05 | 8.44 | 8.17 | 7.77 | 6.68 | 0.6152 | 0.6338 | 0.6270 | 2.701 |
| 18 | 1.02E+06 | 8.46 | 8.16 | 7.78 | 6.68 | 0.6163 | 0.6343 | 0.6279 | 2.598 |
| 19 | 1.07E+06 | 8.47 | 8.17 | 7.77 | 6.68 | 0.6174 | 0.6353 | 0.6291 | 2.468 |
| 20 | 1.12E+06 | 8.44 | 8.16 | 7.78 | 6.63 | 0.6188 | 0.6362 | 0.6298 | 2.315 |
| 21 | 1.18E+06 | 8.46 | 8.18 | 7.77 | 6.44 | 0.6197 | 0.6372 | 0.6317 | 2.086 |
| 22 | 1.22E+06 | 8.47 | 8.19 | 7.76 | 6.54 | 0.6218 | 0.6386 | 0.6342 | 1.730 |
| 23 | 1.27E+06 | 8.43 | 0.00 | 0.00 | 0.00 | 0.6249 | 0.6407 | 0.0000 | 1.390 |

|
|||||||||
| 1 | 0.00E+00 | 8.37 | 8.24 | 7.81 | 6.85 | 0.8032 | 0.8093 | 0.8093 | 3.946 |
| 2 | 7.40E+03 | 8.40 | 8.24 | 7.83 | 7.00 | 0.8036 | 0.8106 | 0.8098 | 3.943 |
| 3 | 1.57E+04 | 8.42 | 8.23 | 7.85 | 7.11 | 0.8043 | 0.8115 | 0.8102 | 3.938 |
| 4 | 2.48E+04 | 8.44 | 8.23 | 7.85 | 7.16 | 0.8052 | 0.8123 | 0.8108 | 3.932 |
| 5 | 3.47E+04 | 8.46 | 8.23 | 7.85 | 7.22 | 0.8060 | 0.8131 | 0.8114 | 3.925 |
| 6 | 4.49E+04 | 8.48 | 8.22 | 7.85 | 7.22 | 0.8070 | 0.8139 | 0.8119 | 3.916 |
| 7 | 5.55E+04 | 8.50 | 8.21 | 7.86 | 7.27 | 0.8078 | 0.8146 | 0.8123 | 3.905 |
| 8 | 6.62E+04 | 8.46 | 8.20 | 7.87 | 7.33 | 0.8085 | 0.8151 | 0.8125 | 3.894 |
| 9 | 7.71E+04 | 8.50 | 8.19 | 7.87 | 7.34 | 0.8090 | 0.8154 | 0.8126 | 3.881 |
| 10 | 8.84E+04 | 8.47 | 8.19 | 7.87 | 7.37 | 0.8094 | 0.8157 | 0.8129 | 3.866 |
| 11 | 9.95E+04 | 8.50 | 8.17 | 7.88 | 7.44 | 0.8098 | 0.8159 | 0.8128 | 3.851 |
| 12 | 1.11E+05 | 8.52 | 8.17 | 7.88 | 7.48 | 0.8098 | 0.8161 | 0.8127 | 3.833 |
| 13 | 1.23E+05 | 8.50 | 8.18 | 7.87 | 7.47 | 0.8098 | 0.8160 | 0.8130 | 3.815 |
| 14 | 1.34E+05 | 8.51 | 8.16 | 7.88 | 7.47 | 0.8102 | 0.8162 | 0.8128 | 3.795 |
| 15 | 1.45E+05 | 8.52 | 8.19 | 7.86 | 7.45 | 0.8101 | 0.8162 | 0.8132 | 3.774 |
| 16 | 1.56E+05 | 8.52 | 8.16 | 7.88 | 7.45 | 0.8105 | 0.8164 | 0.8129 | 3.754 |
| 17 | 1.68E+05 | 8.50 | 8.15 | 7.88 | 7.52 | 0.8104 | 0.8164 | 0.8126 | 3.731 |
| 18 | 1.80E+05 | 8.50 | 8.19 | 7.86 | 7.45 | 0.8161 | 0.8161 | 0.8132 | 3.707 |
| 19 | 1.90E+05 | 8.52 | 8.15 | 7.88 | 7.50 | 0.8106 | 0.8162 | 0.8129 | 3.685 |
| 20 | 2.02E+05 | 8.52 | 8.18 | 7.87 | 7.47 | 0.8106 | 0.8166 | 0.8133 | 3.657 |
| 21 | 2.13E+05 | 8.51 | 8.19 | 7.86 | 7.50 | 0.8109 | 0.8166 | 0.8140 | 3.631 |
| 22 | 2.23E+05 | 8.53 | 8.16 | 7.88 | 7.54 | 0.8116 | 0.8171 | 0.8138 | 3.605 |
| 23 | 2.34E+05 | 8.52 | 8.19 | 7.87 | 7.48 | 0.8114 | 0.8171 | 0.8145 | 3.578 |
| 24 | 2.45E+05 | 8.50 | 8.15 | 7.89 | 7.56 | 0.8122 | 0.8176 | 0.8142 | 3.550 |
| 25 | 2.56E+05 | 8.51 | 0.00 | 0.00 | 0.00 | 0.8120 | 0.8178 | 0.0000 | 3.518 |

|
|||||||||
| 1 | 0.00E+00 | 8.39 | 8.26 | 7.85 | 7.24 | 0.8602 | 0.8648 | 0.8645 | 4.853 |
| 2 | 4.33E+03 | 8.42 | 8.25 | 7.86 | 7.33 | 0.8608 | 0.8655 | 0.8650 | 4.840 |
| 3 | 9.05E+03 | 8.47 | 8.25 | 7.87 | 7.37 | 0.8613 | 0.8663 | 0.8655 | 4.822 |
| 4 | 1.42E+04 | 8.48 | 8.24 | 7.88 | 7.50 | 0.8619 | 0.8670 | 0.8660 | 4.800 |
| 5 | 1.96E+04 | 8.49 | 8.24 | 7.88 | 7.55 | 0.8626 | 0.8676 | 0.8663 | 4.772 |
| 6 | 2.52E+04 | 8.48 | 8.23 | 7.89 | 7.59 | 0.8631 | 0.8681 | 0.8667 | 4.739 |
| 7 | 3.09E+04 | 8.48 | 8.24 | 7.88 | 7.58 | 0.8638 | 0.8685 | 0.8671 | 4.701 |
| 8 | 3.67E+04 | 8.50 | 8.23 | 7.89 | 7.64 | 0.8643 | 0.8690 | 0.8675 | 4.658 |
| 9 | 4.25E+04 | 8.47 | 8.23 | 7.89 | 7.65 | 0.8649 | 0.8694 | 0.8680 | 4.610 |
| 10 | 4.83E+04 | 8.47 | 8.23 | 7.89 | 7.66 | 0.8655 | 0.8700 | 0.8685 | 4.557 |
| 11 | 5.41E+04 | 8.51 | 8.23 | 7.89 | 7.69 | 0.8661 | 0.8705 | 0.8690 | 4.498 |
| 12 | 5.99E+04 | 8.52 | 8.23 | 7.89 | 7.70 | 0.8667 | 0.8710 | 0.8695 | 4.434 |
| 13 | 6.57E+04 | 8.51 | 8.23 | 7.89 | 7.69 | 0.8674 | 0.8715 | 0.8701 | 4.362 |
| 14 | 7.15E+04 | 8.53 | 8.22 | 7.89 | 7.70 | 0.8679 | 0.8721 | 0.8706 | 4.283 |
| 15 | 7.72E+04 | 8.51 | 8.22 | 7.90 | 7.68 | 0.8685 | 0.8726 | 0.8711 | 4.198 |
| 16 | 8.30E+04 | 8.52 | 8.22 | 7.89 | 7.69 | 0.8691 | 0.8731 | 0.8716 | 4.106 |
| 17 | 8.88E+04 | 8.53 | 8.22 | 7.89 | 7.67 | 0.8697 | 0.8737 | 0.8721 | 4.003 |
| 18 | 9.45E+04 | 8.52 | 8.20 | 7.90 | 7.65 | 0.8703 | 0.8742 | 0.8724 | 3.892 |
| 19 | 1.01E+05 | 8.53 | 8.21 | 7.89 | 7.65 | 0.8707 | 0.8746 | 0.8730 | 3.764 |
| 20 | 1.06E+05 | 8.53 | 8.20 | 7.89 | 7.56 | 0.8712 | 0.8751 | 0.8733 | 3.623 |
| 21 | 1.12E+05 | 8.52 | 8.20 | 7.89 | 7.50 | 0.8716 | 0.8755 | 0.8738 | 3.461 |
| 22 | 1.19E+05 | 8.53 | 8.19 | 7.90 | 7.48 | 0.8721 | 0.8760 | 0.8741 | 3.272 |
| 23 | 1.25E+05 | 8.50 | 8.17 | 7.90 | 7.33 | 0.8725 | 0.8763 | 0.8742 | 3.042 |
| 24 | 1.32E+05 | 8.51 | 8.36 | 7.13 | 6.91 | 0.8727 | 0.8766 | 0.8742 | 2.721 |
| 25 | 1.38E+05 | 8.53 | 0.00 | 0.00 | 0.00 | 0.8727 | 0.8766 | 0.0000 | 2.198 |
Notes.
TP: TP number.
tTP: time since first TP.
TFBOT: largest temperature at the bottom of the flash convective zone.
THES: temperature in the He-burning shell during deepest extend of 3DUP.
THS: temperature in the H shell.
TCEB: temperature at the bottom of the convective envelope during deepest extend of 3DUP.
mFBOT: mass coordinate at the bottom of the He-flash convective zone.
mHTP: mass coordinate of the H-free core at the time of the TP.
 : lowest mass coordinate at the convective envelope bottom after the TP.
M*: stellar mass at the TP.
Table 5. TPAGB Evolution Properties of Set 1.1
| Set 1.1 Z = 0.01 | |||||||||
|---|---|---|---|---|---|---|---|---|---|
| TP | tTP | TFBOT | THES | THS | TCEB | mFBOT | mHTP |

|
M* |
| (years) | (K) | (K) | (K) | (K) | (M⊙) | (M⊙) | (M⊙) | (M⊙) | |

|
|||||||||
| 1 | 0.00E+00 | 8.31 | 8.18 | 7.63 | 6.19 | 0.4974 | 0.5328 | 0.5346 | 1.536 |
| 2 | 1.05E+05 | 8.31 | 8.17 | 7.67 | 6.26 | 0.4999 | 0.5343 | 0.5358 | 1.536 |
| 3 | 2.23E+05 | 8.36 | 8.18 | 7.68 | 6.30 | 0.5009 | 0.5372 | 0.5379 | 1.536 |
| 4 | 3.55E+05 | 8.38 | 8.19 | 7.68 | 6.32 | 0.5051 | 0.5411 | 0.5417 | 1.535 |
| 5 | 4.87E+05 | 8.37 | 8.19 | 7.71 | 6.34 | 0.5103 | 0.5453 | 0.5458 | 1.534 |
| 6 | 6.21E+05 | 8.40 | 8.20 | 7.70 | 6.35 | 0.5155 | 0.5508 | 0.5512 | 1.532 |
| 7 | 7.51E+05 | 8.40 | 8.19 | 7.72 | 6.36 | 0.5227 | 0.5563 | 0.5566 | 1.529 |
| 8 | 8.77E+05 | 8.42 | 8.20 | 7.72 | 6.38 | 0.5297 | 0.5624 | 0.5626 | 1.525 |
| 9 | 9.96E+05 | 8.42 | 8.20 | 7.73 | 6.38 | 0.5373 | 0.5686 | 0.5687 | 1.520 |
| 10 | 1.11E+06 | 8.43 | 8.20 | 7.73 | 6.39 | 0.5451 | 0.5749 | 0.5750 | 1.513 |
| 11 | 1.22E+06 | 8.43 | 8.20 | 7.73 | 6.39 | 0.5529 | 0.5812 | 0.5811 | 1.504 |
| 12 | 1.32E+06 | 8.43 | 8.19 | 7.74 | 6.40 | 0.5606 | 0.5876 | 0.5866 | 1.493 |
| 13 | 1.41E+06 | 8.42 | 8.19 | 7.75 | 6.40 | 0.5676 | 0.5934 | 0.5917 | 1.477 |
| 14 | 1.51E+06 | 8.44 | 8.19 | 7.75 | 6.41 | 0.5741 | 0.5987 | 0.5967 | 1.456 |
| 15 | 1.59E+06 | 8.44 | 8.19 | 7.74 | 6.41 | 0.5804 | 0.6039 | 0.6017 | 1.429 |
| 16 | 1.68E+06 | 8.43 | 8.19 | 7.75 | 6.39 | 0.5866 | 0.6090 | 0.6070 | 1.393 |
| 17 | 1.76E+06 | 8.43 | 0.00 | 0.00 | 0.00 | 0.5942 | 0.6140 | 0.0000 | 1.239 |

|
|||||||||
| 1 | 0.00E+00 | 8.29 | 8.17 | 7.64 | 6.26 | 0.4503 | 0.4979 | 0.4999 | 1.978 |
| 2 | 5.25E+05 | 8.36 | 8.18 | 7.64 | 6.28 | 0.4599 | 0.5061 | 0.5069 | 1.978 |
| 3 | 8.91E+05 | 8.35 | 8.19 | 7.64 | 6.29 | 0.4693 | 0.5124 | 0.5133 | 1.978 |
| 4 | 1.06E+06 | 8.34 | 8.17 | 7.69 | 6.33 | 0.4739 | 0.5152 | 0.5163 | 1.978 |
| 5 | 1.22E+06 | 8.38 | 8.19 | 7.68 | 6.33 | 0.4768 | 0.5198 | 0.5205 | 1.978 |
| 6 | 1.39E+06 | 8.37 | 8.19 | 7.69 | 6.34 | 0.4824 | 0.5246 | 0.5253 | 1.977 |
| 7 | 1.55E+06 | 8.39 | 8.20 | 7.69 | 6.35 | 0.4884 | 0.5302 | 0.5307 | 1.977 |
| 8 | 1.72E+06 | 8.38 | 8.20 | 7.70 | 6.37 | 0.4956 | 0.5361 | 0.5365 | 1.976 |
| 9 | 1.87E+06 | 8.41 | 8.20 | 7.71 | 6.38 | 0.5033 | 0.5421 | 0.5425 | 1.975 |
| 10 | 2.01E+06 | 8.42 | 8.20 | 7.72 | 6.40 | 0.5113 | 0.5484 | 0.5487 | 1.974 |
| 11 | 2.15E+06 | 8.42 | 8.20 | 7.72 | 6.41 | 0.5190 | 0.5545 | 0.5547 | 1.973 |
| 12 | 2.28E+06 | 8.43 | 8.20 | 7.72 | 6.41 | 0.5270 | 0.5609 | 0.5605 | 1.971 |
| 13 | 2.40E+06 | 8.42 | 8.20 | 7.73 | 6.44 | 0.5347 | 0.5668 | 0.5660 | 1.968 |
| 14 | 2.51E+06 | 8.42 | 8.19 | 7.74 | 6.44 | 0.5417 | 0.5725 | 0.5707 | 1.965 |
| 15 | 2.62E+06 | 8.41 | 8.19 | 7.74 | 6.46 | 0.5479 | 0.5776 | 0.5750 | 1.961 |
| 16 | 2.72E+06 | 8.43 | 8.19 | 7.73 | 6.46 | 0.5535 | 0.5821 | 0.5791 | 1.956 |
| 17 | 2.82E+06 | 8.42 | 8.19 | 7.74 | 6.47 | 0.5585 | 0.5861 | 0.5826 | 1.950 |
| 18 | 2.92E+06 | 8.42 | 8.18 | 7.74 | 6.48 | 0.5634 | 0.5901 | 0.5858 | 1.941 |
| 19 | 3.01E+06 | 8.46 | 8.17 | 7.75 | 6.51 | 0.5677 | 0.5936 | 0.5884 | 1.911 |
| 20 | 3.10E+06 | 8.46 | 8.18 | 7.75 | 6.50 | 0.5714 | 0.5966 | 0.5912 | 1.857 |
| 21 | 3.19E+06 | 8.45 | 8.18 | 7.75 | 6.51 | 0.5749 | 0.5992 | 0.5937 | 1.790 |
| 22 | 3.27E+06 | 8.43 | 8.18 | 7.75 | 6.49 | 0.5780 | 0.6013 | 0.5965 | 1.711 |
| 23 | 3.35E+06 | 8.45 | 8.19 | 7.74 | 6.48 | 0.5814 | 0.6039 | 0.6001 | 1.608 |
| 24 | 3.42E+06 | 8.43 | 8.19 | 7.74 | 6.42 | 0.5860 | 0.6075 | 0.6045 | 1.463 |
| 25 | 3.49E+06 | 8.42 | 0.00 | 0.00 | 0.00 | 0.5929 | 0.6117 | 0.0000 | 1.208 |

|
|||||||||
| 1 | 0.00E+00 | 8.34 | 8.20 | 7.75 | 6.44 | 0.6282 | 0.6461 | 0.6467 | 2.972 |
| 2 | 3.91E+04 | 8.40 | 8.22 | 7.74 | 6.47 | 0.6291 | 0.6488 | 0.6485 | 2.971 |
| 3 | 8.17E+04 | 8.41 | 8.21 | 7.77 | 6.53 | 0.6324 | 0.6515 | 0.6503 | 2.970 |
| 4 | 1.26E+05 | 8.41 | 8.19 | 7.79 | 6.57 | 0.6350 | 0.6544 | 0.6515 | 2.967 |
| 5 | 1.74E+05 | 8.43 | 8.19 | 7.79 | 6.60 | 0.6374 | 0.6566 | 0.6525 | 2.964 |
| 6 | 2.24E+05 | 8.44 | 8.17 | 7.79 | 6.64 | 0.6394 | 0.6582 | 0.6528 | 2.959 |
| 7 | 2.76E+05 | 8.44 | 8.16 | 7.80 | 6.68 | 0.6407 | 0.6594 | 0.6529 | 2.953 |
| 8 | 3.29E+05 | 8.47 | 8.16 | 7.80 | 6.69 | 0.6418 | 0.6599 | 0.6530 | 2.903 |
| 9 | 3.81E+05 | 8.47 | 8.14 | 7.81 | 6.73 | 0.6425 | 0.6602 | 0.6523 | 2.824 |
| 10 | 4.36E+05 | 8.46 | 8.17 | 7.79 | 6.72 | 0.6425 | 0.6602 | 0.6535 | 2.719 |
| 11 | 4.84E+05 | 8.47 | 8.15 | 7.80 | 6.72 | 0.6439 | 0.6603 | 0.6533 | 2.613 |
| 12 | 5.35E+05 | 8.46 | 8.14 | 7.80 | 6.72 | 0.6441 | 0.6609 | 0.6525 | 2.461 |
| 13 | 5.86E+05 | 8.48 | 8.14 | 7.80 | 6.71 | 0.6436 | 0.6604 | 0.6522 | 2.249 |
| 14 | 6.35E+05 | 8.47 | 0.00 | 0.00 | 0.00 | 0.6434 | 0.6598 | 0.0000 | 1.932 |

|
|||||||||
| 1 | 0.00E+00 | 8.41 | 8.24 | 7.84 | 6.96 | 0.8251 | 0.8309 | 0.8306 | 3.930 |
| 2 | 6.71E+03 | 8.44 | 8.23 | 7.85 | 7.07 | 0.8256 | 0.8318 | 0.8310 | 3.927 |
| 3 | 1.42E+04 | 8.46 | 8.23 | 7.86 | 7.18 | 0.8262 | 0.8326 | 0.8314 | 3.923 |
| 4 | 2.25E+04 | 8.45 | 8.22 | 7.87 | 7.27 | 0.8268 | 0.8333 | 0.8318 | 3.917 |
| 5 | 3.13E+04 | 8.49 | 8.22 | 7.88 | 7.31 | 0.8276 | 0.8339 | 0.8323 | 3.909 |
| 6 | 4.05E+04 | 8.48 | 8.22 | 7.88 | 7.33 | 0.8284 | 0.8345 | 0.8328 | 3.900 |
| 7 | 4.98E+04 | 8.50 | 8.22 | 7.88 | 7.42 | 0.8292 | 0.8352 | 0.8332 | 3.890 |
| 8 | 5.93E+04 | 8.51 | 8.20 | 7.89 | 7.48 | 0.8299 | 0.8357 | 0.8334 | 3.879 |
| 9 | 6.90E+04 | 8.47 | 8.19 | 7.89 | 7.51 | 0.8303 | 0.8360 | 0.8336 | 3.866 |
| 10 | 7.87E+04 | 8.49 | 8.18 | 7.89 | 7.49 | 0.8307 | 0.8364 | 0.8336 | 3.852 |
| 11 | 8.86E+04 | 8.52 | 8.17 | 7.89 | 7.53 | 0.8308 | 0.8365 | 0.8334 | 3.837 |
| 12 | 9.87E+04 | 8.49 | 8.20 | 7.88 | 7.55 | 0.8308 | 0.8365 | 0.8339 | 3.819 |
| 13 | 1.08E+05 | 8.48 | 8.20 | 7.88 | 7.59 | 0.8313 | 0.8366 | 0.8345 | 3.803 |
| 14 | 1.18E+05 | 8.51 | 8.19 | 7.89 | 7.59 | 0.8318 | 0.8372 | 0.8349 | 3.785 |
| 15 | 1.27E+05 | 8.51 | 8.20 | 7.88 | 7.55 | 0.8324 | 0.8377 | 0.8354 | 3.664 |
| 16 | 1.37E+05 | 8.53 | 8.19 | 7.89 | 7.60 | 0.8330 | 0.8382 | 0.8357 | 3.524 |
| 17 | 1.46E+05 | 8.53 | 8.20 | 7.88 | 7.50 | 0.8334 | 0.8386 | 0.8364 | 3.361 |
| 18 | 1.55E+05 | 8.49 | 8.20 | 7.88 | 7.50 | 0.8341 | 0.8391 | 0.8371 | 3.172 |
| 19 | 1.65E+05 | 8.49 | 8.21 | 7.87 | 7.35 | 0.8348 | 0.8399 | 0.8380 | 2.936 |
| 20 | 1.74E+05 | 8.49 | 0.00 | 0.00 | 0.00 | 0.8358 | 0.8408 | 0.0000 | 2.617 |

|
|||||||||
| 1 | 0.00E+00 | 8.31 | 8.22 | 7.89 | 7.28 | 0.8989 | 0.9012 | 0.9015 | 4.830 |
| 2 | 2.79E+03 | 8.42 | 8.26 | 7.88 | 7.43 | 0.8985 | 0.9019 | 0.9017 | 4.820 |
| 3 | 6.06E+03 | 8.42 | 8.26 | 7.89 | 7.49 | 0.8989 | 0.9025 | 0.9021 | 4.805 |
| 4 | 9.65E+03 | 8.47 | 8.25 | 7.90 | 7.57 | 0.8993 | 0.9031 | 0.9025 | 4.786 |
| 5 | 1.35E+04 | 8.46 | 8.25 | 7.91 | 7.64 | 0.8998 | 0.9037 | 0.9028 | 4.762 |
| 6 | 1.76E+04 | 8.50 | 8.24 | 7.91 | 7.70 | 0.9002 | 0.9042 | 0.9031 | 4.731 |
| 7 | 2.18E+04 | 8.47 | 8.24 | 7.91 | 7.75 | 0.9007 | 0.9045 | 0.9035 | 4.693 |
| 8 | 2.61E+04 | 8.50 | 8.24 | 7.91 | 7.76 | 0.9013 | 0.9050 | 0.9039 | 4.648 |
| 9 | 3.04E+04 | 8.48 | 8.23 | 7.92 | 7.79 | 0.9017 | 0.9054 | 0.9042 | 4.594 |
| 10 | 3.49E+04 | 8.50 | 8.23 | 7.92 | 7.78 | 0.9022 | 0.9058 | 0.9045 | 4.528 |
| 11 | 3.94E+04 | 8.51 | 8.23 | 7.92 | 7.80 | 0.9026 | 0.9061 | 0.9048 | 4.453 |
| 12 | 4.40E+04 | 8.51 | 8.22 | 7.92 | 7.79 | 0.9030 | 0.9065 | 0.9051 | 4.365 |
| 13 | 4.86E+04 | 8.53 | 8.21 | 7.92 | 7.81 | 0.9034 | 0.9068 | 0.9053 | 4.264 |
| 14 | 5.33E+04 | 8.50 | 8.21 | 7.92 | 7.79 | 0.9036 | 0.9071 | 0.9055 | 4.148 |
| 15 | 5.81E+04 | 8.50 | 8.22 | 7.92 | 7.78 | 0.9039 | 0.9073 | 0.9058 | 4.020 |
| 16 | 6.28E+04 | 8.54 | 8.21 | 7.92 | 7.78 | 0.9042 | 0.9076 | 0.9061 | 3.882 |
| 17 | 6.75E+04 | 8.53 | 8.21 | 7.92 | 7.76 | 0.9046 | 0.9079 | 0.9064 | 3.730 |
| 18 | 7.23E+04 | 8.50 | 8.21 | 7.92 | 7.74 | 0.9049 | 0.9082 | 0.9067 | 3.563 |
| 19 | 7.70E+04 | 8.54 | 8.22 | 7.91 | 7.70 | 0.9053 | 0.9085 | 0.9071 | 3.381 |
| 20 | 8.18E+04 | 8.53 | 8.21 | 7.92 | 7.68 | 0.9057 | 0.9089 | 0.9075 | 3.179 |
| 21 | 8.66E+04 | 8.51 | 8.21 | 7.91 | 7.47 | 0.9061 | 0.9093 | 0.9079 | 2.939 |
| 22 | 9.16E+04 | 8.53 | 0.00 | 0.00 | 0.00 | 0.9066 | 0.9098 | 0.0000 | 2.627 |
Notes. Same Parameter as in Table 4.
TP: TP number.
tTP: time since first TP.
TFBOT: largest temperature at the bottom of the flash convective zone.
THES: temperature in the He-burning shell during deepest extend of 3DUP.
THS: temperature in the H shell.
TCEB: temperature at the bottom of the convective envelope during deepest extend of 3DUP.
mFBOT: mass coordinate at the bottom of the He-flash convective zone.
mHTP: mass coordinate of the H-free core at the time of the TP.
 : lowest mass coordinate at the convective envelope bottom after the TP.
M*: stellar mass at the TP.
Our 2  , Z = 0.02 calculation compares well to that of Weiss & Ferguson (2009), except the core mass at the first TP. It is 0.510
  for our model and 0.478
  (0.518
  ) for the Mini = 2
  (2.6
(2.6  ) Weiss & Ferguson (2009) models. Their and our 2
  simulations have 13 and 12 TPs with 3DUP. The final C/O ratio is 1.476 in our model and 1.204 (1.426) in the Weiss & Ferguson (2009) Mini = 2
  (2.6
(2.6  ) models. The average luminosity in our model is
  while that of Weiss & Ferguson (2009) is a bit lower (
 ), consistent with the lower core mass of their model.
Our 5  stellar model with Z = 0.02 has a final core mass of M = 0.8747
  . The highest temperature obtained at the bottom of the AGB envelope is 6.56 × 10⁷ K. For the same mass and metallicity, Cristallo et al. (2015) obtained M = 0.8462
  and about 8 × 10⁶ K, and Karakas et al. (2012) M = 0.8726
  and 5.74 × 10⁷ K. The total number of TPs is 25 with TDUP after each pulse except the first one. The Cristallo et al. (2015) and Karakas et al. (2012) models experience 10 and 25 TPs, respectively, while our model has been followed for 25 TPs when the total mass has decreased to 2.198
  . Our TP-AGB lifetime is 1.38 × 10⁵ years, while that of Cristallo et al. (2015) is 1.04 × 10⁵ years. Our lifetime after 10 TPs is 0.483 × 10⁵ years, about one-half of the lifetime of the model of Cristallo et al. (2015) after the same number of TPs. This implies that their interpulse lifetime is about twice that of our model for these first 10 TPs. The interpulse time at the last TP in our 5
  model is 0.7 × 10⁴ years, while Karakas et al. (2012) report 1.3 × 10⁴ years. The total lifetime of our model of 1.17 × 10⁸ years is in agreement with the lifetime of 1.19 × 10⁸ years and 1.06 × 10⁸ years found by Cristallo et al. (2015) and Karakas et al. (2012). For the total mass dredged up, we obtain 3.72 × 10⁻²
 . This value is about a factor of two lower than the 6.47 × 10⁻²
 obtained in Karakas et al. (2012), but much larger than the 4.06 × 10⁻³
 in Cristallo et al. (2015). The maximum temperature in the PDCZ is found to be 3.43 × 10⁸ K. The value is consistent with the Karakas et al. (2012) model which gives 3.44 × 10⁸ K, and is about 10% larger than the 3.12 × 10⁸ K by Cristallo et al. (2015). This difference might be due to their smaller core mass. Overall, the three models agree with each other, although significant differences between either pair of models can be identified.
CBM during the TP phase is important for nucleosynthesis in two locations: the bottom of the He-shell flash convection zone during the TP and the bottom of the convective envelope during the third dredge-up phase. It also influences the efficiency of the third dredge-up which is responsible for mixing C and O from the intershell to the surface, which eventually is responsible for the formation of C-stars (Figure 5).
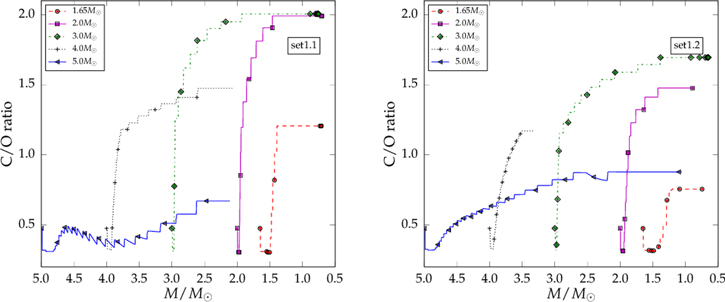
Figure 5. Evolution of the C/O number ratio as a function of stellar mass. Since the stellar mass decreases with time, the C/O evolution corresponds to a time sequence from left to right. Labels are the same as in Figure 1.
Download figure:
Standard image High-resolution imageThe efficiency of mixing processed material from the core to the envelope is expressed with the dredge-up parameter

where ΔMDUP is the dredged-up mass and ΔMH is the hydrogen-free core growth during the last interpulse phase. The evolution of the dredge-up parameter as calculated in our models is shown in Figure 6. The parameter reflects the evolutionary behavior of the core and envelope mass. In our models the dredge-up efficiency is decreasing with increasing Z, decreasing core mass, and decreasing envelope mass as expected (Lattanzio 1989). For the 3  , Z = 0.02 model,
  , which compares to
  for models with the same initial parameters by Karakas & Lattanzio (2014). These differences are consistent with the different assumptions of CBM in the two sets of calculations. The evolution of λ appears to be discontinuous for some of the AGB models when the maximum λ values are reached in the evolution, with variations up to 30% from one TDU to the next. This is due to the CBM feedback to the stellar behavior before and during the TDU, both at the bottom of the convective TP (e.g., Mowlavi 1999a; Herwig 2000) and at the bottom of the TDU itself (e.g., Herwig 2004b). In particular, the 4
  model at Z = 0.02 shows a peculiar zig-zag pattern with variations of λ on the order of 30%. The same extreme pattern is not obtained in the other models. This is due to the CBM activation during the TDU, where some minor H burning remains and may switch the CBM at the base of the convective envelope between
  and
and  .
.

Figure 6. Evolution of dredge-up parameter λDUP at each TP, starting with the second pulse. Top panel: Set 1.1; bottom panel: Set 1.2 models.
Download figure:
Standard image High-resolution imageThe most obvious consequence of the third dredge-up is the transformation of an initially O-rich star into a C star (Figure 5). The C/O ratio in the intershell is due to primary He burning and therefore nearly the same for the two metallicities, and the dredge-up efficiency is similar as well. The larger C/O ratio reached in the Z = 0.01 Set 1.1 is simply due to the fact that the initial amount of O in the envelope is only half that compared to the Z = 0.02 case. For the 5  case, however, the Z = 0.02 case reaches a higher final C/O ratio because HBB (Blöcker & Schönberner 1991; Lattanzio 1992) is activated already in the Z = 0.01 case and this reduces the C/O ratio. Toward the end of the 5
  , Z = 0.01 simulation, dredge-up again becomes more important than HBB and the C/O ratio increases (Frost et al. 1998).
AGB stellar models often show a good agreement with many s-process, heavy element abundance observables (e.g., Gallino et al. 1998; Busso et al. 1999; Goriely & Mowlavi 2000; Bisterzo et al. 2011; Cristallo et al. 2011; Lugaro et al. 2012), while other cases are less successful; see, e.g., Van Eck et al. (2003) for Pb in CEMP stars, De Smedt et al. (2012) and De Smedt et al. (2014) for post-AGB stars, and the S, Y, Zr region for many CEMP-s stars (Lugaro et al. 2012; Bisterzo et al. 2012). Nevertheless, the currently established scenario to produce the s-process in AGB stars is that at the end of the third dredge-up, a partially mixed zone of H and  leaves behind the conditions for the formation of a
  -enriched layer (Figure 8). Such a layer can subsequently release neutrons under (mostly) radiative conditions during the interpulse phase. In our low-mass AGB stellar models we achieve this partial mixing zone through the exponential CBM algorithm (see Section 2.1).
The massive AGB stellar models with 5  encounter just over 20 TPs with third dredge-up. After the initial transient phase the dredge-up parameter is λ ≈ 0.8 (Figure 6). The temperature at the bottom of the convective envelope TCEB in our Mini = 5
  , Z = 0.02 calculation peaks close to
  (Figure 7), in good agreement with the results presented by Karakas et al. (2012). In the last two pulses of our 5
  sequence, TCEB is enhanced because of the modified convection and opacity assumptions that we make trying to overcome the well known modeling problems for higher mass and higher Z TP-AGB models (Lau et al. 2012). Therefore, this final jump in TCEB is an artifact of this approximation introduced to simulate more TPs. Also concerning the model with Mini = 1.65
  , Z = 0.02, the TCEB discontinuity is due to the same opacity modification introduced to aid convergence.

Figure 7. Temperature at the bottom of the convective envelope for Set 1.2 and Set 1.1.
Download figure:
Standard image High-resolution image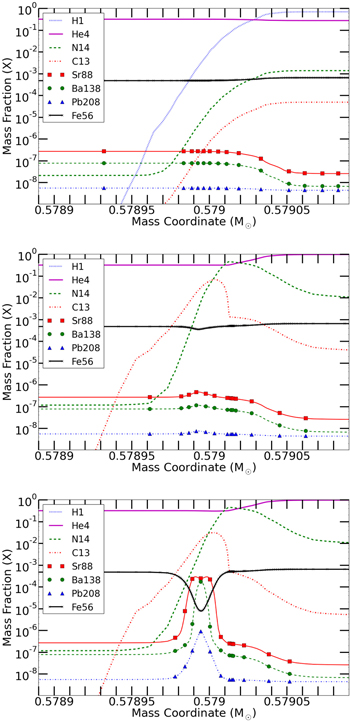
Figure 8.
 -pocket and neutron magic s-nuclei formation. The top panel refers to the moment just after the maximum penetration of the hydrogen-shell during the TDU event, which is followed by the radiative burning of the
  -pocket with the consequent neutron release and s-nuclei synthesis (middle and bottom panels). Also,
  seeds are plotted. The simulations are from the 2
  star, Set 1.1.
Download figure:
Standard image High-resolution imageInspection of the H-burning luminosity shows that at these high metallicities the models do not show the hot dredge-up reported for lower-Z models (e.g., Herwig 2004b). The  -pocket forms just as in the lower mass cases, but it contains only about 10−6
 . It is post-processed and well resolved, as shown in Figure 9.

Figure 9. Same as Figure 8, but for the 5  star, Set 1.2.
Download figure:
Standard image High-resolution imageFull details regarding the Set 1.2 massive stars can be found in Bennett et al. (2012). In this work, the stellar evolution data is extended to include Set 1.1 models. The Hertzsprung–Russell diagram for all models in Set 1 is shown in Figure 10 and the evolutionary tracks in the  plane are shown in Figures 11 and 12, both of which are consistent with previous results (see, e.g., Hirschi et al. 2004). In particular, models with masses M ≤ 25
  end up as red super giants (RSGs), and the Set 1.2 32 and 60
  models end as W–R stars. In Figures 13 and 14, Kippenhahn diagrams of the massive stars are shown. The final core masses of these models are comparable to other grids of models calculated with GENEC with the same overshooting (Schaller et al. 1992). The choice of
  for the extent of overshooting during the core H- and He-burning phases implies that core masses are slightly larger than in other GENEC grids using
  for core overshooting (Hirschi et al. 2004; Ekström et al. 2012). The final stellar masses at both Z = 0.01 and 0.02 are typically lower than the models obtained using other stellar evolution codes. This is due to the different mass-loss prescriptions used for RSGs (see Section 2.1 for the mass-loss rates used in GENEC) in different codes, which are empirical and still uncertain. Although the fate of massive stars is still not well understood (see, e.g., Ugliano et al. 2012; Smartt 2015), the probable fate of stars above 30
  at metallicities lower than solar is a collapse without explosion (although the dependence of mass-loss rates on metallicity is also uncertain). Furthermore, the winds of massive stars only enrich the ISM in light elements (up to aluminum). Based on our Z = 0.02 simulation, we expect their contribution to heavy elements will be small and therefore did not compute 32 and 60 M⊙ models at Z = 0.01.
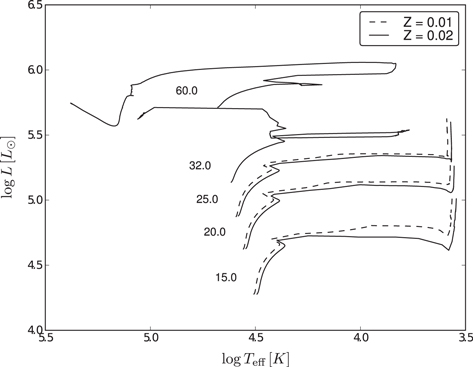
Figure 10. H–R diagram for massive star models in Set 1.1 (Z = 0.01) and Set 1.2 (Z = 0.02). The evolution of the Set 1.2 models in the H–R diagram is shown also in Figure 3 of Bennett et al. (2012).
Download figure:
Standard image High-resolution image
Figure 11. Central temperature, Tc, as a function of central density, ρc, for the 15, 20, and 25  massive star models of Set 1.1. Ignition points for the core burning stages are indicated by the colored points, which are determined at the point when the principal fuel is depleted by 0.3% from its maximum value.
Download figure:
Standard image High-resolution image
Figure 12. Central temperature, Tc, as a function of central density, ρc, for the 15, 20, 25, 32, and 60  massive star models of Set 1.2. Ignition points for the core burning stages are indicated by the colored points, which are determined at the point when the principal fuel is depleted by 0.3% from its maximum value.
Download figure:
Standard image High-resolution image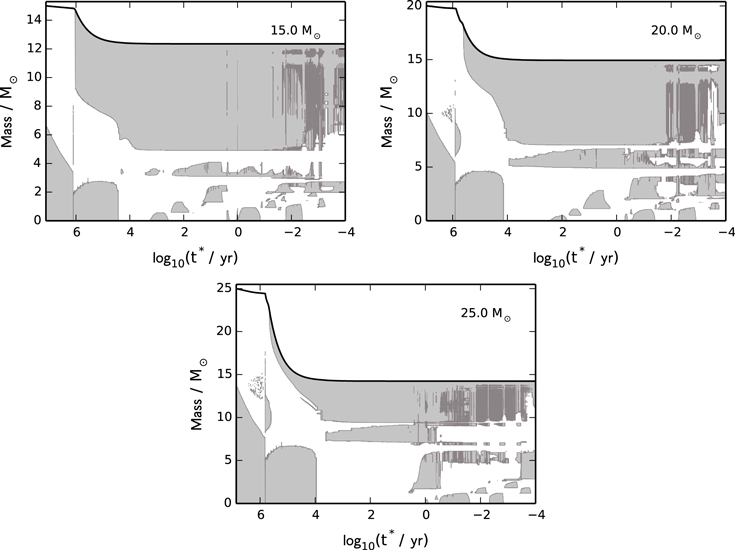
Figure 13. Kippenhahn diagrams for the 15, 20, and 25  models from Set 1.1.
Download figure:
Standard image High-resolution image
Figure 14. Kippenhahn diagrams for the 15, 20, 25, 32, and 60  models from Set 1.2.
Download figure:
Standard image High-resolution imageThe core masses for all of the massive star models are shown in Table 6. The core masses are determined at the end of silicon burning and are defined as the mass coordinate where a criterion for the core mass is satisfied. The helium-core mass,  , is defined by the mass coordinate where
  abundance becomes lower than 0.75 in mass (note that the 32 and 60
  stars become W–R stars and have lost their entire H-rich envelope). For the CO core mass, MCO, the position corresponds to the mass coordinate where the
  abundance falls below 0.001 toward the center of the star. For the silicon-core mass, MSi, the position corresponds to a mass coordinate where the sum of Si, S, Ar, Ca, and Ti mass fraction abundances, for all isotopes, is 0.5. The core burning lifetimes for hydrostatic-burning stages are presented in Table 7 for the Set 1.2 and Set 1.1 massive star models. The lifetimes are defined for each stage as the difference in age from the point where the principal fuel for that stage (
 for hydrogen burning,
  for helium burning, etc.) is depleted by 0.3% from its maximum value to the age where the abundance of that fuel is depleted below a mass fraction of 10−5. There are exceptions, however, for carbon burning and neon burning where this value is 10−3, and oxygen burning where it is 10−2. These criteria are necessary to ensure that a lifetime is calculated in those cases where residual fuel is unburnt and to ensure that the burning stages are correctly separated (for example, the mass fraction abundance of
  at neon ignition for the Set 1.2 60
  model is 4.123 × 10⁻⁵). The lifetime of the advanced stages is quite sensitive to the mass fractions of isotopes defining the lifetime, particularly for stages following carbon burning.
Table 6. Core Masses for the Set 1.2 and Set 1.1 Massive Star Models
| Set 1.2 Z = 0.02 | ||||
|---|---|---|---|---|
| Initial Mass | MFinal |

|
MCO | MSi |
| 15 | 12.132 | 4.791 | 2.821 | 1.720 |
| 20 | 13.974 | 6.826 | 4.528 | 1.804 |
| 25 | 13.738 | 9.193 | 6.301 | 1.724 |
| 32 | 12.495 | 12.495 | 9.146 | 2.003 |
| 60 | 13.428 | 13.428 | 10.701 | 2.143 |
| Set 1.1 Z = 0.01 | ||||
| Initial Mass | MFinal |

|
MCO | MSi |
| 15 | 12.349 | 4.811 | 2.835 | 1.697 |
| 20 | 14.120 | 7.001 | 4.614 | 2.036 |
| 25 | 14.232 | 9.387 | 6.448 | 1.854 |
Note. For each model, the final core mass (Mfinal), helium-core mass ( ), CO core mass (MCO), and silicon core mass (MSi) are specified, and are all in solar mass units.
Download table as: ASCIITypeset image
Table 7. Core Burning Lifetimes for the Set 1.2 and Set 1.1 Massive Star Models
| Set 1.2 Z = 0.02 | |||||||
|---|---|---|---|---|---|---|---|
| Model | τH | τHe | τC | τNe | τO | τSi | τtotal |
| 15 | 1.137 × 10⁷ | 1.255 × 10⁶ | 2.595 × 10³ | 1.253 | 1.233 | 1.685 × 10⁻² | 1.268 × 10⁷ |
| 20 | 7.926 × 10⁶ | 8.396 × 10⁵ | 7.409 × 10² | 0.193 | 0.293 | 1.302 × 10⁻² | 8.799 × 10⁶ |
| 25 | 6.492 × 10⁶ | 6.519 × 10⁵ | 3.131 × 10² | 0.634 | 0.603 | 4.322 × 10⁻³ | 7.168 × 10⁶ |
| 32 | 5.287 × 10⁶ | 5.346 × 10⁵ | 1.245 × 10² | 0.111 | 0.167 | 8.997 × 10⁻³ | 5.840 × 10⁶ |
| 60 | 3.549 × 10⁶ | 3.935 × 10⁵ | 7.808 × 101 | 0.090 | 0.119 | 8.624 × 10⁻³ | 3.955 × 10⁶ |
| Set 1.1 Z = 0.01 | |||||||
| Model | τH | τHe | τC | τNe | τO | τSi | τtotal |
| 15 | 1.167 × 10⁷ | 1.216 × 10⁶ | 2.659 × 10³ | 1.135 | 1.300 | 1.297 × 10⁻² | 1.294 × 10⁷ |
| 20 | 8.190 × 10⁶ | 8.220 × 10⁵ | 7.428 × 10² | 0.183 | 0.350 | 5.743 × 10⁻³ | 9.044 × 10⁶ |
| 25 | 6.642 × 10⁶ | 6.494 × 10⁵ | 2.594 × 10² | 0.810 | 0.604 | 1.201 × 10⁻² | 7.315 × 10⁶ |
Note. The lifetimes for hydrogen burning, τH, helium burning, τHe, carbon burning, τC, neon burning τNe, oxygen burning, τO, silicon burning, τSi, and the total lifetime of the stellar models, τtotal, are specified in units of years.
Download table as: ASCIITypeset image
2.3. The Approximations of CCSN Explosion
Stellar winds play a role dispersing nuclides into the circumstellar medium, particularly for the light elements carbon and nitrogen. The bulk of the nucleosynthetic yields from massive stars, however, are ejected by the SN explosion. In the deeper layers (most importantly the silicon and oxygen layers, although potentially also in the neon and carbon layers), the SN shock drives further nuclear burning. Determining the ultimate yield including this explosive burning is a complex problem (e.g., Woosley & Weaver 1995; Chieffi et al. 1998; Limongi et al. 2000; Woosley et al. 2002; Nomoto et al. 2006; Tominaga et al. 2007; Thielemann et al. 2011) and specific discussions are needed for different species (see, for example, Rauscher et al. 2002; Tur et al. 2009). In this paper, our stellar models follow the evolution of the star through silicon burning, but not to collapse. Instead of forcing a collapse, we model the explosive nucleosynthesis using a semi-analytic description for the shock heating and subsequent evolution of the matter to produce a qualitative picture of explosive nuclear burning.
The first step in our semi-analytic prescription is the determination of the mass cut defining the line between matter ejected and matter falling back onto the compact remnant (Fryer et al. 2012). We use the prescription outlined in Fryer et al. (2012) for the final compact remnant mass as a function of the initial stellar mass and metallicity (Table 8). Under the convective-engine paradigm, the explosion energy is a function of the ram pressure of the infalling stellar material, and hence depends upon the time of the explosion. The mass of the final compact remnant depends both on this time and on the amount of material that falls back after the launch of the explosion. This fallback depends strongly on the explosion energy. In accordance with Fryer et al. (2012), two explosion models are considered for each massive star model, labeled as delayed and rapid. We include the two models here to give a range of remnant masses. In general, the rapid explosion produces smaller remnant masses than the delayed explosion. For more massive stars, the rapid explosion model fails, producing large remnants. Comparing our remnant masses to the core masses in Table 6, we note that a direct correspondence between core mass and remnant mass does not exist with the new remnant mass prescription in Fryer et al. (2012) that includes both SN engine and fallback effects. Beyond the mass cut, our stellar structure is in agreement with pre-collapse stellar models (Woosley et al. 2002; Limongi & Chieffi 2006; Young & Fryer 2007). In particular, the stellar structure outside of the final mass cut is not expected to vary much between the end of core Si burning and the collapse stage, so the results presented here are not affected by the fact that we did not follow the pre-collapse phase (see, e.g., comparison in Paxton et al. 2011). Hence, our semi-analytic prescription for the shock will produce the same yield with a pre-collapse star as it does with our end-of-silicon-burning models.
Table 8. Final Remnant Mass Coordinates (in Solar Mass Unit) of Massive Star Models Presented in This Work
| Initial Mass | Z = 0.02 | Z = 0.02 | Z = 0.01 | Z = 0.01 |
|---|---|---|---|---|
( ) ) |
Delay | Rapid | Delay | Rapid |
| 15 | 1.60 | 1.44 | 1.61 | 1.44 |
| 20 | 2.70 | 2.73 | 2.73 | 1.83 |
| 25 | 5.71 | 13.8* | 6.05 | 7.91 |
| 32 | 8.75 | 4.75 | ⋯ | ⋯ |
| 60 | 3.00 | 3.00 | ⋯ | ⋯ |
Note. The full 25  , Z = 0.02 stellar model progenitor (*) is directly collapsed into a black hole.
Download table as: ASCIITypeset image
We determine the shock velocity in the analytical explosion model using the Sedov blastwave solution (Sedov 1946) throughout the stellar structure. The density and temperature of each zone are assumed to spike suddenly following the shock jump conditions in the strong shock limit (Chevalier 1989). The pressure (P) is given by

where γ is the pre-shock adiabatic index determined from our stellar models, ρ is the pre-shock density, and vshock is the shock velocity. After being shocked, the pressure is radiation-dominated, allowing us to calculate the post-shock temperature (Tshock),

where a is the radiation constant. The post-shock density (ρshock) is given by

After the material is shocked to its peak explosive temperature and density, it cools. For these models, we use a variant of the adiabatic exponential decay (Hoyle et al. 1964; Fowler & Hoyle 1964),

and

where t is the time after the the material is shocked,  s, and ρshock is the post-shock density in
  .
.
The details of the explosion for our Set 1.2 model with the delayed explosion model are shown in Figure 15. The lower mass cut is determined using the prescription in Fryer et al. (2012). Aside from the mass cut, there is no difference between our implementation of the rapid and delayed explosions (we implement the same shock velocities). In this manner, our delayed/rapid comparisons highlight the effect of the mass cut on the yield. We use an initial velocity of 2 × 109 cm s−1, and we define this as the setup for our standard model (on par with reasonably strong velocities at the launch of a shock in core-collapse calculations). We added two additional 15  models to Set 1.2 using the rapid explosion model, in which the initial shock velocity is reduced by a factor of two and four (i.e., assuming an initial vshock = 1 × 109 cm s−1 and 5 × 108 cm s−1, respectively). For comparison, the explosion characteristics for the model with vshock = 5 × 108 cm s−1 is shown in Figure 15.
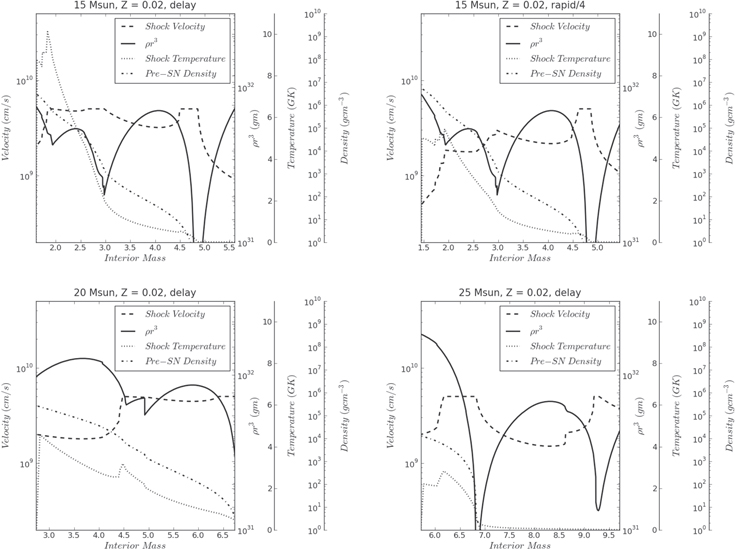
Figure 15. Details for a selection of four CCSN models of Set 1.2. Basic pre-supernova structure information (density and ρ r3 profiles), and shock velocity and temperature at the first cycle of SN simulations. The initial mass and metallicity of the model is given on top of each plot. In the same location, also the type of fallback prescription is also indicated, namely with rapid and delay. See the text for explanation. The models selected are two 15  models with delayed SN explosion and rapid/4 (where the shock velocity from explosion rapid is reduced by a factor 4), a 20
  and a 25
  models with delayed SN explosion.
Download figure:
Standard image High-resolution imageThe strong shocks in our standard model produce at similar densities higher shock temperatures than common 1D models of CCSN (e.g., Woosley & Weaver 1995), affecting the explosive nucleosynthesis. In particular, the present nucleosynthesis calculations may show many similarities with hypernovae or the high energetic components of asymmetric supernovae (e.g., Nomoto et al. 2009). At the elemental boundary layers, the shock can accelerate a small amount of material to high velocities as it travels down the density gradient. In most explosion calculations (Young & Fryer 2007), viscous forces limit this acceleration and we artificially cap our maximum velocity to vshock = 5 × 109 cm s−1.
With these analytic explosion models, we are able to understand the trends in explosive burning. To compare in detail post-explosive and pre-explosive abundances, we refer to the production factors presented in Section 3, and to the complete yields tables provided.
3. POST-PROCESSING NUCLEOSYNTHESIS CALCULATIONS
In this section, first we present the stellar yields obtained for the models described in Section 2, and the tools adopted for the nucleosynthesis simulations. In the second part of the section, we discuss the production of the elements by the nucleosynthesis processes considered in our models. In order to understand the production of elements, we first need to disentangle the different nucleosynthesis processes contributing to their isotopes. More than one process might potentially contribute to the isotope inventory, and this combination might change with the galactic evolution time. For instance, about 92% of the neutron magic isotope  observed in the solar system is produced by the s process, with a smaller contribution from the r-process (Bisterzo et al. 2014), while its production in old metal-poor r-process stars was only due to the r process (e.g., Sneden et al. 2008; Roederer et al. 2014a). Furthermore, the same nucleosynthesis process can be activated in different types of stars, eventually overlapping their respective contribution to the interstellar medium. The isotope
  is a main product of He burning in stars, and its abundance in the solar system was made by the He burning activated in both AGB stars and massive stars (e.g., Kobayashi et al. 2011b). Based on these considerations, a comprehensive nucleosynthesis analysis often requires to consider different types of stars.
The interpretation of observations can be easier for, e.g., galactic archeology studies, where the contribution from massive stars dominates the production of light elements (e.g., Nomoto et al. 2013). More generally, comparing theoretical stellar models with observations is more instructive when a single nucleosynthesis process modifies the abundance of an element. This makes it much easier to trace and isolate the origin of the process using GCE simulations (e.g., Zamora et al. 2009).
Therefore, we decided to briefly describe the production of the elements dividing them by small groups (C, N, and O in Section 3.2; F, Ne, and Na in Section 3.3; Mg, Al, and Si in Section 3.4), and by mass regions (intermediate elements between P and Sc in Section 3.5; iron group elements in Section 3.6, heavy elements between Ni and Zr in Section 3.7.1, and beyond Zr in Section 3.7.2). A similar approach has been separately used in the past to describe the nucleosynthesis in massive stars (e.g., Woosley & Weaver 1995) and in AGB stars (e.g., Ventura et al. 2013). Here we apply the same methodology but discussing together the nucleosynthesis in our models for low-mass, intermediate-mass, and massive stars.
In general, charged particle reactions in the different stellar evolutionary stages are responsible for the chemical inventory of light elements up to the iron group (e.g., Woosley et al. 2002; Karakas & Lattanzio 2014). Neutron captures are responsible for the majority of the element production beyond Fe (Käppeler et al. 2011; Thielemann et al. 2011), but they have to be included when considering the production for the production of a number of light isotopes. For instance, the neutron capture on  is relevant for the production of Na at solar metallicities in massive stars, while it is less important for the production of Na in AGB stars (see Mowlavi 1999b and Section 3.3).
The neutron-rich isotope  has a different origin compared to the other S stable isotopes, and it is fully produced by neutron captures in both AGB stars and massive stars (Section 3.5). Even if a specific nucleosynthesis process is not efficiently contributing for the GCE of an element, it may nevertheless be possible to observe the abundance signature associated with that process in other stellar associations or in single stars. For instance, AGB stars are not relevant for the chemical inventory of Ti, but the Ti isotopic ratios can be measured in presolar, carbon-rich grains carrying the s-process signature from their parent AGB stars (e.g., Zinner 2014). In metal-poor globular clusters (GCs), the second generation of stars are Na-rich and O-poor compared to the older pristine population (e.g., Gratton et al. 2012). In GCs, the Na enrichment is due to proton captures in fast rotating massive stars and/or in massive AGB stars. On the other hand, in the Milky Way for the typical metallicity range of GCs, Na is mainly made by C burning in massive stars before the CCSNe explosion (Thielemann et al. 1996).
Here we present stellar yields for AGB stars and massive stars for two metallicities, and we summarize our nucleosynthesis results for different groups of elements.
3.1. Nucleosynthesis Code and Calculated Data
The nucleosynthesis simulations are calculated using the multizone frame mppnp of the NuGrid post-processing code (e.g., Herwig et al. 2008; Pignatari & Herwig 2012). A detailed description of the code and the post-processing method is available in Appendix
Thermodynamic and structural information regarding the stellar models and CCSN explosion simulations is described in Section 2 and provides the input for the nucleosynthesis calculations. The size of the nuclear network increases dynamically as needed, up to a limit of 5234 isotopes during the CCSN explosion with 74313 reactions. The NuGrid physics package uses nuclear data from a wide range of sources, including the major nuclear physics compilations and many other individual rates (Appendix  (α, γ)
 reactions from Fynbo et al. (2005) and Kunz et al. (2002), respectively, as well as the
  (p, γ)
 reaction (Imbriani et al. 2005). The neutron source reaction
  (α, n)
 is taken from Heil et al. (2008) and the competing
  (α, n)
 and
and  (α, γ)
 reactions are taken from Jaeger et al. (2001) and Angulo et al. (1999), respectively. Experimental neutron capture reaction rates are taken, when available, from the KADoNIS compilation (Dillmann et al. 2006). For neutron capture rates not included in KADoNIS, we adopt data from the Basel REACLIB database, revision 20090121 (Rauscher & Thielemann 2000). The β-decay rates are from Oda et al. (1994) or Fuller et al. (1985) for light species and from Langanke & Martínez-Pinedo (2000) and Aikawa et al. (2005) for the iron group and for species heavier than iron; exceptions are the isomers of
  ,
,  ,
,  ,
,  , and
, and  . For isomers below the thermalization temperature, the isomeric state and the ground state are considered as separate species and terrestrial β-decay rates are used (e.g., Ward et al. 1976).
In Table 9 the isotopic overproduction factors—the final products normalized to their initial abundances—are given for stellar winds in Set 1.2. In Tables 10 and 11 the pre-explosive and explosive overproduction factors are given for massive stars at the same metallicity. Radioactive isotopes have been assumed to have decayed.
Table 9. The Overproduction Factors of Stable Isotopes in Stellar Winds for the Stars of Set 1.2
| Isotopes | 1.65 
|
2 
|
3 
|
4 
|
5 
|
15 
|
20 
|
25 
|
32 
|
60 
|
|---|---|---|---|---|---|---|---|---|---|---|
| C 12 | 1.359E+00 | 3.960E+00 | 4.869E+00 | 2.812E+00 | 1.605E+00 | 7.313E–01 | 8.061E–01 | 6.971E–01 | 5.245E–01 | 1.831E+01 |
| N 14 | 2.197E+00 | 2.422E+00 | 2.869E+00 | 3.091E+00 | 3.841E+00 | 2.361E+00 | 2.358E+00 | 3.638E+00 | 5.718E+00 | 6.287E+00 |
| O 16 | 1.038E+00 | 1.427E+00 | 1.583E+00 | 1.251E+00 | 9.846E–01 | 9.466E–01 | 9.126E–01 | 8.070E–01 | 6.297E–01 | 1.482E+00 |
| NE 20 | 9.993E–01 | 9.975E–01 | 1.007E+00 | 1.038E+00 | 1.015E+00 | 9.995E–01 | 9.990E–01 | 9.972E–01 | 9.936E–01 | 9.821E–01 |
| MG 24 | 1.003E+00 | 1.004E+00 | 1.017E+00 | 9.950E–01 | 9.952E–01 | 1.000E+00 | 1.000E+00 | 1.000E+00 | 1.000E+00 | 1.002E+00 |
| SI 28 | 9.998E–01 | 9.949E–01 | 9.985E–01 | 1.002E+00 | 1.001E+00 | 1.000E+00 | 1.000E+00 | 1.000E+00 | 1.000E+00 | 9.997E–01 |
| S 32 | 9.995E–01 | 9.923E–01 | 9.933E–01 | 9.925E–01 | 9.957E–01 | 1.000E+00 | 1.000E+00 | 1.000E+00 | 1.000E+00 | 9.968E–01 |
| CA 40 | 9.993E–01 | 9.902E–01 | 9.898E–01 | 9.899E–01 | 9.945E–01 | 1.000E+00 | 1.000E+00 | 1.000E+00 | 1.000E+00 | 9.924E–01 |
| FE 56 | 9.991E–01 | 9.885E–01 | 9.865E–01 | 9.868E–01 | 9.931E–01 | 1.000E+00 | 1.000E+00 | 1.000E+00 | 1.000E+00 | 9.918E–01 |
| ZN 70 | 9.982E–01 | 9.833E–01 | 9.862E–01 | 1.310E+00 | 1.113E+00 | 1.000E+00 | 1.000E+00 | 1.000E+00 | 1.000E+00 | 9.757E–01 |
| GE 70 | 1.006E+00 | 1.099E+00 | 1.532E+00 | 3.716E+00 | 2.236E+00 | 1.000E+00 | 1.000E+00 | 1.000E+00 | 1.000E+00 | 1.077E+00 |
| KR 80 | 1.009E+00 | 1.033E+00 | 1.091E+00 | 1.828E+00 | 1.382E+00 | 1.000E+00 | 1.000E+00 | 1.000E+00 | 1.000E+00 | 1.500E+00 |
| KR 82 | 1.013E+00 | 1.137E+00 | 1.418E+00 | 5.957E+00 | 3.193E+00 | 1.000E+00 | 1.000E+00 | 1.000E+00 | 1.000E+00 | 1.260E+00 |
| SR 88 | 1.010E+00 | 1.247E+00 | 1.671E+00 | 5.182E+00 | 2.856E+00 | 1.000E+00 | 1.000E+00 | 1.000E+00 | 1.000E+00 | 1.008E+00 |
| MO100 | 9.961E–01 | 9.971E–01 | 1.094E+00 | 1.549E+00 | 1.244E+00 | 1.000E+00 | 1.000E+00 | 1.000E+00 | 1.000E+00 | 9.108E–01 |
| RU 96 | 9.946E–01 | 9.691E–01 | 9.616E–01 | 9.795E–01 | 9.897E–01 | 1.000E+00 | 1.000E+00 | 1.000E+00 | 1.000E+00 | 8.718E–01 |
| BA136 | 1.037E+00 | 1.609E+00 | 2.774E+00 | 1.927E+00 | 1.422E+00 | 1.000E+00 | 1.000E+00 | 1.000E+00 | 1.000E+00 | 1.193E+00 |
| BA138 | 1.019E+00 | 1.416E+00 | 2.527E+00 | 1.934E+00 | 1.315E+00 | 1.000E+00 | 1.000E+00 | 1.000E+00 | 1.000E+00 | 1.010E+00 |
| PB208 | 1.000E+00 | 1.009E+00 | 1.088E+00 | 1.315E+00 | 1.084E+00 | 1.000E+00 | 1.000E+00 | 1.000E+00 | 1.000E+00 | 1.004E+00 |
Only a portion of this table is shown here to demonstrate its form and content. A machine-readable version of the full table is available.
Download table as: DataTypeset image
Table 10. The Presupernova Overproduction Factors of Stable Isotopes for Massive Stars of Set 1.2
| Isotopes | 15 
|
20 
|
25 
|
32 
|
60 
|
|---|---|---|---|---|---|
| C 12 | 7.485E+00 | 9.933E+00 | 1.734E+01 | 4.957E+01 | 3.926E+01 |
| N 14 | 3.991E+00 | 4.742E+00 | 6.146E+00 | 1.095E+00 | 3.277E–04 |
| O 16 | 8.415E+00 | 1.321E+01 | 9.806E+00 | 2.322E+01 | 5.905E+01 |
| NE 20 | 1.292E+01 | 9.048E+00 | 7.880E+00 | 4.376E+00 | 1.089E+02 |
| MG 24 | 1.425E+01 | 2.575E+01 | 3.101E+00 | 2.993E+00 | 5.444E+01 |
| SI 28 | 1.083E+01 | 1.002E+01 | 1.131E+00 | 1.178E+00 | 5.248E+00 |
| S 32 | 1.450E+00 | 1.703E+00 | 9.495E–01 | 8.698E–01 | 5.627E–01 |
| CA 40 | 9.181E–01 | 8.593E–01 | 9.179E–01 | 7.828E–01 | 2.632E–01 |
| FE 56 | 9.069E–01 | 8.311E–01 | 9.016E–01 | 7.301E–01 | 1.261E–01 |
| ZN 70 | 7.559E+00 | 1.264E+02 | 1.266E+00 | 6.678E+00 | 1.059E+02 |
| GE 70 | 7.422E+00 | 9.647E+00 | 1.272E+01 | 2.818E+01 | 2.383E+02 |
| KR 80 | 3.100E+01 | 1.793E+00 | 9.124E+00 | 1.081E+01 | 2.400E+01 |
| KR 82 | 6.427E+00 | 7.958E+00 | 7.352E+00 | 1.345E+01 | 1.286E+02 |
| SR 88 | 2.905E+00 | 4.335E+00 | 2.380E+00 | 4.767E+00 | 3.174E+01 |
| MO100 | 8.873E–01 | 1.056E+00 | 7.788E–01 | 3.546E–01 | 4.918E–01 |
| RU 96 | 8.204E–01 | 7.415E–01 | 7.320E–01 | 1.811E–01 | 4.007E–04 |
| BA136 | 1.473E+00 | 1.169E+00 | 1.701E+00 | 3.240E+00 | 2.789E+00 |
| BA138 | 1.337E+00 | 1.686E+00 | 1.385E+00 | 1.936E+00 | 4.880E+00 |
| PB208 | 1.076E+00 | 1.301E+00 | 1.130E+00 | 1.326E+00 | 3.110E+00 |
Only a portion of this table is shown here to demonstrate its form and content. A machine-readable version of the full table is available.
Download table as: DataTypeset image
Table 11. The Isotopic Overproduction Factors in Supernova Ejecta for the Stars of Set 1.2
| Isotopes | 15  Delay Delay |
15  Rapid Rapid |
20  Delay Delay |
20  Rapid Rapid |
25  Delay Delay |
32  Delay Delay |
32  Rapid Rapid |
60  Delay Delay |
|---|---|---|---|---|---|---|---|---|
| C 12 | 4.683E+00 | 4.749E+00 | 6.769E+00 | 6.911E+00 | 1.545E+01 | 3.082E+01 | 2.195E+01 | 3.488E+01 |
| N 14 | 3.811E+00 | 3.817E+00 | 4.451E+00 | 4.455E+00 | 5.664E+00 | 2.491E–01 | 1.331E–01 | 1.344E–03 |
| O 16 | 2.688E+00 | 2.713E+00 | 1.118E+01 | 1.074E+01 | 9.433E+00 | 1.908E+01 | 4.751E+01 | 5.485E+01 |
| NE 20 | 1.374E+00 | 1.368E+00 | 4.511E+00 | 3.451E+00 | 1.062E+01 | 1.132E+01 | 4.294E+01 | 8.378E+01 |
| MG 24 | 2.235E+00 | 2.165E+00 | 1.963E+01 | 1.825E+01 | 7.434E+00 | 3.092E+01 | 7.513E+01 | 9.616E+01 |
| SI 28 | 1.206E+01 | 1.108E+01 | 4.554E+01 | 4.775E+01 | 3.494E+00 | 6.432E+01 | 4.874E+01 | 7.147E+01 |
| S 32 | 1.529E+01 | 1.484E+01 | 3.786E+01 | 4.057E+01 | 2.530E+00 | 1.298E+02 | 4.129E+01 | 4.245E+01 |
| CA 40 | 2.562E+01 | 2.558E+01 | 2.749E+01 | 3.198E+01 | 8.443E–01 | 2.568E+02 | 5.385E–01 | 2.947E+01 |
| FE 56 | 1.348E+01 | 1.181E+01 | 1.263E+00 | 1.896E+00 | 8.129E–01 | 6.309E–02 | 9.048E–02 | 4.413E–01 |
| ZN 70 | 1.671E+01 | 1.687E+01 | 1.322E+02 | 1.285E+02 | 1.301E+02 | 4.593E+02 | 6.432E+02 | 5.225E+02 |
| GE 70 | 1.538E+03 | 6.690E+03 | 3.492E+01 | 3.326E+01 | 1.218E+01 | 1.716E+02 | 1.092E+02 | 1.657E+02 |
| KR 80 | 5.732E+02 | 1.995E+03 | 3.139E+01 | 3.124E+01 | 6.656E+00 | 2.404E+01 | 5.381E+01 | 1.119E+02 |
| KR 82 | 3.103E+01 | 2.831E+02 | 5.265E+00 | 4.805E+00 | 5.691E+00 | 6.134E+00 | 5.710E+01 | 6.378E+01 |
| SR 88 | 4.745E+00 | 7.659E+01 | 3.661E+00 | 3.514E+00 | 2.419E+00 | 5.380E+00 | 2.317E+01 | 4.622E+01 |
| MO100 | 1.188E+00 | 1.173E+00 | 1.721E+00 | 1.727E+00 | 1.237E+00 | 7.171E+00 | 3.401E+00 | 4.554E+00 |
| RU 96 | 7.865E–01 | 9.214E–01 | 1.180E+00 | 1.318E+00 | 6.807E–01 | 2.509E–01 | 1.770E+00 | 1.244E+00 |
| BA136 | 8.649E–01 | 8.638E–01 | 9.612E–01 | 9.642E–01 | 1.379E+00 | 9.230E–01 | 1.932E+00 | 2.106E+00 |
| BA138 | 8.569E–01 | 8.603E–01 | 1.015E+00 | 9.770E–01 | 1.312E+00 | 1.109E+00 | 2.798E+00 | 3.585E+00 |
| PB208 | 8.883E–01 | 8.903E–01 | 9.999E–01 | 9.850E–01 | 1.141E+00 | 1.361E+00 | 1.795E+00 | 2.776E+00 |
Only a portion of this table is shown here to demonstrate its form and content. A machine-readable version of the full table is available.
Download table as: DataTypeset image
The overproduction factors, OPim, for a given model of initial mass, M, for element/isotope i is given by

where EMim is the total ejected mass of element/isotope i, Mej is the ejected mass of the model, and  is the initial mass fraction of element/isotope i.
The total ejected masses include the contributions from both stellar winds and the SN explosion for massive stars and solely from the wind for low- and intermediate-mass stars. The wind contribution is given by:

where τ(m) is the final age of the star,  is the mass-loss rate,
  is the surface mass fraction abundance; the SN contribution is given by:

where mτ is the total mass of the star at τ(m),  is the compact remnant mass, and Xi(mr) is the mass fraction abundance of element/isotope i at mass coordinate mr. The same data are given in Tables 12–14 for the elemental abundances. As mentioned before, the radiogenic contribution is included. Similar information is provided for Set 1.1 in Tables 15–17 for isotopes, and in Tables 18–20 for elements, respectively. Complete tables are provided together with the analogous production factors, stellar yields in the form of ejected masses (given in solar masses; for details, see Bennett et al. 2012, for example), and net yields (see the definition in, e.g., Hirschi et al. 2005) in the NuGrid website14
. The same tables are also provided for two additional 15
is the compact remnant mass, and Xi(mr) is the mass fraction abundance of element/isotope i at mass coordinate mr. The same data are given in Tables 12–14 for the elemental abundances. As mentioned before, the radiogenic contribution is included. Similar information is provided for Set 1.1 in Tables 15–17 for isotopes, and in Tables 18–20 for elements, respectively. Complete tables are provided together with the analogous production factors, stellar yields in the form of ejected masses (given in solar masses; for details, see Bennett et al. 2012, for example), and net yields (see the definition in, e.g., Hirschi et al. 2005) in the NuGrid website14
. The same tables are also provided for two additional 15  models of Set 1.2, rapid explosion, where the initial shock velocity is assumed to be lower by a factor of two and four (see Section 2.3 for more details).
Table 12. The Element Overproduction Factors in Stellar Winds for the Stars of Set 1.2
| Elements | 1.65 
|
2 
|
3 
|
4 
|
5 
|
15 
|
20 
|
25 
|
32 
|
60 
|
|---|---|---|---|---|---|---|---|---|---|---|
| C | 1.372E+00 | 3.941E+00 | 4.839E+00 | 2.808E+00 | 1.632E+00 | 7.577E–01 | 8.292E–01 | 7.138E–01 | 5.395E–01 | 1.810E+01 |
| N | 2.190E+00 | 2.415E+00 | 2.859E+00 | 3.080E+00 | 3.828E+00 | 2.354E+00 | 2.351E+00 | 3.625E+00 | 5.697E+00 | 6.264E+00 |
| O | 1.038E+00 | 1.428E+00 | 1.583E+00 | 1.252E+00 | 9.849E–01 | 9.465E–01 | 9.125E–01 | 8.069E–01 | 6.296E–01 | 1.479E+00 |
| F | 1.356E+00 | 2.906E+00 | 4.718E+00 | 1.189E+00 | 9.000E–01 | 9.391E–01 | 8.975E–01 | 7.619E–01 | 5.591E–01 | 2.033E+00 |
| Ne | 1.068E+00 | 1.390E+00 | 1.630E+00 | 1.179E+00 | 1.053E+00 | 9.949E–01 | 9.924E–01 | 9.830E–01 | 9.665E–01 | 2.870E+00 |
| Na | 1.103E+00 | 1.398E+00 | 1.688E+00 | 1.562E+00 | 1.730E+00 | 1.264E+00 | 1.395E+00 | 1.879E+00 | 2.750E+00 | 4.410E+00 |
| Mg | 1.008E+00 | 1.080E+00 | 1.221E+00 | 1.442E+00 | 1.196E+00 | 1.000E+00 | 1.000E+00 | 1.000E+00 | 1.001E+00 | 1.094E+00 |
| Al | 1.007E+00 | 1.015E+00 | 1.030E+00 | 1.107E+00 | 1.065E+00 | 1.000E+00 | 1.001E+00 | 1.003E+00 | 1.010E+00 | 1.053E+00 |
| Si | 1.000E+00 | 9.970E–01 | 1.003E+00 | 1.008E+00 | 1.004E+00 | 1.000E+00 | 1.000E+00 | 1.000E+00 | 1.000E+00 | 1.001E+00 |
| S | 9.997E–01 | 9.934E–01 | 9.954E–01 | 9.947E–01 | 9.967E–01 | 1.000E+00 | 1.000E+00 | 1.000E+00 | 1.000E+00 | 9.983E–01 |
| Ar | 9.993E–01 | 9.912E–01 | 9.924E–01 | 9.942E–01 | 9.965E–01 | 1.000E+00 | 1.000E+00 | 1.000E+00 | 1.000E+00 | 9.920E–01 |
| Ca | 9.994E–01 | 9.913E–01 | 9.918E–01 | 9.919E–01 | 9.954E–01 | 1.000E+00 | 1.000E+00 | 1.000E+00 | 1.000E+00 | 9.932E–01 |
| Fe | 9.998E–01 | 9.940E–01 | 9.958E–01 | 9.928E–01 | 9.957E–01 | 1.000E+00 | 1.000E+00 | 1.000E+00 | 1.000E+00 | 9.985E–01 |
| Sr | 1.014E+00 | 1.247E+00 | 1.654E+00 | 5.058E+00 | 2.802E+00 | 1.001E+00 | 1.001E+00 | 1.001E+00 | 1.001E+00 | 1.049E+00 |
| Ba | 1.020E+00 | 1.406E+00 | 2.425E+00 | 1.926E+00 | 1.343E+00 | 1.000E+00 | 1.000E+00 | 1.000E+00 | 1.000E+00 | 1.036E+00 |
| Eu | 9.952E–01 | 9.890E–01 | 1.039E+00 | 1.050E+00 | 1.005E+00 | 1.000E+00 | 1.000E+00 | 1.000E+00 | 1.000E+00 | 8.414E–01 |
| Pb | 1.002E+00 | 1.038E+00 | 1.212E+00 | 1.431E+00 | 1.108E+00 | 1.000E+00 | 1.000E+00 | 1.000E+00 | 1.000E+00 | 1.005E+00 |
Only a portion of this table is shown here to demonstrate its form and content. A machine-readable version of the full table is available.
Download table as: DataTypeset image
Table 13. The Presupernova Elemental Overproduction Factors for Massive Stars of Set 1.2
| Elements | 15 
|
20 
|
25 
|
32 
|
60 
|
|---|---|---|---|---|---|
| C | 7.413E+00 | 9.831E+00 | 1.753E+01 | 4.897E+01 | 3.879E+01 |
| N | 3.977E+00 | 4.724E+00 | 6.122E+00 | 1.093E+00 | 3.292E–04 |
| O | 8.473E+00 | 1.319E+01 | 9.781E+00 | 2.317E+01 | 5.889E+01 |
| F | 7.109E–01 | 8.894E–01 | 2.174E+00 | 2.033E+01 | 6.660E–03 |
| Ne | 1.323E+01 | 1.020E+01 | 1.067E+01 | 1.153E+01 | 1.013E+02 |
| Na | 9.258E+00 | 5.741E+00 | 1.517E+01 | 7.987E+00 | 8.901E+01 |
| Mg | 1.465E+01 | 2.542E+01 | 5.196E+00 | 8.657E+00 | 7.074E+01 |
| Al | 5.790E+00 | 9.506E+00 | 3.073E+00 | 2.213E+00 | 3.300E+01 |
| Si | 1.403E+01 | 1.323E+01 | 1.205E+00 | 1.402E+00 | 8.233E+00 |
| S | 7.007E+00 | 1.790E+00 | 9.596E–01 | 9.035E–01 | 6.739E–01 |
| Ar | 2.826E+00 | 9.434E–01 | 9.552E–01 | 8.718E–01 | 7.024E–01 |
| Ca | 9.360E–01 | 8.894E–01 | 9.340E–01 | 8.241E–01 | 4.151E–01 |
| Fe | 9.518E–01 | 8.993E–01 | 9.508E–01 | 8.812E–01 | 3.547E–01 |
| Sr | 2.871E+00 | 3.968E+00 | 2.824E+00 | 5.811E+00 | 3.327E+01 |
| Ba | 1.310E+00 | 1.533E+00 | 1.382E+00 | 2.012E+00 | 4.178E+00 |
| Eu | 7.762E–01 | 7.155E–01 | 6.702E–01 | 2.432E–01 | 1.006E–01 |
| Pb | 1.164E+00 | 1.419E+00 | 1.243E+00 | 1.595E+00 | 3.579E+00 |
Only a portion of this table is shown here to demonstrate its form and content. A machine-readable version of the full table is available.
Download table as: DataTypeset image
Table 14. The Elemental Overproduction Factors in Supernova Ejecta for the Stars of Set 1.2
| Elements | 15  Delay Delay |
15  Rapid Rapid |
20  Delay Delay |
20  Rapid Rapid |
25  Delay Delay |
32  Delay Delay |
32  Rapid Rapid |
60  Delay Delay |
|---|---|---|---|---|---|---|---|---|
| C | 4.644E+00 | 4.639E+00 | 6.704E+00 | 6.862E+00 | 1.569E+01 | 3.045E+01 | 2.168E+01 | 3.446E+01 |
| N | 3.800E+00 | 3.749E+00 | 4.436E+00 | 4.452E+00 | 5.655E+00 | 2.504E–01 | 1.332E–01 | 1.357E–03 |
| O | 2.729E+00 | 2.714E+00 | 1.116E+01 | 1.075E+01 | 9.409E+00 | 1.903E+01 | 4.739E+01 | 5.470E+01 |
| F | 2.313E+00 | 2.219E+00 | 7.752E–01 | 7.775E–01 | 2.111E+00 | 2.162E+00 | 1.641E+00 | 1.333E–02 |
| Ne | 2.077E+00 | 2.051E+00 | 4.834E+00 | 3.869E+00 | 1.266E+01 | 1.117E+01 | 4.042E+01 | 7.747E+01 |
| Na | 2.739E+00 | 2.703E+00 | 4.539E+00 | 4.191E+00 | 1.473E+01 | 6.252E+00 | 1.513E+01 | 6.026E+01 |
| Mg | 2.617E+00 | 2.513E+00 | 1.740E+01 | 1.606E+01 | 8.804E+00 | 3.146E+01 | 7.237E+01 | 9.227E+01 |
| Al | 1.572E+00 | 1.556E+00 | 5.024E+00 | 4.650E+00 | 4.779E+00 | 1.022E+01 | 2.586E+01 | 3.431E+01 |
| Si | 1.210E+01 | 1.100E+01 | 4.646E+01 | 4.853E+01 | 4.684E+00 | 6.835E+01 | 6.008E+01 | 7.731E+01 |
| S | 1.623E+01 | 1.490E+01 | 4.107E+01 | 4.376E+01 | 2.934E+00 | 1.339E+02 | 4.560E+01 | 4.686E+01 |
| Ar | 2.877E+01 | 2.774E+01 | 4.805E+01 | 5.291E+01 | 1.579E+00 | 3.167E+02 | 1.855E+01 | 4.930E+01 |
| Ca | 2.541E+01 | 2.496E+01 | 2.697E+01 | 3.138E+01 | 8.759E–01 | 2.538E+02 | 7.672E–01 | 2.887E+01 |
| Fe | 1.371E+01 | 1.183E+01 | 2.345E+00 | 3.154E+00 | 8.397E–01 | 1.193E–01 | 2.419E–01 | 1.444E+00 |
| Sr | 1.270E+01 | 1.006E+02 | 3.446E+00 | 3.322E+00 | 2.541E+00 | 4.768E+00 | 2.056E+01 | 4.225E+01 |
| Ba | 8.680E–01 | 8.582E–01 | 1.071E+00 | 1.046E+00 | 1.285E+00 | 1.293E+00 | 2.617E+00 | 3.219E+00 |
| Eu | 7.889E–01 | 7.715E–01 | 7.763E–01 | 7.800E–01 | 6.744E–01 | 1.088E+00 | 4.061E–01 | 4.115E–01 |
| Pb | 8.765E–01 | 8.657E–01 | 9.736E–01 | 9.516E–01 | 1.175E+00 | 1.453E+00 | 2.098E+00 | 2.800E+00 |
Only a portion of this table is shown here to demonstrate its form and content. A machine-readable version of the full table is available.
Download table as: DataTypeset image
Table 15. The Overproduction Factors of Stable Isotopes in Stellar Winds for the Stars of Set 1.1
| Isotopes | 1.65 
|
2 
|
3 
|
4 
|
5 
|
15 
|
20 
|
25 
|
|---|---|---|---|---|---|---|---|---|
| C 12 | 2.613E+00 | 7.766E+00 | 7.423E+00 | 3.646E+00 | 1.948E+00 | 8.411E–01 | 8.580E–01 | 7.541E–01 |
| N 14 | 2.287E+00 | 2.623E+00 | 3.077E+00 | 3.493E+00 | 4.617E+00 | 1.650E+00 | 1.837E+00 | 3.046E+00 |
| O 16 | 1.190E+00 | 2.074E+00 | 1.975E+00 | 1.301E+00 | 1.013E+00 | 9.821E–01 | 9.530E–01 | 8.511E–01 |
| NE 20 | 9.995E–01 | 1.008E+00 | 1.017E+00 | 1.041E+00 | 1.025E+00 | 9.997E–01 | 9.989E–01 | 9.959E–01 |
| MG 24 | 1.005E+00 | 1.016E+00 | 1.015E+00 | 9.956E–01 | 1.000E+00 | 1.000E+00 | 1.000E+00 | 1.000E+00 |
| SI 28 | 9.999E–01 | 9.995E–01 | 9.980E–01 | 1.005E+00 | 1.005E+00 | 1.000E+00 | 1.000E+00 | 1.000E+00 |
| S 32 | 9.994E–01 | 9.960E–01 | 9.925E–01 | 9.952E–01 | 9.975E–01 | 1.000E+00 | 1.000E+00 | 1.000E+00 |
| CA 40 | 9.990E–01 | 9.932E–01 | 9.891E–01 | 9.934E–01 | 9.966E–01 | 1.000E+00 | 1.000E+00 | 1.000E+00 |
| FE 56 | 9.987E–01 | 9.913E–01 | 9.861E–01 | 9.915E–01 | 9.956E–01 | 1.000E+00 | 1.000E+00 | 1.000E+00 |
| ZN 70 | 9.974E–01 | 9.861E–01 | 1.007E+00 | 1.173E+00 | 1.084E+00 | 1.000E+00 | 1.000E+00 | 1.000E+00 |
| GE 70 | 1.012E+00 | 1.188E+00 | 1.797E+00 | 2.845E+00 | 1.929E+00 | 1.000E+00 | 1.000E+00 | 1.000E+00 |
| KR 80 | 1.007E+00 | 1.046E+00 | 1.105E+00 | 1.566E+00 | 1.310E+00 | 1.000E+00 | 1.000E+00 | 1.000E+00 |
| KR 82 | 1.019E+00 | 1.204E+00 | 1.502E+00 | 4.392E+00 | 2.741E+00 | 1.000E+00 | 1.000E+00 | 1.000E+00 |
| SR 88 | 1.018E+00 | 1.385E+00 | 1.563E+00 | 3.820E+00 | 2.470E+00 | 1.000E+00 | 1.000E+00 | 1.000E+00 |
| MO100 | 9.954E–01 | 1.022E+00 | 1.131E+00 | 1.382E+00 | 1.187E+00 | 1.000E+00 | 1.000E+00 | 1.000E+00 |
| RU 96 | 9.930E–01 | 9.715E–01 | 9.689E–01 | 9.871E–01 | 9.936E–01 | 1.000E+00 | 1.000E+00 | 1.000E+00 |
| BA136 | 1.075E+00 | 2.197E+00 | 2.699E+00 | 1.643E+00 | 1.287E+00 | 1.000E+00 | 1.000E+00 | 1.000E+00 |
| BA138 | 1.060E+00 | 2.238E+00 | 3.301E+00 | 1.654E+00 | 1.226E+00 | 1.000E+00 | 1.000E+00 | 1.000E+00 |
| PB208 | 1.020E+00 | 1.408E+00 | 3.466E+00 | 2.109E+00 | 1.470E+00 | 1.000E+00 | 1.000E+00 | 1.000E+00 |
Only a portion of this table is shown here to demonstrate its form and content. A machine-readable version of the full table is available.
Download table as: DataTypeset image
Table 16. The Presupernova Overproduction Factors of Stable Isotopes for Massive Stars of Set 1.1
| Isotopes | 15 
|
20 
|
25 
|
|---|---|---|---|
| C 12 | 1.323E+01 | 2.297E+01 | 3.048E+01 |
| N 14 | 4.595E+00 | 4.786E+00 | 7.325E+00 |
| O 16 | 1.553E+01 | 2.743E+01 | 1.650E+01 |
| NE 20 | 2.194E+01 | 4.006E+01 | 4.366E+00 |
| MG 24 | 3.538E+01 | 3.351E+01 | 1.859E+00 |
| SI 28 | 1.930E+01 | 4.990E+00 | 1.033E+00 |
| S 32 | 1.887E+00 | 1.050E+00 | 9.545E–01 |
| CA 40 | 9.222E–01 | 8.742E–01 | 9.266E–01 |
| FE 56 | 9.099E–01 | 8.459E–01 | 9.107E–01 |
| ZN 70 | 6.060E+00 | 2.175E+01 | 9.024E–01 |
| GE 70 | 5.032E+00 | 1.786E+01 | 8.033E+00 |
| KR 80 | 7.353E+00 | 3.061E+00 | 5.602E+00 |
| KR 82 | 3.204E+00 | 8.185E+00 | 3.868E+00 |
| SR 88 | 1.995E+00 | 2.906E+00 | 2.028E+00 |
| MO100 | 8.878E–01 | 7.895E–01 | 8.038E–01 |
| RU 96 | 8.397E–01 | 7.191E–01 | 7.559E–01 |
| BA136 | 1.367E+00 | 1.579E+00 | 1.598E+00 |
| BA138 | 1.284E+00 | 1.654E+00 | 1.347E+00 |
| PB208 | 1.053E+00 | 1.245E+00 | 1.103E+00 |
Only a portion of this table is shown here to demonstrate its form and content. A machine-readable version of the full table is available.
Download table as: DataTypeset image
Table 17. The Overproduction Factors of Stable Isotopes in Supernova Ejecta for the Stars of Set 1.1
| Isotopes | 15  Delay Delay |
15  Rapid Rapid |
20  Delay Delay |
20  Rapid Rapid |
25  Delay Delay |
25  rapid rapid |
|---|---|---|---|---|---|---|
| C 12 | 8.389E+00 | 8.588E+00 | 1.843E+01 | 1.945E+01 | 2.458E+01 | 4.680E+00 |
| N 14 | 4.398E+00 | 4.396E+00 | 4.807E+00 | 4.803E+00 | 6.757E+00 | 6.340E+00 |
| O 16 | 3.989E+00 | 3.999E+00 | 2.583E+01 | 2.441E+01 | 1.499E+01 | 3.246E–01 |
| NE 20 | 1.900E+00 | 1.918E+00 | 1.094E+01 | 6.742E+00 | 1.304E+01 | 6.958E–01 |
| MG 24 | 7.473E+00 | 7.092E+00 | 3.864E+01 | 3.196E+01 | 2.351E+01 | 7.256E–01 |
| SI 28 | 2.875E+01 | 2.526E+01 | 7.304E+01 | 8.810E+01 | 1.329E+01 | 7.216E–01 |
| S 32 | 3.038E+01 | 2.940E+01 | 6.475E+01 | 7.815E+01 | 7.300E+00 | 7.204E–01 |
| CA 40 | 5.377E+01 | 5.812E+01 | 4.959E+01 | 9.568E+01 | 1.066E+00 | 7.181E–01 |
| FE 56 | 2.591E+01 | 2.348E+01 | 1.281E+00 | 6.752E+01 | 8.195E–01 | 7.181E–01 |
| ZN 70 | 2.227E+01 | 2.940E+01 | 1.200E+02 | 1.133E+02 | 1.486E+02 | 7.101E–01 |
| GE 70 | 6.701E+03 | 4.188E+04 | 1.718E+01 | 4.693E+01 | 4.214E+01 | 7.562E–01 |
| KR 80 | 2.510E+03 | 1.214E+04 | 2.239E+01 | 2.774E+01 | 7.606E+00 | 1.119E+00 |
| KR 82 | 2.166E+02 | 2.349E+03 | 3.575E+00 | 4.060E+00 | 2.485E+00 | 8.493E–01 |
| SR 88 | 3.549E+01 | 1.996E+03 | 2.413E+00 | 2.310E+00 | 2.010E+00 | 7.251E–01 |
| MO100 | 1.284E+00 | 1.266E+00 | 1.794E+00 | 1.641E+00 | 1.552E+00 | 6.736E–01 |
| RU 96 | 8.879E–01 | 9.319E–01 | 9.625E–01 | 1.299E+00 | 7.189E–01 | 6.459E–01 |
| BA136 | 8.295E–01 | 8.318E–01 | 1.220E+00 | 1.204E+00 | 1.264E+00 | 8.202E–01 |
| BA138 | 8.437E–01 | 8.464E–01 | 1.158E+00 | 1.084E+00 | 1.206E+00 | 7.261E–01 |
| PB208 | 8.882E–01 | 8.893E–01 | 1.027E+00 | 9.828E–01 | 1.142E+00 | 7.234E–01 |
Only a portion of this table is shown here to demonstrate its form and content. A machine-readable version of the full table is available.
Download table as: DataTypeset image
Table 18. The Element Overproduction Factors in Stellar Winds for the Stars of Set 1.1
| Elements | 1.65 
|
2 
|
3 
|
4 
|
5 
|
15 
|
20 
|
25 
|
|---|---|---|---|---|---|---|---|---|
| C | 2.611E+00 | 7.701E+00 | 7.362E+00 | 3.637E+00 | 1.979E+00 | 8.697E–01 | 8.811E–01 | 7.772E–01 |
| N | 2.280E+00 | 2.615E+00 | 3.067E+00 | 3.481E+00 | 4.600E+00 | 1.646E+00 | 1.832E+00 | 3.036E+00 |
| O | 1.190E+00 | 2.074E+00 | 1.974E+00 | 1.300E+00 | 1.013E+00 | 9.820E–01 | 9.529E–01 | 8.510E–01 |
| F | 1.419E+00 | 4.446E+00 | 5.102E+00 | 1.064E+00 | 8.237E–01 | 9.809E–01 | 9.484E–01 | 8.290E–01 |
| Ne | 1.088E+00 | 1.591E+00 | 1.566E+00 | 1.131E+00 | 1.046E+00 | 9.983E–01 | 9.957E–01 | 9.854E–01 |
| Na | 1.155E+00 | 1.505E+00 | 1.624E+00 | 1.641E+00 | 1.809E+00 | 1.089E+00 | 1.227E+00 | 1.766E+00 |
| Mg | 1.015E+00 | 1.118E+00 | 1.247E+00 | 1.304E+00 | 1.160E+00 | 1.000E+00 | 1.000E+00 | 1.000E+00 |
| Al | 1.011E+00 | 1.028E+00 | 1.039E+00 | 1.125E+00 | 1.081E+00 | 1.000E+00 | 1.001E+00 | 1.007E+00 |
| Si | 1.000E+00 | 1.002E+00 | 1.002E+00 | 1.009E+00 | 1.007E+00 | 1.000E+00 | 1.000E+00 | 1.000E+00 |
| S | 9.996E–01 | 9.973E–01 | 9.945E–01 | 9.966E–01 | 9.983E–01 | 1.000E+00 | 1.000E+00 | 1.000E+00 |
| Ar | 9.991E–01 | 9.948E–01 | 9.923E–01 | 9.963E–01 | 9.981E–01 | 1.000E+00 | 1.000E+00 | 1.000E+00 |
| Ca | 9.992E–01 | 9.948E–01 | 9.911E–01 | 9.947E–01 | 9.973E–01 | 1.000E+00 | 1.000E+00 | 1.000E+00 |
| Fe | 9.998E–01 | 9.979E–01 | 9.943E–01 | 9.952E–01 | 9.975E–01 | 1.000E+00 | 1.000E+00 | 1.000E+00 |
| Sr | 1.021E+00 | 1.377E+00 | 1.543E+00 | 3.723E+00 | 2.414E+00 | 1.000E+00 | 1.000E+00 | 1.000E+00 |
| Ba | 1.056E+00 | 2.098E+00 | 2.975E+00 | 1.619E+00 | 1.226E+00 | 1.000E+00 | 1.000E+00 | 1.000E+00 |
| Eu | 9.977E–01 | 1.062E+00 | 1.154E+00 | 1.033E+00 | 1.006E+00 | 1.000E+00 | 1.000E+00 | 1.000E+00 |
| Pb | 1.035E+00 | 1.714E+00 | 3.810E+00 | 2.018E+00 | 1.382E+00 | 1.000E+00 | 1.000E+00 | 1.000E+00 |
Only a portion of this table is shown here to demonstrate its form and content. A machine-readable version of the full table is available.
Download table as: DataTypeset image
Table 19. The Presupernova Overproduction Factors for the Massive Stars of Set 1.1
| Elements | 15 
|
20 
|
25 
|
|---|---|---|---|
| C | 1.309E+01 | 2.271E+01 | 3.073E+01 |
| N | 4.577E+00 | 4.768E+00 | 7.296E+00 |
| O | 1.553E+01 | 2.736E+01 | 1.646E+01 |
| F | 5.182E–01 | 1.731E+00 | 1.913E+00 |
| Ne | 2.126E+01 | 3.915E+01 | 7.307E+00 |
| Na | 7.803E+00 | 1.865E+01 | 9.769E+00 |
| Mg | 3.223E+01 | 3.297E+01 | 3.792E+00 |
| Al | 9.858E+00 | 9.358E+00 | 1.644E+00 |
| Si | 2.480E+01 | 6.178E+00 | 1.071E+00 |
| S | 9.532E+00 | 1.077E+00 | 9.639E–01 |
| Ar | 3.195E+00 | 9.445E–01 | 9.582E–01 |
| Ca | 9.399E–01 | 9.004E–01 | 9.408E–01 |
| Fe | 9.568E–01 | 9.123E–01 | 9.574E–01 |
| Sr | 1.950E+00 | 2.965E+00 | 2.332E+00 |
| Ba | 1.286E+00 | 1.558E+00 | 1.339E+00 |
| Eu | 7.936E–01 | 6.864E–01 | 6.920E–01 |
| Pb | 1.136E+00 | 1.410E+00 | 1.225E+00 |
Only a portion of this table is shown here to demonstrate its form and content. A machine-readable version of the full table is available.
Download table as: DataTypeset image
Table 20. The Elemental Overproduction Factors in Supernova Ejecta for the Stars of Set 1.1
| Elements | 15  Delay Delay |
15  Rapid Rapid |
20  Delay Delay |
20  Rapid Rapid |
25  Delay Delay |
25  rapid rapid |
|---|---|---|---|---|---|---|
| C | 8.306E+00 | 8.370E+00 | 1.823E+01 | 1.783E+01 | 2.497E+01 | 6.480E+00 |
| N | 4.386E+00 | 4.316E+00 | 4.789E+00 | 4.434E+00 | 6.835E+00 | 8.174E+00 |
| O | 3.992E+00 | 3.941E+00 | 2.576E+01 | 2.256E+01 | 1.496E+01 | 4.194E–01 |
| F | 2.322E+00 | 2.181E+00 | 9.823E–01 | 9.800E–01 | 1.811E+00 | 1.624E+00 |
| Ne | 2.172E+00 | 2.169E+00 | 1.101E+01 | 6.705E+00 | 1.468E+01 | 3.042E+00 |
| Na | 3.215E+00 | 3.137E+00 | 6.223E+00 | 4.613E+00 | 9.820E+00 | 5.576E+00 |
| Mg | 6.772E+00 | 6.359E+00 | 3.285E+01 | 2.507E+01 | 2.020E+01 | 9.486E–01 |
| Al | 2.376E+00 | 2.384E+00 | 7.125E+00 | 5.675E+00 | 5.090E+00 | 1.035E+00 |
| Si | 2.924E+01 | 2.460E+01 | 7.254E+01 | 8.034E+01 | 1.451E+01 | 9.347E–01 |
| S | 3.310E+01 | 2.873E+01 | 6.644E+01 | 7.475E+01 | 7.958E+00 | 9.332E–01 |
| Ar | 5.531E+01 | 5.528E+01 | 8.342E+01 | 1.064E+02 | 5.012E+00 | 9.292E–01 |
| Ca | 5.303E+01 | 5.606E+01 | 4.824E+01 | 8.630E+01 | 1.151E+00 | 9.298E–01 |
| Fe | 2.565E+01 | 2.298E+01 | 2.139E+00 | 6.094E+01 | 8.352E–01 | 9.330E–01 |
| Sr | 7.291E+01 | 1.892E+03 | 2.336E+00 | 2.139E+00 | 1.949E+00 | 9.625E–01 |
| Ba | 8.572E–01 | 8.454E–01 | 1.172E+00 | 1.037E+00 | 1.213E+00 | 9.562E–01 |
| Eu | 8.153E–01 | 7.928E–01 | 8.168E–01 | 7.734E–01 | 7.298E–01 | 7.691E–01 |
| Pb | 8.721E–01 | 8.605E–01 | 1.057E+00 | 9.339E–01 | 1.108E+00 | 9.370E–01 |
Only a portion of this table is shown here to demonstrate its form and content. A machine-readable version of the full table is available.
Download table as: DataTypeset image
The analysis of nucleosynthesis in 1D explosion simulations provides fundamental information that is required to understand how species are formed or modified under these extreme conditions (e.g., Woosley & Weaver 1995). The primary goal of our SN yield calculations is to estimate which elements and isotopes would be strongly affected by explosive nucleosynthesis in the CCSN. An overview of this information is available in Figure 16 for a selection of models. At a given shock density, our explosions feature shock temperatures larger than usual 1D CCSN simulations (e.g., Woosley & Weaver 1995), and our models therefore give some insight into the yields of such explosions. Complete tables with pre-explosive and post-explosive abundances, overproduction factors, production factors, yields in solar masses, and net yields, as well as the thermodynamic histories from these models, are available (Appendix

Figure 16. Final isotopic distribution between C and Ni after the explosion are compared to pre-explosive abundances for the models in Figure 15: two 15  models with delayed SN explosion and rapid/4 (where the shock velocity from explosion rapid is reduced by a factor 4), a 20
  and a 25
  models with delayed SN explosion. For a detailed comparison for all the species and for all the models, we refer to the Tables 11 and 10 for Set 1.2, and Tables 16 and 17 for Set 1.1.
Download figure:
Standard image High-resolution imageBased on our calculations, we present in the following a discussion of the different element groups and their production in different mass regimes and evolution phases. There is a comprehensive literature for the nucleosynthesis in massive stars (Woosley et al. 1973; Arnett & Thielemann 1985; Thielemann & Arnett 1985; Woosley & Weaver 1995; Thielemann et al. 1996; Chieffi et al. 1998; Limongi et al. 2000; Rauscher et al. 2002; Woosley et al. 2002; Nomoto et al. 2013) as well as for low- and intermediate-mass stars (e.g., Bisterzo et al. 2010; Cristallo et al. 2011; Ventura et al. 2013; Karakas & Lattanzio 2014; Cristallo et al. 2015). The solar system abundances are comprised of contributions from different stellar sources. In our analysis, we compare the production of the same isotope in different types of stars.
The discussion will follow the yield plots (Figures 17–22) for Set 1.2. Similar plots are available for all stable isotopes and elements for both metallicities. The yield plots show the weighted stellar yields in the following sense. For each initial mass, the ejected amount (during the wind as well as during the final SN or wind ejection as appropriate) in solar masses is weighted by a Salpeter IMF (α exponent = 2.35) sampled by non-uniform initial mass intervals, normalized to 1  , and represented by a dashed black line in the yield plots. The initial mass intervals are chosen in such a way that initial masses in the same interval are considered to possess similar nucleosynthetic production mechanisms that are represented by one of the stellar models in our set. The dashed line corresponds to the return of the same amount of material that was present in the star from the initial abundance distribution. A yield line above or below the dashed line thus corresponds to production and destruction, respectively. These plots therefore allow us to compare the contribution from stars with different initial masses through their production factors (the ratio of the yield line with the IMF line), as well as the relative importance of the contributing mass range (via the difference of the yield line and the IMF line), under the assumption that stars of all masses have enough time to return their winds and ejecta. While low- and intermediate-mass stars eject all their yields during the wind phase (into which even a rapid superwind phase at the end is included), we distinguish for the massive stars between contributions from different processes; the wind yields are the ejecta returned during the pre-SN stellar evolution mass loss; the pre-SN contribution is an imaginary component that represents the ejecta that the SN would mechanically expel without any explosive nucleosynthesis. It is basically the integral of the layers to be ejected just before the explosion. For the SN contribution, different options are shown, reflecting some of the uncertainties in modeling the explosions. Note here that the explosive contribution is separated from the wind contribution, as in Tables 11, 14, 17 and 20. In other words, these figures show the wind yields and the explosive yields weighted over the Salpeter initial mass function, providing the stellar yields representative of each mass range. In this work we do not include models representative for the mass range 7–11
  . In such a range there are super-AGB stars, electron-capture supernovae, and the lowest mass iron-core collapse supernovae (Jones et al. 2013). Therefore, in Figures 17–22 this mass range is shaded.
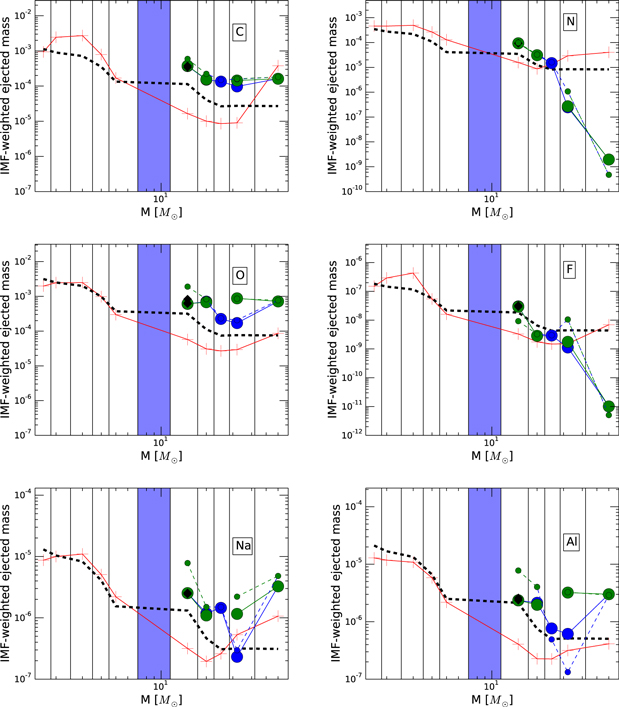
Figure 17. IMF-weighted ejected masses in solar mass unit for different stellar masses from Set 1.2. The ΔM limits used for the IMF weight are shown. No models representative of the mass range M = 7–11  are considered (see the text in Section 3.1). Big red crosses are the contribution by stellar winds. Small green and blue circles are the pre-supernova abundances between the remnant mass and the surface of the star when core collapse starts, associated with the SN fallback prescription delay and rapid (see Section 2.3). Green and blue large circles are the abundances including the explosive contributions according to the two fallback assumptions. Black diamonds show the yields including rapid SN with reduced explosion energy. In order to clarify if a model has a positive contribution to the chemical enrichment of, e.g., carbon, we report the initial content for comparison (black dashed line). A positive production requires that the yield is larger than the value given by the dashed line.
Download figure:
Standard image High-resolution imageThe production of Li, Be, and B is not fully available in this release, since our stellar models miss some important physics processes that contribute to their their nucleosynthesis. Li production from intermediate-mass stars through HBB during the AGB phase (initial mass higher than ∼4  ; e.g., Lattanzio & Forestini 1999) is present in the 4 and 5
  models. Model predictions for Li have to be taken from the MESA profile output, which was computed with coupled mixing and nuclear burning operators. The mppnp post-processing output employs an operator split, which does not accurately resolve the Cameron-Fowler transport mechanism with the present time stepping algorithm. A finer mass grid is required, however, for a thorough characterization of HBB Li yields. Li may also be produced as a result of extra-mixing (the so-called cool bottom process) in AGB and RGB stars with lower initial masses (Sackmann & Boothroyd 1999; Nollett et al. 2003; Denissenkov & Merryfield 2011; Palmerini et al. 2011). Such non-standard mixing processes are not included in this model generation. Furthermore, in these stars Li predictions are also quite uncertain, as shown by Lattanzio et al. (2015). Indeed, by comparing the results from different codes (including MESA), Lattanzio et al. (2015) show that Li is drastically affected by, e.g., the timestep criterion and spatial mesh refinement, and that a preliminary convergence analysis need to be done before safely using Li stellar yields.
The production of Be and B in stars is mostly due to neutrino irradiation on  and
and  , respectively, during CCSN (e.g., Woosley et al. 2002; Nakamura et al. 2010; Banerjee et al. 2013) and hypernovae (Fields et al. 2002). In the present models, we do not include neutrino nucleosynthesis.
3.2. C, N, and O
C is efficiently produced by both low-mass and massive stars (e.g., Goswami & Prantzos 2000; Woosley et al. 2002) in He-shell burning. In massive stars,  can originate from the portion of He-core ashes that is ejected by the SN explosion; a non-negligible contribution from W–R stars with masses larger than 25–30
  has been suggested in order to reproduce carbon abundances in the Galactic disk (e.g., Gustafsson et al. 1999). In low-mass stars,
  comes from the triple-α reaction in the He-shell flash and is brought to the surface in the third dredge-up mixing following the TP (e.g., Herwig 2005, and references therein).
In our calculations (Figure 17, Tables 12 and 18 for wind contributions, Tables 20 and 14 for explosive contributions) the production factors of low-mass stars and massive stars are similar (see also Dray et al. 2003). The  yields are similar for both metallicities corresponding to the primary nature of C production; the weighted yield from massive stars is a factor of about 5–10 lower than from the low-mass star regime, and comes mostly from (pre-)SN ejecta. Only the 60
  model has a dominant wind contribution, while the massive star models with lower initial masses are dominated by C formed during the pre-SN evolution and ejected in the explosion. An exception is the 25
  , Z = 0.01 case with rapid explosion, where the fallback mass is larger compared to other models of the same mass and the amount of carbon ejected is insignificant. In general, our models confirm previous results that the production factor of carbon tends to increase with the initial stellar mass.
For low-mass stars, the C production increases with the initial mass, peaking at the 3  models and then decreasing again for the 4 and 5
  models by a factor of approximately 2 due to HBB (e.g., Lattanzio & Forestini 1999; Herwig 2004a). We do not include possible effects due to binary evolution, which may reduce the C contribution from AGB stars (by about 15%, according to, e.g., Tout et al. 1999).
N in the solar system is mostly produced by AGB stars (e.g., Spite et al. 2005, and Figure 17). In more massive stars, the amount of N from winds is similar to the SN explosion ejecta for the 25  model (Tables 12 and 14) due to the enhanced mass-loss efficiency, while in the 32
  and the 60
  models the contribution from winds dominates. The N production only weakly depends on the SN explosion and is mostly located in the more external He-rich layers of the star that have not yet been processed by He burning; the isotope
  is converted to
  under helium-burning conditions (e.g., Peters 1968). In AGB stars the amount of N lost by stellar winds increases with initial mass (Table 12). In particular, in the 5
  models, the production of
  increases while
  decreases, due to HBB (e.g., Lattanzio & Forestini 1999). Again, as with C, production factors of N for low-, intermediate-, and high-mass stars are similar but, in terms of weighted yields, AGB stars dominate N production for both metallicities (Figure 17).
After H and He, O is the most abundant element in the solar system. Most of it is considered to be produced in massive stars, and possibly from low-mass AGB stars due to the O enrichment in the He intershell (Herwig 2000). Most of the O from massive stars is ejected by the SN explosion, but is of pre-SN origin. Thus, according to standard 1D SN models, the amount of ejected oxygen increases with initial mass (see, e.g., Thielemann et al. 1996). Our models take into account fallback and, as a result, the 20  model ejects more
  than both the 15
  and 25
  models (Table 14). The amount of ejected O increases again in the 32
  and 60
  models because of the correspondingly smaller compact remnant masses. The high temperature in the 15
  case (see Section 2.3) leads to the destruction of a large fraction of O made during the pre-SN phase (see Tables 14 and 13; Figure 17).
Our AGB models produce O due to the CBM applied at the bottom of the He-shell flash convection zone (see Section 2). O is then brought to the envelope along with C during the third dredge-up.  is a primary product of the He burning reaction
  (α, γ)
 following the triple-α reaction in the He intershell region. For instance, from Tables 9 and 15 the overproduction factors for the M = 2
  star at Z = 0.02 and Z = 0.01 corresponds to the same increase of
  , independent of the initial abundance. This source of O may be relevant to the total O inventory in the Galaxy (see Figure 17 and Tables 12 and 18, and discussion in Delgado-Inglada et al. 2015), but GCE simulations are needed to verify this possibility. For a comparison with O yields provided by other groups, we refer to Section 3.8.
3.3. F, Ne, and Na
F is produced in massive stars during the CCSN—predominantly via neutrino spallation on  (e.g., Woosley & Haxton 1988; Kobayashi et al. 2011a), the WR wind phase (Meynet & Maeder 2000)—and low-mass AGB stars (e.g., Jorissen et al. 1992; Lugaro et al. 2004; Cristallo et al. 2007; Stancliffe et al. 2007; Karakas et al. 2008). No relevant contribution is expected from massive AGB stars since HBB in the envelope destroys
  via proton capture (Smith et al. 2005; Karakas & Lattanzio 2007). F enhancement has been confirmed spectroscopically only in AGB stars (Abia et al. 2010; Lucatello et al. 2011), but chemical evolution studies seem to indicate that all the sources above are required in order to explain the abundance evolution of this element in the galaxy (Renda et al. 2004; Kobayashi et al. 2011a). Our simulations have no contributions from neutrino spallation during SNe or rotationally induced mixing and identify AGB stars with
  as the most productive source of F. Contributions from WR stars or from CCSNe are, however, considered. In particular, in Set 1.2 only for the 60
  model is the wind contribution positive, and only for the 15
  star is the explosive contribution positive (Figure 17). In the massive star models at Set 1.1 metallicity, all of the wind contributions are negative and it is only the 15
  explosion that leads a small positive net massive star production factor.
Our models (Figure 18) confirm that Ne is produced as  in massive stars.
  is already efficiently produced during the pre-explosive evolution of massive stars in the C-burning layers. During the CCSN,
  in the deeper layers of the ejecta is processed and destroyed by the SN shock wave, whereas more external parts of C-burning Ne-rich layers are ejected almost unchanged. Note that some production of Ne is obtained at the bottom of the explosive He shell, depending on the SN shock temperatures. A similar effect can be observed for the α-elements Mg, Si, S, Ar, and Ca. Due to similarly high explosion temperatures, hypernova models, or the high-energy component of asymmetric CCSN explosion models show such a production for
  (e.g., Nomoto et al. 2009). Those specific signatures identify a stellar region at the bottom of the He-shell called the C/Si zone, which provides a suitable location for carbide grains condensation in the ejecta. Furthermore, the existence of the C/Si zone may be consistent with observations of CasA and SN1987A objects (Pignatari et al. 2013).

Figure 18. Same as Figure 17 for Ne and Mg and their stable isotopes.
Download figure:
Standard image High-resolution image
 shows a small overproduction compared to its initial abundance in massive AGB stars. The isotope is made by neutron capture on
  and via the reaction
  (α, p)
 in the He intershell (for the impact of this last reaction channel and its uncertainty, see Karakas et al. 2008), but it is depleted by HBB (e.g., Doherty et al. 2014). On the other hand,
  is efficiently produced in massive stars (Figure 18). Finally,
  is mostly produced in low-mass AGB stars; some of it may be primary depending upon the third dredge-up, where of
  can be returned as
  to the next TP He-shell flash convection zone.
  has an additional contribution from CCSN and from the stellar winds of more massive WR stars (the 60
  star in our stellar set).
 is efficiently made during hydrostatic carbon burning in massive stars, like
  . Its pre-SN abundance is partially destroyed by CCSN (Figure 17). Similar to
  ,
,  is directly made by C-fusion reaction. On the other hand, it receives a relevant additional contribution by proton capture and neutron capture on
  . Due to the secondary nature of this isotope, the final massive star yields of Na decrease with decreasing initial metallicity, causing the known odd–even effect with the neighbor elements Ne and Mg (e.g., Woosley & Weaver 1995; Limongi et al. 2000). Na may be ejected during the WR phase of more massive stars (e.g., the 32 and 60
  models) via proton capture on
  . The same nucleosynthesis path is responsible for most of the Na produced in low-mass AGB and massive AGB stars (e.g., Cristallo et al. 2006; Lucatello et al. 2011). According to these simulations, AGB stars are efficient producers of Na compared to massive stars at the same metallicity, with the strong contribution of the 3
  and 5
and 5  stars (Figure 17).
3.4. Mg, Al, and Si
Mg is mostly produced in massive stars; however, the individual Mg isotopes show a more complex behavior (Figure 18). The isotope  is only produced in massive stars; in the 15 and 20
  , Z = 0.02 models
  is produced during the pre-explosive phase, with a partial depletion due to nucleosynthesis during CCSN. On the other hand, for larger masses explosive nucleosynthesis provides an additional contribution to
  . The dependence on the initial mass is due to the large amount of material falling back on the SN remnant in the 25 and 32
  models, where most of the pre-explosive
  will not be ejected and the explosive He-shell component dominates the final abundance.
  and
and  are produced also by the AGB stars, more specifically in the He-shell flash convection zones of more massive AGB stars due to α-capture by
  (e.g., Karakas & Lattanzio 2007).
Al is efficiently produced in massive stars—mainly in C-burning zones—with no contribution from AGB stars (Figure 17).  shares nuclear production conditions with
  and
and  in the 15 and 20
  stars, and has the same dependence as
  on the amount of material falling back after the SN explosion.
Si is efficiently produced in massive stars (Figure 20). The origin from explosive nucleosynthesis is always larger than the pre-explosive contribution. The 15  case shows an increase of the Si yield with decreasing explosion energy. In order to account for all of the Si inventory observed in the solar system, a contribution from SN Ia (not considered here) is needed (e.g., Seitenzahl et al. 2013). The neutron-rich isotopes
  are mostly made by neutron captures on
  during both pre-SN and explosive C burning (Rauscher et al. 2002).
3.5. From P to Sc
Most P is made in massive stars (Figure 20). The amount of  made by the s process during the pre-explosive evolution is further increased during the SN explosion. The dominant contribution is given by explosive C burning and explosive He burning, while this isotope is destroyed by more extreme explosive conditions.
S is mainly composed of  , while
  is the least abundant stable sulfur isotope (0.01% in the solar system). S comes from massive stars, with the exception of
  , which can have a small contribution from AGB stars (Figure 20). Again, the contribution from SN Ia (e.g., Thielemann et al. 2004) are not considered in our models. S is made during explosive C burning and O-burning; while the pre-explosive production is marginal for
  (except for the Set 1.1 15
  rapid case), it may be relevant for
  produced via neutron captures on
  . The neutron-rich isotope
  is first made by the weak s process (e.g., Woosley et al. 2002; Mauersberger et al. 2004, and references therein), mainly via the production channel
  (n, γ)
 (n, p)
 , where the initial
  is the main seed (Mauersberger et al. 2004; Pignatari et al. 2010). In our models
  is mainly produced in explosive C and He burning, and in the latter case also via direct neutron capture on
  (Figure 20).
Cl is made in the explosion of massive stars with a small pre-SN contribution for  (Figure 20).
  may also come from neutrino interactions with stellar material that are not considered here. The yields correlate in a nonlinear way with the SN explosion energy. Comparing results for the 25
  model with those for lower initial masses shows that the yields strongly depend on fallback. The s process produces
  efficiently in massive stars (see also Rauscher et al. 2002; Woosley et al. 2002), but explosive nucleosynthesis further increases the
  yield.
Ar is made in explosive O-burning (Figure 19). Some pre-explosive production of  is obtained for the 15
  model in the convective O-burning shell; larger masses do not show such a component because the O shell region is below the fallback coordinate. The isotope
  , with a much smaller solar system abundance, is efficiently produced by the s process in all models. An additional contribution originates in the explosive He-burning shell during the SN explosion due to the n process (Blake & Schramm 1976; Thielemann et al. 1979; Meyer et al. 2000).
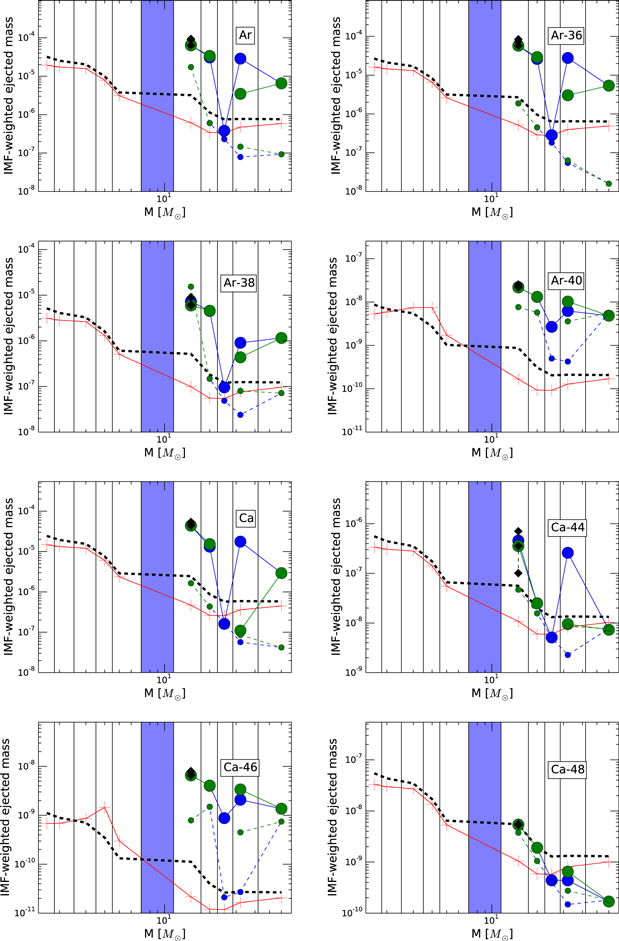
Figure 19. Same as Figure 17 for Ar and Ca and some of their stable isotopes.
Download figure:
Standard image High-resolution imageK has two stable isotopes,  , and a long-lived isotope,
  (τ1/2 = 1.28 × 10⁹ years), decaying in part to
  and in part to
  .
.  and
and  are efficiently produced in CCSN, along with a small s-process production of
  during the pre-explosive phase (Figure 20). A small production of
  in low-mass AGB stars may be relevant (electronic table; 3
  stellar model, Set 1.2).
  shows a strong production in AGB and massive stars. In agreement with the solar system distribution,
  stellar yields are about 2 orders of magnitude smaller than the total K yields. In massive stars,
  is made by the s process before the explosion and during the SN event by explosive He burning.
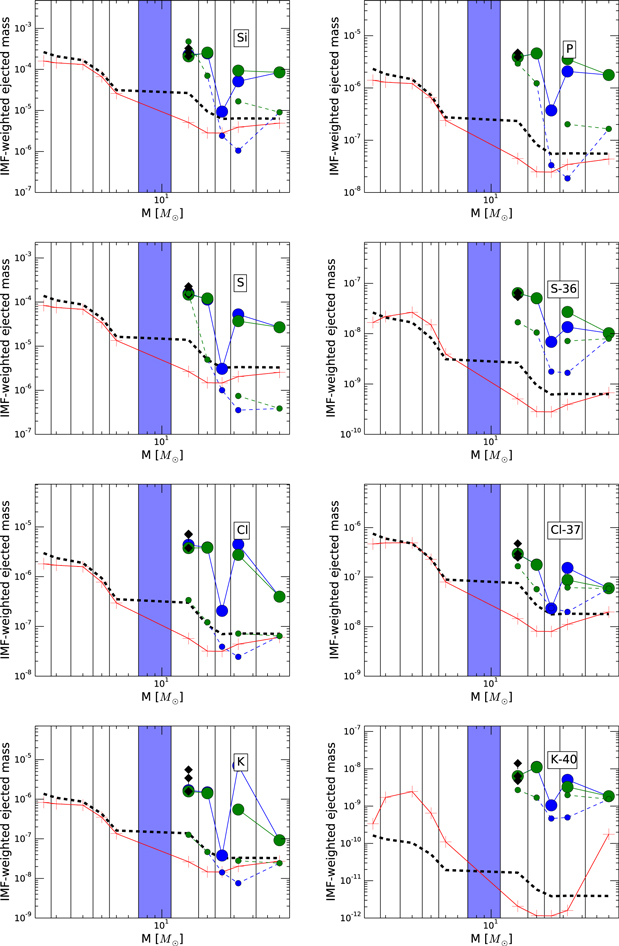
Figure 20. Same as Figure 17 for Si, P, S, Cl, and K and some of their stable isotopes.
Download figure:
Standard image High-resolution imageMost  (and therefore most of the calcium) originates in explosive O-burning, with a minor contribution from models with an α-rich freezout component (Figure 19). In particular, the large difference between the 32
  models with rapid and delayed explosion is due to the different amount of fallback material.
  can be efficiently produced as
  in α-rich freezout conditions (e.g., Magkotsios et al. 2010); a small amount of
  may also be produced in more external explosive regions, mainly as
  in explosive O- and C burning or as
  a and its neutron-rich unstable isobars in explosive He-burning conditions.
  is the only Ca isotope with a clear contribution from AGB stars, in particular from massive AGB stars where high neutron densities during the convective TP phases allows the s-process path to open a branching at the unstable isotope
  . In a similar way
  can be produced by the s process in the convective C-burning shell in massive stars. The explosive contribution is mainly due to the n process in the explosive He burning.
  originates in the n process in massive stars with a small contribution from the 15 and 20
  stellar models (see the full tables), but weak compared to the similar
  production.
  may originate in special conditions in CCSN with a high neutron excess (Hartmann et al. 1985). Alternatively
  production is predicted in i process conditions with characteristic neutron densities of
  (F. Herwig et al. 2016, in preparation), or by the weak r process (Weissman et al. 2012; Wanajo et al. 2013).
Mono-isotopic Sc is among the least abundant of the light and intermediate elements in the solar system. Because of its low abundance, Sc can be efficiently produced from adjacent Ca at high neutron densities obtained in low-mass stars (e.g., by the i process, Cowan & Rose 1977; Herwig et al. 2011). Besides the pre-explosive production by the s process, in massive stars we find a strong Sc production mainly in the explosive He burning (Figure 21). In the 15  models with α-rich freezout, Sc production is even larger (as previously reported, e.g., by Umeda & Nomoto 2005). Sc production may be also increased if feedback from neutrinos in the deepest SN ejecta is considered (Woosley & Weaver 1995; Fröhlich et al. 2006a; Yoshida et al. 2008). Sc can receive some contribution from the s-process in massive AGB stars (Smith & Lambert 1987; Karakas et al. 2012). In our models we find milder overproduction factors for Sc compared to, e.g., Karakas et al. (2012; see Table 12). In particular, the 4
  models of Set 1.2 show the largest overproduction with 1.316, corresponding to the small production factor of 1.047 (see also Figure 21).

Figure 21. Same as Figure 17 for Sc, V, Ti, Cr, Mn, Ca, and some of their stable isotopes.
Download figure:
Standard image High-resolution image3.6. From Ti to Ni
The production of most of these elements requires explosive conditions, and therefore in the present set of models they are efficiently made in the CCSN simulations. In Figure 16 this is shown for a number of stellar models from Set 1.2, where the post-explosion yields are compared to the pre-explosive abundances.
Ti is produced in CCSNe and in SN Ia (e.g., Rauscher et al. 2002; Seitenzahl et al. 2013). Most production comes from the mass range 15–20  (Figure 21). For larger masses, part of the Ti-rich material falls back; however, looking specifically at the production of individual isotopes of Ti, the situation is more complex. For example,
  is underproduced compared to the other Ti isotopes in several SN models (e.g., Woosley & Weaver 1995; Thielemann et al. 1996). In our calculations, most of the
  is made during the pre-explosive evolution by the s process in the convective He-burning core, in the following convective C-burning shell (e.g., Woosley et al. 2002; The et al. 2007), and by neutron captures during explosive He and C burning, which partially compensates for the destruction of
  at high temperatures deeper in the star. The difference in the final
  yields for the two 32
  explosion cases is due to the larger amount of fallback material in the delay model. Since recent SN Ia models are not producing
  efficiently (e.g., Kusakabe et al. 2011; Travaglio et al. 2011), it is possible that most of the solar
  is made in massive stars. In principle, the final
  abundance in the SN ejecta would be a good indicator of the amount of fallback and explosion energy, taking into account the uncertainties of its s-process production.
V is produced in massive stars during the CCSN. The contribution to the V inventory from SN Ia is quite uncertain (Travaglio et al. 2011; Seitenzahl et al. 2013).  does not receive a radiogenic contribution and therefore its abundance is a direct indicator of its production, which is mostly during explosive O-burning conditions. The bulk of the
  is synthesized by the decay of
  and
and  during freezout, both of which are produced in deeper regions and at higher temperature than
  in the explosion. Since most of
  is made in extreme conditions, its total abundance in the ejecta is severely reduced with increasing fallback. Therefore, V is underproduced in the 25 and 32
  models (Figure 21).
Cr is efficiently produced in massive stars (e.g., Woosley et al. 2002) and in SN Ia (e.g., Thielemann et al. 2004; Seitenzahl et al. 2013). The most abundant stable Cr species ( ) are made mostly as
  . Therefore, Cr is mostly produced in the 15–20
  stellar models, whereas for larger initial masses fallback is limiting the ejection of Cr-rich material (Figure 21).
  (2.365% of solar Cr) originates in the s process or via neutron capture in the explosive He-burning shell, and is destroyed in explosive O- or Si-burning conditions.
Mn is produced during CCSNe as  and
and  .
.  is efficiently produced only in the 15–20
  stars, whereas it is underproduced in higher mass models (Figure 21) because the yield strongly decreases with increasing fallback efficiency. Mn production also shows a significant dependence on the explosion energy in the 15
  models.
The dominant Fe isotope  is produced in CCSN and in SN Ia as
  (Figure 22) Because of fallback, only the 15
  star efficiently produces
  , mostly as
  . Like
  ,
,  also has a strong dependence on the explosion energy. The Fe neutron-rich isotope
  is produced over the whole stellar range (Figure 22). In massive stars, it is mainly produced by the s process during the pre-explosive phase and is partially destroyed by the SN explosion. In our models, a significant amount of
  is also produced in the explosive He-burning shell by neutron captures. This contribution is particularly important for the lower mass CCSNe, such as the 15
  case, where most of the pre-explosive abundances are strongly affected by the SN explosion. For the Z = 0.02 models, the AGB stars provide the largest contribution to the
  inventory, via the s process (Section 3.7).

Figure 22. Same as Figure 17 for Fe and Ni and some of their stable isotopes.
Download figure:
Standard image High-resolution imageBesides a small positive contribution to Co from the AGB star s process, the strongest production happens in massive stars (Figure 21). The 15  SN models show a correlation of the Co yields with the explosion energy. In the most energetic SN models, most of
  is made as
  , with a smaller contribution from
  ,
,  itself, and
  from the explosive He-burning shell. At lower explosion energies, the
  and
and  production is reduced. In this case,
  comes from direct production and from
  decay. This makes Co a possible nucleosynthesis signature of highly energetic SNe (see, e.g., Nomoto et al. 2009). For larger masses, where the fallback contribution in our models is stronger, the explosive contribution of the radiogenic
  in the He shell becomes more relevant for the final Co yields. For weaker fallback (e.g., the 25
  SN rapid model or the 60
  models), most Co originates comes from the s process.
The most abundant Ni species,  , are produced efficiently in CCSNe at high temperatures (for a recent analysis of the Ni production in CCSNe compared to Fe, we refer to Jerkstrand et al. 2015), with a strong contribution also from SNe Ia (e.g., Thielemann et al. 2004; Bravo et al. 2010; Seitenzahl et al. 2013). The production in massive stars depends on fallback and explosion energy. For example, the 25
  SN models do not efficiently contribute to the bulk of the Ni inventory because of the strong fallback (Figure 22). The other stable Ni isotopes,
  , can have a contribution from AGB stars. The
  yield from the s process in massive AGB stars is smaller than the massive star yield (see, e.g., Tables 9 and 11). On the other hand, the weighted yields over the Salpeter IMF in Figure 22 become comparable for the two different stellar mass regimes, since intermediate-mass stars are more numerous than massive stars.
For models with less fallback and with less energetic explosions, more than 50% of the  abundance is produced by the pre-explosive s-process contribution. The explosive contribution via neutron capture in the explosive He shell becomes more relevant for models with large fallback and/or high SN energy, where
  is produced directly from neutron captures on other Ni isotopes or via the decay of neutron-rich isobars from the lighter iron group elements (e.g., unstable
  and
and  ).
).
3.7. Trans-iron Elements
Trans-iron elements are made during the quiescent stellar evolution by the s process (Meyer 1994; Busso et al. 1999; Käppeler et al. 2011). Our models contain contributions from the s process in AGB and in massive stars. In addition, in massive stars there is a relevant contribution from explosive nucleosynthesis during the CCSN explosion (Section 2.3). In these conditions, we also follow the activation of the p process (or γ process; Arnould & Goriely 2003), the α process (Woosley & Hoffman 1992), and the n process in the explosive He shell (e.g., Blake & Schramm 1976). In the following sections, we will consider these different processes more in detail, depending on the mass region where their contribution is more relevant. Our models do not include ν-wind nucleosynthesis components (e.g., Hoffman et al. 1996; Fröhlich et al. 2006b; Kratz et al. 2008; Qian & Wasserburg 2008; Farouqi et al. 2010; Magkotsios et al. 2010; Arcones & Montes 2011) or the rapid neutron capture process (r process, e.g., Thielemann et al. 2011).
3.7.1. From Ni to Sr-Y-Zr
The abundances between Ni (Z = 27) and Zr (Z = 40) can be produced by different processes in different types of stars. In this region, the fundamental phenomenological concept of p-only, s-only, and r-only isotopes is too uncertain to be used to disentangle the origin of the solar system abundances, and each case should be considered carefully. On the other hand, for a large number of stars, spectroscopic observations are available for Cu, Zn, Sr, Y, and Zr at different metallicities. A smaller sample of stellar data are available for Ge (e.g., Cowan et al. 2005), As and Se (e.g., Roederer et al. 2014b), and Rb (Abia et al. 2001; García-Hernández et al. 2009; Zamora et al. 2014), which will help to better quantify the relative nucleosynthesis contribution of different processes. In this section, we discuss our results and we introduce the relevant nucleosynthesis processes for this mass region: the s process in massive stars and massive AGB stars, and the α process. The p process is contributing to  ,
,  , and
, and  , but most of the p-only isotopes are located above Zr. Therefore, the p process will be discussed in more detail in the following section. We do not consider in this work the neutrino-driven wind ejecta, which may potentially contribute to the nucleosynthesis up to Zr (e.g., Arcones & Montes 2011).
During the CCSN event, the stellar layers that will be ejected are first exposed to extreme thermodynamics conditions up to the nuclear statistical equilibrium (NSE). If the decrease in temperature and density after reaching their peak is fast enough, a large number of α particles are left in the ejecta, eventually leading to the α-rich freeze out nucleosynthesis, or α process (Woosley & Hoffman 1992): depending on the thermodynamic conditions and on the initial electron fraction, species heavier than iron can be produced efficiently up to Ag (Z = 47). Magkotsios et al. (2010) renamed the α process as the αn process to distinguish it from the αp process. The present CCSN models are characterized by fast shocks (see also Figure 23). Together with the slightly neutron-rich initial conditions (electron fraction Ye < 0.5) in the massive star progenitor models, the α process is activated in the 15  CCSN models of Set 1 in deep stellar layers of few 10−2
 . In Figure 24, we show the abundance distribution obtained at mass coordinate 1.849
  for the 15
  model, delay explosion, from Set 1.2. At this location, before the SN explosion the initial electron fraction is Ye = 0.496. During the CCSN, the temperature and density peaks are about 9.3 GK and 3.8 × 10⁶ g
  , and the final
  mass fraction will be 0.44 (i.e., 44% of the material is made of He). The heavy isotope that is most efficiently produced is
  , with a local overproduction of 8.7 × 10⁵, but the production flow is efficient up to the Zr-Mo region. The α-process is activated only in the simulations for the 15
  models from Set 1, affecting their final yields. On the other hand, stars with larger initial masses in the present set of models have a more efficient fallback and do not make any α process products. Their final abundances in the mass region between Fe and Zr are dominated by the s-process. In the same way, the 15
  stars from Set 1.2 with shock velocities reduced by a factor of two and four, respectively, are not hosting the α-process. The strong sensitivity of the α-process to the explosive conditions and to the progenitor mass makes this exotic process more difficult to analyze. On the other hand, its high production efficiency means it has the potential to have an impact on the chemical inventory of the Galaxy, even if associated only with CCSN ejecta with high-shock velocities or hypernovae. At the moment, the only observational confirmation of the α process activation is given by the observation of the [Zn/Fe] in metal-poor stars (Primas et al. 2000; Bisterzo et al. 2005, and references therein), where Zn is expected to be produced as
  and
and  (e.g., Nomoto et al. 2013). While an explosive component for Cu (e.g., Bisterzo et al. 2005; Sobeck et al. 2008, and references therein), Ge (Cowan et al. 2005), and As and Se (Roederer et al. 2014b) is observed already in old metal-poor stars before the s process contribution becoming relevant, it is not clear at the moment what is the effective relevance of the α-process for these elements.

Figure 23. Evolution of temperature and density profiles during CCSN for massive stars from Set 1.2 and the SN delay model. For comparison, see the same diagram in Thielemann et al. (2011).
Download figure:
Standard image High-resolution image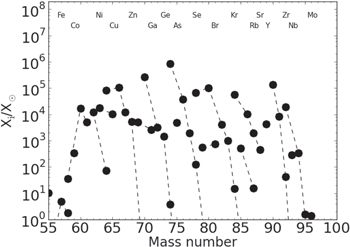
Figure 24. Overabundances at mass coordinate 1.849  in the 15
  delay model from Set 1.2, due to the α process activation.
Download figure:
Standard image High-resolution imageBetween iron and strontium (60 ≲ A ≲ 90), the s-process abundances in the solar system are mostly produced in massive stars (the weak s-process component; see, for example, Käppeler et al. 1989; Beer et al. 1992; Käppeler et al. 2011, and references therein). In massive stars, the main neutron source for the s process is the  (α, n)
 reaction (Peters 1968; Couch et al. 1974; Lamb et al. 1977). Depending on the initial mass of the star (e.g., Prantzos et al. 1990) and on the
  +α rates (e.g., Käppeler et al. 1994), some
  is left in the He-burning ashes, which is activated later in the subsequent C-burning conditions (e.g., Raiteri et al. 1991b). The elements produced most efficiently are copper, gallium, and germanium (Pignatari et al. 2010, and references therein).
The pre-SN production of the s-process elements in our models has been discussed in the context of an analysis of the  +
+ nuclear reaction rate uncertainty by Bennett et al. (2012) and Pignatari et al. (2013). The SN shock wave partially depletes or changes the original pre-explosive s-process abundances (e.g., Rauscher et al. 2002; Tur et al. 2009). In this case, the resulting explosive stellar yields of s-process elements would still share a similar production efficiency and metallicity dependence with their s-process seeds. The relevance of the feedback of the explosion on the pre-explosive s-process signature depends on many details of the SN mechanism. In a 25
  star, the bulk of the pre-explosive s-process abundances lies in the convective C-burning shell and in the ashes of the He core material located between the C shell and the He shell (e.g., The et al. 2007; Pignatari et al. 2010, and references therein). For standard CCSN models, with a SN explosion energy of the order of 1051 erg and a "mass cut" located below the bottom of the convective C shell, most of the s-process-rich material in a 25
  star would be ejected unchanged by the explosion (e.g., Woosley & Weaver 1995; Limongi et al. 2000; Rauscher et al. 2002). In the 25
  stellar models discussed here, most or all of the s-process-rich material falls back forming a BH (the star in this case ends as a failed SN; see, e.g., Woosley et al. 2002, and references therein) according to Fryer et al. (2012). In particular, the central 5.71
  and 6.05
  is not ejected for the delay explosive calculations of Set 1.1 and Set 1.2, respectively. For the rapid explosive models, at Z = 0.02 no material is ejected (complete fallback), and for Z = 0.01 only the material external to the mass coordinate 7.91
  (see Table 8) is ejected. Furthermore, the remaining s-process-rich material will be significantly modified by the sudden increase of temperature and density related to the SN shock wave. The pre-explosive C shell material could be modified by shell merging in the last ∼a day before the core collapse starts. This does not happen in our simulations, but it has been obtained, for instance, in the 20 and 25
  stars by Rauscher et al. (2002) and Tur et al. (2009). Finally, nuclear uncertainties (e.g., Busso & Gallino 1985; Rauscher et al. 2002; The et al. 2007; Pignatari et al. 2010; Massimi et al. 2012; Heil et al. 2014; Lederer et al. 2014) and physics mechanisms not included in our models like rotation (e.g., Frischknecht et al. 2012) have a relevant impact on s-process results.
In Figure 25, we show the abundance profile before and after the SN shock wave for the two s-only species  and
and  ; we compare the 25
  and 60
  models with Z = 0.02 and delay. In the 25
  model, only about 0.3
  of the s-process-rich material from the convective C shell is ejected, including small modifications from the explosion. The s-process abundances are strongly modified in the He core window and at the bottom of the He shell by neutron captures, where stellar conditions and fuel are suitable to trigger explosive He burning and the efficient neutron production by the
  (α, n)
 is possible. In the 60
  model, the amount of fallback material is smaller than in the previous case (3
  ; see Table 8). However, the pre-explosive
  and
and  made by the s process in the regions between about 3 and 6
  and between 10.5
  and the surface of the star are modified by photo-disintegration during explosive O and C burning and by neutron captures due to explosive He burning, respectively. The external part of the C shell material (between 6
  and 10.5
  ) is only modified slightly.

Figure 25. Pre-explosive (thin lines) and post-explosive (thick lines) abundances of the s-only species  and
and  for the 25
  and 60
  models from Set 1.2 in the delay model (left and right panels, respectively). The isotopes
  ,
,  ,
,  ,
,  , and
, and  are reported to identify the different burning zones. The abundances include the contribution from radiogenic decay.
Download figure:
Standard image High-resolution imageIn Figure 26, the final isotopic production factors are given for the same models discussed in Figure 25. The abundance distributions are given compared to the  production factor, which is mainly produced in massive stars in the same zones where the s-process yields are made. However,
  is a primary isotope and its yields therefore do not change with the initial metallicity of the star. Unlike primary isotopes, s-process yields in massive stars (or more generally any heavy nuclides produced starting from s-process seeds) show a direct dependence on the initial stellar metal content, which is closer to a secondary-like nucleosynthesis according to, e.g., Tinsley (1980). Secondary-like isotopes produced in massive stars are expected to show an overabundance with a factor of 2 higher than
  at solar metallicity to be mostly made by the weak s process. Concerning the 25
  star, fallback reduces the s-process and
  yields in a similar way. Therefore, the tendency to have abundances lying above the
  × 2 line in the Cu-As region (see Figure 26) is conserved, in agreement with models using different fallback treatment (e.g., Rauscher et al. 2002).
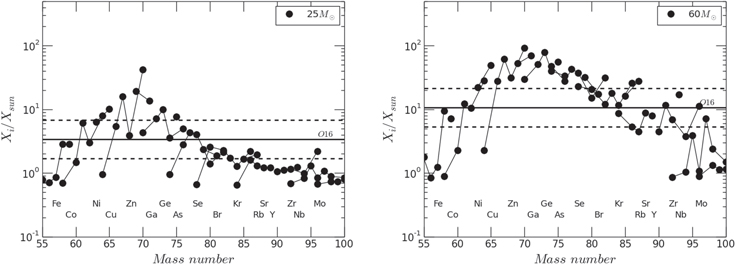
Figure 26. Final overproduction factors for isotopes between Fe and Mo for the 25  and 60
  models from Set 1.2 in the delay model (left and right panels, respectively). The production factor of
  is reported (continuous line), multiplied and divided by a factor of two (dashed lines).
Download figure:
Standard image High-resolution imageThe footprint of the s process in producing different elements of the weak s-process component with different efficiencies is maintained in the final yields, besides the uncertainties related to the nucleosynthesis triggered by the SN explosion. For this reason, the abundances start decreasing in the Se region and become marginal above the Sr-Y-Zr peak, in agreement with the pre-explosive s-process distribution. Concerning the 60  star, the larger yields between Fe and Nb compared to the 25
  star are due to a stronger activation of the
  (α, n)
 in the convective He-burning core. Indeed, the central He-burning temperature tends to increase with the initial mass of the star, leading to a more efficient s process in these conditions (Prantzos et al. 1990). Above the Sr neutron magic peak, where the pre-explosive contribution from the C shell and the He core window material is less significant, the explosive nucleosynthesis signature in different parts of the star (including from the explosive He-burning shell) becomes easier to identify in the total ejecta. For instance, the isotopic signature of Mo in both masses (but more in the 60
  star) shows a clear
  enrichment compared to other Mo isotopes, in agreement with the signature measured in SiC-X presolar grains (Meyer et al. 2000) due to the n-process activation (e.g., Blake & Schramm 1976; Thielemann et al. 1979).
In general, the present sets of CCSN models may be used to qualitatively study the impact of fallback and CCSN explosions with high shock velocities on the weak s-process distribution.
Massive AGB stars (their progenitors are intermediate-mass stars massive enough to experience the second dredge-up, represented in our sample by the 4 and 5  star models) also contribute to the s-process abundances in the mass region between Fe and Zr (e.g., Travaglio et al. 2004). In these stars,
  is the dominant neutron source in the He-shell flash convection zone during the TP. In Figure 27 the production factors for a 3
  AGB star, a 5
  massive AGB star, and a 25
  massive star from Set 1.1 are compared. In the weak s-process mass region between Fe and Zr, massive stars have a larger production for Cu, Ga, and Ge while for heavier elements the production in the 5
  stars is more efficient. Therefore, the s process isotopic distribution from massive AGB stars is quite different compared to the weak s-process. Recently, the capability of stellar models to reproduce the high [Rb/Zr] ratios observed in galactic and LMC massive AGB stars was questioned (García-Hernández et al. 2006, 2009; van Raai et al. 2012). However, Zamora et al. (2014) showed that this discrepancy between stellar predictions and observations is at least partially reconciled thanks to the overestimation of the Rb spectroscopic abundance.
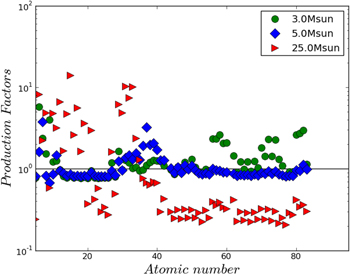
Figure 27. Production factors for the 3  , 5
, 5  , and 25
  models from Set 1.1. The delay model is shown for the 25
  star.
star.
Download figure:
Standard image High-resolution image3.7.2. From Sr-Y-Zr to Pb
Beyond the neutron shell closure at N = 50, the efficiency of several explosive nucleosynthesis components from SN are rapidly decreasing. This is the case for the α-process, discussed in the previous section, and for different neutrino-wind components like the weak r process and the νp process, which in the most extreme conditions can be efficient up to the Cd-Sn mass region (e.g., Farouqi et al. 2010; Arcones & Montes 2011; Wanajo et al. 2011). Therefore, beyond Zr, the number of nucleosynthesis processes that efficiently contribute to the chemical inventory of the Galaxy is smaller compared to lighter heavy elements.
The total s-process distribution in the solar system is divided into three different components. In the previous section we have introduced the weak s-process component, between iron and strontium (60 ≲ A ≲ 90). For A ≳ 90, AGB stars with initial mass 1.5 ≳ M/ ≳ 3 contribute to most of the s-process abundances (e.g., Arlandini et al. 1999; Bisterzo et al. 2011, 2014). In particular, in the solar system it is possible to disentangle between the main s-process component and the strong s-process component, which forms approximately 50% of the solar
  and was produced by low-metallicity AGB stars
  (e.g., Gallino et al. 1998). According to recent GCE simulations by Bisterzo et al. (2014), beyond Zr the s process from AGB stars reproduces more than 50% of the solar Nb, Sn, Ba, La, Ce, Nd, W, Hg, Tl, and Pb. The element with the smallest s-process contribution is Ir (1.6% of its solar abundance).
In AGB stars, the neutrons are mainly produced in radiative conditions in the so-called  -pocket (Figure 8) via the
  (α, n)
 reaction (Straniero et al. 1995; Gallino et al. 1998). Properties of the
  -pocket can be obtained, for example, from comparison with isotopic information from presolar grains (Lugaro et al. 2003b). Rotation-induced mixing may have the impact of prohibiting or lowering the s-process production in AGB stars (Herwig et al. 2003; Siess et al. 2004; Piersanti et al. 2013). Herwig et al. (2003) concluded that a convection-induced instability, such as Kelvin-Helmholz instabilities or internal gravity wave mixing (Denissenkov & Tout 2003), will lead to CBM that generates the
  -pocket. As in past work (Herwig 2000), we model this mixing with an exponentially decaying diffusion coefficient (see Section 2.1.4 for details such as the adopted CBM efficiency).
The s-process nucleosynthesis operates in the  -pocket at
  and ρ ∼ 103 g
  , leading to a low neutron density of about 106–7
 . These conditions best satisfy the s-process distribution observed in the solar system (Arlandini et al. 1999; Bisterzo et al. 2011), the study of the s-process isotopic signature in presolar grains (e.g., Lugaro et al. 2003a), and the spectroscopic observations of stars at different metallicities (Lambert et al. 1995; Busso et al. 2001; Abia et al. 2002; Masseron et al. 2010; Bisterzo et al. 2011; Lugaro et al. 2012; Maiorca et al. 2012; Fishlock et al. 2014; Straniero et al. 2014) and planetary nebulae (Karakas et al. 2007, 2009); Pignatari et al. 2008. A smaller contribution to the total neutron exposure comes from the partial activation of the
  (α, n)
 reaction in He-shell flash convection zone at
  and
and  g
g  with a higher neutron density (
 ) for up to a few years. This exposure causes local isotopic shifts in the s-process distribution as are evident in presolar grains (e.g., Pignatari et al. 2006; Lugaro et al. 2003a; Käppeler et al. 2011; Ávila et al. 2012; Liu et al. 2014b).
An established methodology to analyze the s-process in AGB stars and to compare theoretical predictions with observations is to use the production efficiency at different neutron magic peaks. In particular, the production of the elements at the Sr neutron magic peak is called ls, and hs represents the production of the elements at the Ba peak. The ratio [hs/ls] is an s-process index (Luck & Bond 1991).
In Figure 28, we report for the models of Set 1.2 the [ls/Fe] surface evolution, where ls is the average of Sr, Y, and Zr as a function of the [hs/ls] ratio. In this case, the term hs includes the elements Ba, La, Nd, and Sm. The [hs/ls] ratio provides an indication of the average neutron exposure in the  -pocket. The 1.65
  model (not reported in the figure) shows only a negligible s-process enrichment in the envelope. The 2 and 3
  stars show an [ls/Fe] lower than 0.4 dex. This enrichment is lower than the maximum observed in AGB stars by about 1.0 dex. This is shown in Figure 28, where the data from observations of C-rich stars as reported by Abia et al. (2002) and Zamora et al. (2009) are also shown for comparison.
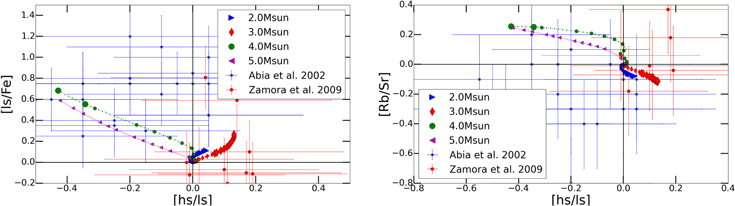
Figure 28. Left panel: evolution of [ls/Fe] at the surface of AGB models from Set 1.2 with respect to the s-process index [hs/ls] (Luck & Bond 1991). The 1.65  model is not included since the envelope material is only marginally enriched in s-process material. The ls term includes the average of Sr, Y, and Zr production. The hs term includes the average production of the elements Ba, La, Nd, and Sm, according to Busso et al. (2001). Observational data from the spectroscopy of Carbon stars around solar metallicity from Abia et al. (2002) and Zamora et al. (2009) are presented as a comparison. Right panel: the evolution of the [Rb/Sr] with respect to [hs/ls] for the same models as in the left panel.
Download figure:
Standard image High-resolution imageIn general, the size of a typical  -pocket in the present models is 2–3 × 10⁻⁵
 , similar to the value obtained by Lugaro et al. (2003b). According to the simple estimate made by Herwig et al. (2003), the
  -pocket should be about three to four times larger in order to reproduce the largest [ls/Fe] ∼ 1 observed at solar-like metallicity in MS-S stars (Busso et al. 2001).
In Figure 28, the [hs/ls] of low-mass AGB models tends to become positive. We do not reproduce the large spread of observations of AGB stars at metallicity close to solar, in which a significant fraction of C-rich stars have a negative [hs/ls]. This has already been noted and discussed by Lugaro et al. (2003b) and Herwig et al. (2003) for models in which CBM is applied at the bottom of the convective TP, and is even more severe for models at Z = 0.01. Indeed, these models are characterized by a higher  abundance in the He intershell, which in turn causes a larger neutron exposure in the
  -pocket. Therefore, independently from the total s-process enrichment in the AGB envelope, the larger
  concentration in the He intershell causes the production ratio between the different neutron magic peaks to increase, favoring the hs elements.
In Figure 28 the [Rb/Sr] ratio is shown with respect to the [hs/ls] ratio for the same models. The [Rb/Sr] ratio is affected by the branching point at  , providing a measure of the relative importance of the
  (α, n)
 reaction at high neutron density compared to the
  (α, n)
 reaction at low neutron density. Indeed, during the convective TP the nucleosynthesis flow
  (n, γ)
 (n, γ)
 (n, γ)
 (β−)
(β−) allows for the production of
  . Because of the lower neutron capture cross section,
  is accumulated more efficiently than
  , increasing the s-process production of Rb (e.g., Abia et al. 2001). Our AGB models in general show a mildly negative [Rb/Sr] (Figure 28) within the range of observations (Lambert et al. 1995; Abia et al. 2001; Zamora et al. 2009). In Figure 28 the abundances from the 4 and 5
  massive AGB star are shown. In Section 2.2 we mentioned that the present models do not experience hot dredge-up, and form very small
  pockets. Nevertheless, the s-process yields beyond iron are dominated by the
  (α, n)
 contribution, with a stronger production of the Sr-Y-Zr peak compared to the Ba peak. As expected, the [Rb/Sr] is positive due to the high neutron densities during the convective TPs (e.g., Karakas et al. 2012). Because of the activation of the HBB, the 5
  does not become C-rich in these simulations. Therefore, the 5
  results cannot be compared with the observations reported in the figure. The spectroscopic observations of heavy s-process elements in massive O-rich AGB stars are still controversial. Zamora et al. (2014) reported a new estimation of Rb abundances for four of these stars in the galactic disk using new dynamical atmosphere models, reducing up to 1.6 dex previous measurements by García-Hernández et al. (2006) and confirming the lack of Zr enhancements. In Figure 28, the 5
  models of Set 1.2 show a [Rb/Sr] up to 0.2–0.3 dex, which in first approximation is representative of the [Rb/Zr] ratio. These results is consistent with Zamora et al. (2014) if we take into account their large observational errors.
Another signature of AGB models including CBM at the bottom of the He-shell flash convection zone is the more efficient production of  and
and  compared to models not including CBM, due to a higher temperature at the bottom of the convective TP and consequently a more efficient activation of α-captures on
  (Lugaro et al. 2003b). In our models the isotopic ratios
  /
/ and
and  /
/ increase with the initial mass of the star (Figure 29). For instance, for the 3
  model they are 0.23 and 0.40, respectively, compared to the solar ratios 0.13 and 0.14. The 1.65
  case shows final isotopic ratios of 0.13 and 0.16, also due to the weak pollution of the envelope by the third dredge-up (the 1.65
  star of Set 1.2 does not become C-rich (Figure 5). Note that AGB stars at solar-like metallicity do not show any significant increase of the Mg isotopic ratios within observational uncertainties of about a factor of two (Smith & Lambert 1986). In the future, the Mg isotopic ratios might provide a fundamental observational contrain for the CBM to adopt below the convective TP (see Section 2.1.4), once the
  +α rates will be constrained by nuclear experiments with high precision (Wiescher et al. 2012).

Figure 29. Left panel: evolution of Mg isotopic ratio at the surface of AGB models from Set 1.2. Right panel: for the same models as in the left panel, the evolution of the isotopic ratios  /
/ and
and  /
/ .
.
Download figure:
Standard image High-resolution imageIn Figure 29, we show the  /
/ isotopic ratio with respect to the
  /
/ ratio. According to Zr measurements in presolar mainstream SiC grains,
  is not efficiently produced in low-mass AGB stars (Lugaro et al. 2003a; Zinner 2003; Lugaro et al. 2014), with an observed ratio between solar and 30 times lower than solar. We obtain a Zr ratio lower than solar for the 2
  star (Figure 29), but far enoughto explain the low Zr isotopic ratio observed in most of mainsteam SiC grains (Barzyk et al. 2007; Liu et al. 2014a; Lugaro et al. 2014). On the other hand, the 3
  star shows a final
  /
/ higher than solar. The same trend was observed by Lugaro et al. (2003b) for models with CBM due to an excessively large
  (α, n)
 efficiency during the TP (similar to the Mg isotopic ratios). However, a lower
  /
/ ratio is obtained by using the new Zr neutron capture cross section rates (Lugaro et al. 2014). Furthermore, for the present models, both the high [hs/ls] and the weak contribution from the
  -pocket to the total neutron exposure affects the production of
  , causing a larger final
  /
/ in the AGB envelope. In our models the
  /
/ ratio is lower than solar for low-mass AGB models (Figure 29). The higher isotopic ratio observed by Lugaro et al. (2003b) for models including CBM is not obtained in the present calculations, and a plausible explanation is the weaker contribution from the neutron density freeze out, which is caused by the lower
  (α, n)
 rate adopted in this work (Jaeger et al. 2001).
For the 5  massive AGB star [hs/ls] is negative, because of the dominant contribution from the
  (α, n)
 neutron source at the Sr neutron magic peak. For the same reason, the intermediate-mass model has a positive [Rb/Sr] (Abia et al. 2001). The high neutron density is also responsible for a large
  /
/ ratio, whereas the
  /
/ ratio, after an initial increase, tends to decrease to the solar ratio. Similar considerations may be derived from the 4
  model, not shown in the figure.
Generally, the present AGB stellar models confirm the main features of AGB models with the CBM prescription described by Lugaro et al. (2003b) and Herwig et al. (2003). They are able to reproduce the large C and O abundances observed in H-deficient stars. It is known that a range of efficient  -pockets is needed to reproduce the different s-process observations in AGB stars (e.g., Busso et al. 2001; Lugaro et al. 2003b). One physics mechanism that can explain this scatter might be rotation (Herwig et al. 2003; Piersanti et al. 2013), which is not considered in the present stellar models.
We have seen that neutron capture processes are dominating the nucleosynthesis of heavy elements, at least beyond the neutron shell closure at N = 50. On the other hand, in the solar system distribution there are 35 proton-rich stable nuclides.15
A well established scenario to make most them is the p process (or γ process; e.g., Woosley & Howard 1978) during the CCSN explosion of massive stars in the O/Ne-rich layers. With the relevant exception of  and
and  (14.84, 9.25% and 5.52, 1.88% of the Mo and Ru solar abundance, respectively), the abundances of p-process nuclei are 2–3 orders of magnitude lower than other stable nuclides. Such isotopes were defined as p-only, assuming that they do not receive a significant contribution from other processes such as the s process or the r process.
  and
and  receive a dominant s-process contribution from low-mass AGB stars and are therefore not associated with the p process (Bisterzo et al. 2011). According to the models presented here,
  and
and  are not of p-process origin either (Dillmann et al. 2008, and references therein). Therefore, they cannot be indicated as p-only nuclides. Furthermore,
  and
and  could not be produced only by the p process. Indeed,
  might receive a significant contribution from neutrino capture on
  (Goriely & Siess 2001) and the long-lived
  isomer (half-life larger than 1.2 × 10¹⁵ years; Cumming & Alburger 1985) may be efficiently produced by the s process in low-mass AGB stars (for different and controversial predictions, see Arlandini et al. 1999; Goriely & Mowlavi 2000; Bisterzo et al. 2011) and in massive stars (e.g., Rauscher et al. 2002).
There are three p-only isotopes lighter than Zr ( ,
,  ,
,  ). Beside the p process, they may also be produced also by the α process (see the previous section and Figure 24) and in neutrino-wind ejecta (e.g., Fröhlich et al. 2006b; Farouqi et al. 2010; Wanajo et al. 2011). A similar scenario is possible for the first proton-rich species above Zr,
  , and
, and  . In particular, these isotopes are systematically underproduced by more than an order of magnitude compared to the other p-process species in CCSN calculations (Arnould & Goriely 2003), taking into account present nuclear uncertainties (Rapp et al. 2006; Rauscher 2006, and references therein). Recently, Pignatari et al. (2013) showed that assuming an enhanced (compared to Caughlan & Fowler 1988)
  +
+ fusion reaction rate may lead to a Mo and Ru p-nuclide production up to the level of other p-nuclei (cp-component).
Besides problems in reproducing single isotopes, the average p-process massive star yields are underproduced by about a factor of three compared to the amount required to explain the solar system distribution (e.g., Rayet et al. 1995), or the secondary nature of the classical p process (see Pignatari et al. 2013). An alternative astrophysical source proposed to reproduce, at least in part, the abundances of p-process nuclides in the solar system are SN Ia (Howard et al. 1991; Howard & Meyer 1993; Kusakabe et al. 2011; Travaglio et al. 2011, 2014).
Our models represent the p-process contribution from CCSNe with high shock velocities and including fallback. Similar results are expected for p-process yields from hypernova or from the high-energy component of asymmetric CCSNe. Among all the CCSN models presented in this work, we now focus our discussion on the p-process distribution of a 15  star and a 25
  star, Z = 0.02 (SN model delay, Set 1.2). In Figure 30, upper panel, the 15
  star does not show a relevant p-process contribution to Ru, in agreement with standard CCSN calculations (e.g., Rauscher et al. 2002). On the other hand, up to
  , the ejected abundances are dominated by the α-process (see the next section, and, e.g., the full Table 11). In this specific model, there is no relevant production of
  either. The p-process contribution becomes positive again from
  to
to  (with a production factor of ∼1.5–4), with the exception of
  and
and  , which are not efficiently produced. Among those species, the most produced are
  and
and  , with a production factor of about 4. The high SN explosion energy causes a larger contribution to the lightest p-process species, in disagreement with the classical flat p-process distribution. However, the oxygen production factor of this model is reduced to about 2.1, since the high energy of the explosion depletes O in a large region of the ejecta. Therefore, the p-process production factor in CCSN characterized by high shock velocities and/or high explosion energies is similar or larger than O, one of the fundamental requirements in order to reproduce the solar system p-process abundances.
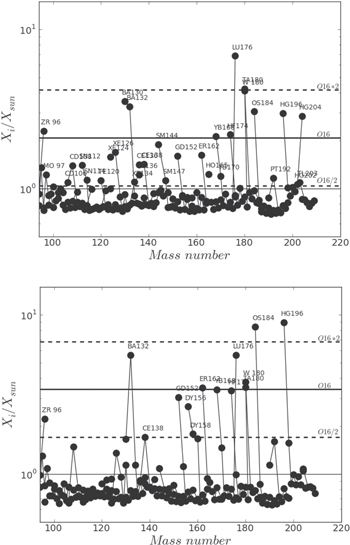
Figure 30. Final isotopic overproduction factors for the 15 and 25  stars from Set 1.2 in the mass region A > 95 (upper panel and lower panel, respectively). The production factor of
  , divided and multiplied by a factor of two, are also reported (continuous and dashed lines). We label the isotopes with production factors larger than
  divided by 2. Among those, different p-process isotopes can be identified.
Download figure:
Standard image High-resolution imageIn Figure 30, lower panel, the 25  star shows a dominant p-process signature starting from Ba. Indeed, besides
  (with a mild production of ∼1.5) and
  (∼1.4), p-nuclides lighter than Ba are not ejected. Above Ba, the production factors range between ∼1.1 (
 ) and 9 (
 ). The reason for this behavior is that the hotter material carrying the lighter p-nuclides falls back onto the forming BH and only the colder p-process component is ejected. The oxygen production factor is about 3.4. Compared to standard CCSN models (e.g., Rauscher et al. 2002), the oxygen yields are also smaller. This is due to the large amount of mass falling back (for this model the central 5.7
  are not ejected).
In summary, for the 15  model considered the production of the proton-rich heavy isotopes up to the Mo region is dominated by the α process, while beyond Mo the standard p-process contribution is becoming the most relevant process. The 20
  model with the same metallicity and the same explosion energy shows a more standard p-process distribution (see Figure 30). On the other hand, a strong fallback (see the 25
  star case discussed here) potentially favors heavier p-process ejecta.
3.8. Comparison with Other Sets of Stellar Yields
A number of different sets of stellar yields are available in the literature. In Tables 21–26 we show a comparison between the yields presented in this work for different stars in Set 1.2 and the yields presented from several works in the literature: for massive stars, Thielemann et al. (1996), Rauscher et al. (2002), Chieffi & Limongi (2004), and for intermediate-mass stars, Karakas (2010a) and Cristallo et al. (2011).
Table 21.
Comparison between the Present Work, Cristallo et al. (2011; Cr11) and Karakas (2010a; Ka10) for the 2  Stellar Yields, Set 1.2
| Isotope | Pi13 | Cr11 | Ka10 |
|---|---|---|---|
| C 12 | 1.912E–02 | 9.33420E–03 | 2.7675023E–03 |
| C 13 | 1.365E–04 | 1.31110E–04 | 1.2363438E–04 |
| N 14 | 3.715E–03 | 3.26650E–03 | 3.0212691E–03 |
| N 15 | 2.738E–06 | 2.80090E–06 | 3.0777028E–06 |
| O 16 | 1.998E–02 | 1.18310E–02 | 1.3041234E–02 |
| O 17 | 4.684E–05 | 4.03320E–05 | 2.4374334E–05 |
| O 18 | 3.327E–05 | 1.91220E–05 | 2.2738323E–05 |
| F 19 | 2.247E–06 | 1.71410E–06 | 5.5231231E–07 |
| NE 20 | 2.537E–03 | 2.09900E–03 | 2.2048058E–03 |
| NE 21 | 6.548E–06 | 5.34460E–06 | 5.6205986E–06 |
| NE 22 | 1.295E–03 | 9.87250E–04 | 1.6960394E–04 |
| NA 23 | 8.241E–05 | 9.54390E–05 | 5.3539075E–05 |
| MG 24 | 8.227E–04 | 1.05810E–03 | 7.0122938E–04 |
| MG 25 | 1.299E–04 | 1.38140E–04 | 9.2150629E–05 |
| MG 26 | 1.757E–04 | 1.61950E–04 | 1.0570988E–04 |
| AL 27 | 9.165E–05 | 1.19650E–04 | 7.9080222E–05 |
| SI 28 | 1.037E–03 | 1.36490E–03 | 8.8968419E–04 |
| SI 29 | 5.507E–05 | 7.18800E–05 | 4.6674944E–05 |
| SI 30 | 3.893E–05 | 4.95380E–05 | 3.2046293E–05 |
| P 31 | 1.009E–05 | 1.30750E–05 | 1.1111028E–05 |
| S 33 | 4.751E–06 | 5.94620E–06 | 4.3899581E–06 |
| S 34 | 2.658E–05 | 3.41060E–05 | 2.5454728E–04 |
| FE 54 | 1.111E–04 | 1.44260E–04 | 9.7166812E–05 |
| FE 56 | 1.827E–03 | 2.35860E–03 | 1.5932062E–03 |
| FE 57 | 4.826E–05 | 5.77150E–05 | 3.8909951E–05 |
| FE 58 | 1.272E–05 | 9.85910E–06 | 5.0385906E–06 |
| CO 59 | 7.013E–06 | 7.55400E–06 | 4.5764918E–06 |
| NI 58 | 7.814E–05 | 9.91850E–05 | 6.7378882E–05 |
| NI 60 | 3.244E–05 | 4.00250E–05 | 2.6685300E–05 |
| NI 61 | 1.873E–06 | 1.94490E–06 | 4.7256694E–06 |
| NI 62 | 5.175E–06 | 6.01960E–06 | 1.7063927E–07 |
| NI 64 | 1.375E–06 | 1.81810E–06 | ⋯ |
| SR 88 | 8.739E–08 | 7.07640E–07 | ⋯ |
| Y 89 | 2.149E–08 | 1.38720E–07 | ⋯ |
| ZR 90 | 2.568E–08 | 1.47450E–07 | ⋯ |
| BA138 | 2.507E–08 | 7.93670E–08 | ⋯ |
| LA139 | 3.219E–09 | 9.42830E–09 | ⋯ |
| PB208 | 1.245E–08 | 2.52760E–08 | ⋯ |
Download table as: ASCIITypeset image
Table 22.
Comparison between the Present Work, Cristallo et al. (2011; Cr11) and Karakas (2010a; Ka10) for the 3  Stellar Yields, Set 1.2
| Isotope | Pi13 | Cr11 | Ka10 |
|---|---|---|---|
| C 12 | 4.448E–02 | 1.86110E–02 | 2.0739544E–02 |
| C 13 | 2.252E–04 | 2.20200E–04 | 1.9436399E–04 |
| N 14 | 7.685E–03 | 6.64840E–03 | 5.6565693E–03 |
| N 15 | 4.207E–06 | 4.29400E–06 | 5.0818235E–06 |
| O 16 | 3.828E–02 | 1.94360E–02 | 2.1144016E–02 |
| O 17 | 5.194E–05 | 7.91850E–05 | 5.5763638E–05 |
| O 18 | 3.364E–05 | 3.12110E–05 | 3.6596495E–05 |
| F 19 | 7.655E–06 | 3.68770E–06 | 4.3487280E–06 |
| NE 20 | 4.356E–03 | 3.63520E–03 | 3.7571993E–03 |
| NE 21 | 1.270E–05 | 9.90460E–06 | 1.0039988E–05 |
| NE 22 | 3.937E–03 | 2.32210E–03 | 2.1113991E–03 |
| NA 23 | 1.772E–04 | 1.87730E–04 | 1.2845088E–04 |
| MG 24 | 1.421E–03 | 1.84710E–03 | 1.1949923E–03 |
| MG 25 | 2.915E–04 | 2.43210E–04 | 1.6784266E–04 |
| MG 26 | 4.726E–04 | 2.88120E–04 | 1.9374024E–04 |
| AL 27 | 1.585E–04 | 2.08100E–04 | 1.3861095E–04 |
| SI 28 | 1.770E–03 | 2.36270E–03 | 1.5164100E–03 |
| SI 29 | 9.501E–05 | 1.24570E–04 | 7.9920115E–05 |
| SI 30 | 6.975E–05 | 8.60130E–05 | 5.5390818E–05 |
| P 31 | 1.771E–05 | 2.28230E–05 | 1.9017965E–05 |
| S 33 | 8.331E–06 | 1.04160E–05 | 7.6937777E–06 |
| S 34 | 4.601E–05 | 5.91400E–05 | 4.3391171E–04 |
| FE 54 | 1.874E–04 | 2.49280E–04 | 1.6390771E–04 |
| FE 56 | 3.100E–03 | 4.08090E–03 | 2.7071363E–03 |
| FE 57 | 8.781E–05 | 1.02140E–04 | 7.2351380E–05 |
| FE 58 | 3.211E–05 | 1.76610E–05 | 1.1919641E–05 |
| CO 59 | 1.441E–05 | 1.33220E–05 | 8.5931824E–06 |
| NI 58 | 1.317E–04 | 1.71330E–04 | 1.1363259E–04 |
| NI 60 | 5.698E–05 | 6.93570E–05 | 4.5602490E–05 |
| NI 61 | 4.122E–06 | 3.46150E–06 | 8.8770785E–06 |
| NI 62 | 1.056E–05 | 1.04870E–05 | 5.0042019E–08 |
| NI 64 | 3.165E–06 | 3.32430E–06 | ⋯ |
| SR 88 | 1.978E–07 | 1.63060E–06 | ⋯ |
| Y 89 | 5.072E–08 | 3.17410E–07 | ⋯ |
| ZR 90 | 5.726E–08 | 3.24600E–07 | ⋯ |
| BA136 | 9.317E–09 | 2.79920E–08 | ⋯ |
| BA138 | 7.581E–08 | 1.68590E–07 | ⋯ |
| LA139 | 9.138E–09 | 2.00170E–08 | ⋯ |
| PB208 | 2.243E–08 | 4.82470E–08 | ⋯ |
Download table as: ASCIITypeset image
Table 23.
Comparison between the Present Work and Karakas (2010a; Ka10) for the 5  Stellar Yields, Set 1.2
| Isotope | Pi13 | Ka10 |
|---|---|---|
| C 12 | 2.478E–02 | 1.5313132E–02 |
| C 13 | 5.341E–04 | 2.5495309E–03 |
| N 14 | 1.702E–02 | 1.6426099E–02 |
| N 15 | 5.737E–06 | 3.5156333E–07 |
| O 16 | 4.031E–02 | 3.5938345E–02 |
| O 17 | 6.271E–05 | 5.4988403E–05 |
| O 18 | 5.326E–05 | 8.8449030E–07 |
| F 19 | 2.085E–06 | 3.6023453E–06 |
| NE 20 | 7.695E–03 | 6.6723512E–03 |
| NE 21 | 3.187E–05 | 2.2214339E–05 |
| NE 22 | 9.583E–04 | 1.4162241E–03 |
| NA 23 | 2.921E–04 | 2.2751275E–04 |
| MG 24 | 2.415E–03 | 2.1024081E–03 |
| MG 25 | 5.101E–04 | 3.3637485E–04 |
| MG 26 | 9.401E–04 | 4.3323121E–04 |
| AL 27 | 2.887E–04 | 2.5326770E–04 |
| SI 28 | 3.085E–03 | 2.6992788E–03 |
| SI 29 | 1.650E–04 | 1.4311528E–04 |
| SI 30 | 1.196E–04 | 1.0082583E–04 |
| P 31 | 3.162E–05 | 3.4187142E–05 |
| S 33 | 1.366E–05 | 1.3463593E–05 |
| S 34 | 7.941E–05 | 7.7136338E–04 |
| FE 54 | 3.319E–04 | 2.9173499E–04 |
| FE 56 | 5.418E–03 | 4.8021809E–03 |
| FE 57 | 1.323E–04 | 1.2381890E–04 |
| FE 58 | 3.155E–05 | 2.9148772E–05 |
| CO 59 | 2.109E–05 | 1.7460188E–05 |
| NI 58 | 2.334E–04 | 2.0222510E–04 |
| NI 60 | 9.600E–05 | 8.1889491E–05 |
| NI 61 | 5.639E–06 | 1.9852198E–05 |
| NI 62 | 1.722E–05 | 1.3339656E–08 |
Download table as: ASCIITypeset image
Table 24. For Stable Species the Abundance Enrichment in Supernova Ejecta in Solar Mass Unit for the Stars at Solar Metallicity
| Specie | 15  Delay Delay |
15  Rapid Rapid |
Th96 | Ra02 | CL04 |
|---|---|---|---|---|---|
| C 12 | 1.761E–01 | 1.785E–01 | 8.33E–02 | 1.555E–01 | 1.39E–01 |
| C 13 | 9.805E–04 | 9.813E–04 | 4.98E–10 | 1.264E–03 | 5.10E–10 |
| N 14 | 4.967E–02 | 4.973E–02 | 5.37E–03 | 4.662E–02 | 2.95E–07 |
| N 15 | 5.308E–05 | 5.457E–05 | 1.58E–10 | 1.775E–04 | 9.77E–10 |
| O 16 | 2.986E–01 | 3.011E–01 | 4.23E–01 | 8.495E–01 | 3.46E–01 |
| O 17 | 7.713E–05 | 7.736E–05 | 5.08E–09 | 9.941E–05 | 2.14E–08 |
| O 18 | 4.882E–03 | 5.004E–03 | 1.35E–02 | 3.304E–03 | 8.80E–09 |
| F 19 | 1.518E–05 | 1.483E–05 | 2.67E–11 | 2.989E–05 | 7.00E–11 |
| NE 20 | 3.151E–02 | 3.141E–02 | 2.83E–02 | 1.267E–01 | 1.15E–01 |
| NA 23 | 1.299E–03 | 1.301E–03 | 2.09E–04 | 2.625E–03 | 5.79E–04 |
| MG 24 | 1.548E–02 | 1.505E–02 | 4.20E–02 | 3.999E–02 | 4.98E–02 |
| AL 27 | 1.259E–03 | 1.264E–03 | 5.56E–03 | 4.682E–03 | 8.66E–04 |
| SI 28 | 9.677E–02 | 8.910E–02 | 6.52E–02 | 9.684E–02 | 5.30E–02 |
| S 32 | 6.575E–02 | 6.385E–02 | 2.16E–02 | 4.165E–02 | 2.15E–02 |
| AR 36 | 2.651E–02 | 2.651E–02 | 3.49E–03 | 7.403E–03 | 4.12E–03 |
| CA 40 | 1.971E–02 | 1.967E–02 | 3.03E–03 | 6.284E–03 | 3.83E–03 |
| TI 48 | 5.717E–04 | 4.802E–04 | 1.27E–04 | 1.276E–04 | 1.70E–04 |
| V 51 | 1.024E–04 | 9.875E–05 | 1.01E–05 | 3.146E–05 | 5.32E–06 |
| CR 52 | 3.766E–03 | 3.564E–03 | 8.24E–04 | 1.597E–03 | 9.22E–04 |
| MN 55 | 2.124E–03 | 2.159E–03 | 3.39E–04 | 1.271E–03 | 3.02E–04 |
| FE 56 | 1.915E–01 | 1.681E–01 | 1.30E–01 | 1.261E–01 | 1.00E–01 |
| CO 59 | 1.023E–02 | 1.148E–02 | 1.36E–04 | 4.542E–04 | 2.14E–04 |
| NI 58 | 1.823E–01 | 1.131E–01 | 6.64E–03 | 7.326E–03 | 3.03E–03 |
| ZN 70 | 2.820E–06 | 2.846E–06 | 3.19E–21 | 2.637E–06 | 1.44E–20 |
| GE 70 | 8.356E–04 | 3.634E–03 | 5.13E–15 | 3.209E–06 | 6.17E–06 |
| SE 76 | 3.013E–05 | 1.847E–04 | ⋯ | 8.126E–07 | 7.31E–10 |
| KR 80 | 1.555E–05 | 5.410E–05 | ⋯ | 1.291E–07 | 5.06E–09 |
| KR 82 | 4.350E–06 | 3.938E–05 | ⋯ | 4.846E–07 | 1.09E–11 |
| SR 86 | 3.747E–06 | 1.756E–05 | ⋯ | 1.286E–07 | 3.12E–11 |
| SR 87 | 6.093E–07 | 3.172E–06 | ⋯ | 6.853E–08 | 1.23E–10 |
| SR 88 | 2.648E–06 | 4.056E–05 | ⋯ | 1.070E–06 | 1.59E–11 |
Note. Here we compare results from our 15  models, Set 1.2, with Thielemann et al. (1996; Th96), Rauscher et al. (2002; Ra02), and Chieffi & Limongi (2004; CL04).
Download table as: ASCIITypeset image
Table 25. For Stable Species the Abundance Enrichment in Supernova Ejecta in Solar Mass Unit for the Stars at Solar Metallicity
| Specie | 20  Delay Delay |
20  Rapid Rapid |
Th96 | Ra02 | CL04 |
|---|---|---|---|---|---|
| C 12 | 2.780E–01 | 2.825E–01 | 1.14E–01 | 2.233E–01 | 3.35E–01 |
| C 13 | 1.310E–03 | 1.310E–03 | 4.86E–07 | 1.412E–03 | 2.31E–08 |
| N 14 | 6.818E–02 | 6.822E–02 | 2.71E–03 | 6.440E–02 | 2.05E–06 |
| N 15 | 4.096E–05 | 4.028E–05 | 5.06E–08 | 5.191E–05 | 3.24E–09 |
| O 16 | 1.266E+00 | 1.211E+00 | 1.48E+00 | 2.205E+00 | 1.00E+00 |
| O 17 | 7.099E–05 | 7.114E–05 | 1.84E–08 | 9.820E–05 | 1.70E–07 |
| O 18 | 5.587E–04 | 5.624E–04 | 8.68E–03 | 3.122E–03 | 2.52E–08 |
| F 19 | 7.938E–06 | 7.938E–06 | 1.15E–09 | 1.081E–05 | 2.47E–10 |
| NE 20 | 1.034E–01 | 8.129E–02 | 2.28E–01 | 6.971E–02 | 2.22E–01 |
| NA 23 | 2.383E–03 | 2.216E–03 | 1.16E–03 | 2.193E–03 | 1.32E–03 |
| MG 24 | 1.333E–01 | 1.234E–01 | 1.46E–01 | 7.260E–02 | 1.02E–01 |
| AL 27 | 4.062E–03 | 3.767E–03 | 1.59E–02 | 1.205E–02 | 1.50E–03 |
| SI 28 | 3.871E–01 | 4.039E–01 | 8.33E–02 | 4.416E–01 | 1.38E–01 |
| S 32 | 1.736E–01 | 1.852E–01 | 2.40E–02 | 1.922E–01 | 6.13E–02 |
| AR 36 | 4.567E–02 | 5.060E–02 | 4.14E–03 | 4.493E–02 | 1.18E–02 |
| CA 40 | 2.283E–02 | 2.628E–02 | 3.72E–03 | 2.391E–02 | 1.07E–02 |
| TI 48 | 1.442E–04 | 2.142E–04 | 1.99E–04 | 2.390E–04 | 1.85E–04 |
| V 51 | 5.992E–05 | 7.778E–05 | 1.22E–05 | 5.739E–05 | 6.70E–06 |
| CR 52 | 1.334E–03 | 2.196E–03 | 9.20E–04 | 1.291E–03 | 2.32E–03 |
| MN 55 | 1.014E–03 | 1.453E–03 | 3.15E–04 | 9.887E–04 | 3.54E–04 |
| FE 56 | 2.679E–02 | 3.560E–02 | 6.78E–02 | 1.096E–01 | 1.00E–01 |
| CO 59 | 3.217E–04 | 3.007E–04 | 1.46E–04 | 7.622E–04 | 8.04E–05 |
| NI 58 | 1.386E–03 | 1.531E–03 | 9.35E–03 | 7.982E–03 | 1.31E–03 |
| ZN 70 | 2.360E–05 | 2.282E–05 | 1.58E–25 | 5.420E–07 | 9.50E–24 |
| GE 70 | 2.062E–05 | 1.949E–05 | 1.04E–12 | 1.553E–05 | 7.85E–17 |
| SE 76 | 3.571E–06 | 3.329E–06 | ⋯ | 4.269E–06 | 6.55E–16 |
| KR 80 | 9.266E–07 | 9.160E–07 | ⋯ | 4.501E–07 | 2.08E–15 |
| KR 82 | 8.627E–07 | 7.899E–07 | ⋯ | 3.352E–06 | 6.20E–16 |
| SR 86 | 2.194E–07 | 2.155E–07 | ⋯ | 1.227E–06 | 1.40E–14 |
| SR 87 | 8.387E–08 | 7.887E–08 | ⋯ | 8.588E–07 | 1.27E–14 |
| SR 88 | 2.370E–06 | 2.277E–06 | ⋯ | 4.688E–06 | 1.61E–13 |
Note. Here we compare results from our 20  models, Set 1.2, with Thielemann et al. (1996; Th96), Rauscher et al. (2002; Ra02), and Chieffi & Limongi (2004; CL04).
Download table as: ASCIITypeset image
Table 26. For Stable Species the Abundance Enrichment in Supernova Ejecta in Solar Mass Unit for the Stars at Solar Metallicity
| Specie | 25  Delay Delay |
Th96 | Ra02 | CL04 |
|---|---|---|---|---|
| C 12 | 4.518E–01 | 1.48E–01 | 4.093E–01 | 4.01E–01 |
| C 13 | 1.264E–02 | 1.03E–01 | 1.570E–03 | 8.30E–03 |
| N 14 | 9.152E–02 | 9.53E–04 | 8.101E–02 | 5.26E–02 |
| N 15 | 1.358E–04 | 1.04E–08 | 1.391E–04 | 4.32E–06 |
| O 16 | 8.163E–01 | 2.99E+00 | 3.316E+00 | 2.03E+00 |
| O 17 | 1.075E–04 | 7.86E–08 | 1.262E–04 | 1.58E–04 |
| O 18 | 1.964E–04 | 6.69E–03 | 1.205E–03 | 7.55E–05 |
| F 19 | 1.432E–05 | 8.17E–10 | 7.820E–05 | 4.14E–07 |
| NE 20 | 1.754E–01 | 5.94E–01 | 5.356E–01 | 6.73E–01 |
| NA 23 | 5.575E–03 | 1.81E–02 | 1.281E–02 | 4.00E–03 |
| MG 24 | 4.159E–02 | 1.59E–01 | 1.444E–01 | 1.36E–01 |
| AL 27 | 3.219E–03 | 1.95E–02 | 2.206E–02 | 2.20E–03 |
| SI 28 | 2.930E–02 | 1.03E–01 | 3.540E–01 | 1.15E–01 |
| S 32 | 1.266E–02 | 3.84E–02 | 1.475E–01 | 5.27E–02 |
| AR 36 | 1.844E–03 | 6.71E–03 | 2.315E–02 | 1.05E–02 |
| CA 40 | 1.303E–03 | 6.14E–03 | 1.716E–02 | 9.82E–03 |
| TI 48 | 5.499E–05 | 8.98E–05 | 2.050E–04 | 2.11E–04 |
| V 51 | 9.595E–06 | 9.96E–06 | 6.878E–05 | 9.42E–06 |
| CR 52 | 2.977E–04 | 1.31E–03 | 2.947E–03 | 1.89E–03 |
| MN 55 | 2.170E–04 | 5.02E–04 | 2.321E–03 | 5.11E–04 |
| FE 56 | 2.351E–02 | 5.24E–02 | 1.294E–01 | 1.00E–01 |
| CO 59 | 2.869E–04 | 2.19E–05 | 6.682E–04 | 8.58E–05 |
| NI 58 | 9.998E–04 | 1.33E–03 | 4.840E–03 | 6.56E–04 |
| ZN 70 | 1.665E–05 | 2.44E–18 | 1.996E–05 | 8.71E–20 |
| GE 70 | 5.622E–06 | 5.15E–16 | 2.856E–05 | 8.86E–15 |
| SE 76 | 9.150E–07 | ⋯ | 8.389E–06 | 8.66E–14 |
| KR 80 | 1.666E–07 | ⋯ | 9.503E–07 | 2.62E–13 |
| KR 82 | 7.514E–07 | ⋯ | 5.228E–06 | 7.01E–14 |
| SR 86 | 2.364E–07 | ⋯ | 1.917E–06 | 1.52E–12 |
| SR 87 | 1.444E–07 | ⋯ | 1.281E–06 | 1.42E–12 |
| SR 88 | 1.537E–06 | ⋯ | 1.145E–05 | 2.55E–11 |
Note. Here we compare results from our 25  models, Set 1.2, with Thielemann et al. (1996; Th96), Rauscher et al. (2002; Ra02), and Chieffi & Limongi (2004; CL04).
Download table as: ASCIITypeset image
The  isotope is the most abundant product of massive stars. Considering both the CCSN ejecta and the winds (see the yields), the models 15, 20, and 25
  and Z = 0.02, delay explosion and produce 0.30, 1.27, and 0.82
  of
of  . For instance, for the same masses and metallicity Thielemann et al. (1996) provides 0.42, 1.48, and 2.99
  , Rauscher et al. (2002) 0.85, 2.20, and 3.32
  (models S15, S20 and S25), and Chieffi & Limongi (2004) 0.52, 1.38, and 2.44
  . For the 15
  star, the results change by almost a factor of three, and by a factor of 1.7 for the 20
  star. The large fallback included in our simulations causes lower
  yield for the 25
  star, which is, e.g., about a factor of four smaller than Rauscher et al. (2002). Differences can be even larger if we compare the yields of
  and
and  , which critically depend on the explosion parameters applied in the simulations (Magkotsios et al. 2010, and references therein). For these two species, we obtain for the same models considered before 1.97 × 10⁻⁴ and 0.18
  , 1.54 × 10⁻⁵ and 0.0087
  , 1.05 × 10⁻⁷
 and no
  ejected, respectively. In particular, the extended fallback in the 25
  model does not allow us to eject any relevant amount of
  or
or  . For the same models and isotopes, Thielemann et al. (1996) provides 7.19 × 10⁻⁵ and 0.13
  , 1.53 × 10⁻⁴ and 0.068
  , and 2.11 × 10⁻⁵ and 0.052
  respectively. Rauscher et al. (2002) predicts 1.39 × 10⁻⁵ and 0.11
  , 4.87 × 10⁻⁵ and 0.09
  , and 1.56 × 10⁻⁵ and 0.11
  . Finally, from Chieffi & Limongi (2004), assuming the same amount of
  ejected equal to 0.1
  for all masses, we obtain for
  4.20 × 10⁻⁵, 4.03 × 10⁻⁵, and 2.19 × 10⁻⁵
  , respectively.
Concerning the impact of neutron capture processes in massive stars, the final yield of the neutron magic  is a good indicator of their total efficiency if alternative processes like the α process are not activated. In particular, the 20 and 25
  models with Z = 0.02, delay explosion and produce 2.38 × 10⁻⁶ and 1.54 × 10⁻⁶
  of
of  . For comparison, Rauscher et al. (2002) predict 4.69 × 10⁻⁶ and 1.14 × 10⁻⁵
  , respectively, and Chieffi & Limongi (2004) 1.98 × 10⁻⁶ and 3.98 × 10⁻⁶
  . Besides the impact of different physics and explosion choices made in these different models, the differences are also due to the different nuclear reaction rates used in the simulations, e.g., for the
  (α, n)
 and
and  (α, γ)
 reactions.
Concerning AGB stars, the final ejected masses of  ,
,  , and
, and  for the 2
  AGB model of Set 1.2 are 0.0187, 0.0035, and 0.0189
  , respectively. For the same isotopes and the same star, Karakas (2010a) provides 0.0028, 0.0030, and 0.0130, and Cristallo et al. (2011) 0.0093, 0.0033, and 0.0118
  . For
. For  , we obtain an abundance that is factor of 2.1 and 6.9 higher than Cristallo et al. (2011) and Karakas (2010a). A higher
  enrichment in our models is due to the CBM activated at the bottom of convective TPs, while differences between Cristallo et al. (2011) and Karakas (2010a) might be due to intrinsic differences between the two set of models like dredge-up efficiency and mass-loss rates. The
  yields are consistent within 20%. Concerning
  , our models show a larger production, up to 60%. This higher production corresponds to a positive contribution to the O inventory of the Galaxy from AGB stars (see Figure 17 and the data tables). GCE simulations are needed to confirm this scenario. Concerning the s-process nucleosynthesis, for the same model of Set 1 the final ejected masses of
  ,
,  and
and  are 8.62 × 10⁻⁸, 2.54 × 10⁻⁸, and 1.23 × 10⁻⁸
  . Cristallo et al. (2011) predicts a much larger production, with 7.07 × 10⁻⁷, 7.93 × 10⁻⁸, and 2.52 × 10⁻⁸
  . This is due to the smaller
  pockets obtained in our models compared to Cristallo et al. (2011).
4. SUMMARY AND FINAL REMARKS
In this work we present a set of stellar models and their chemical yields (Set 1). We define 1.65, 2, 3, 4, 5, 15, 20, 25  models; we also calculated 32 and 60
  models at Z = 0.02. Massive star models are calculated using the stellar evolution code GENEC and lower mass models are calculated using MESA. For low- and intermediate-mass stars, wind yields are provided in the form of production factors and absolute yields in solar mass units. For massive stars, the yields are given for the stellar wind, pre-explosive, and post-explosive contributions. Two sets of explosion models are considered, each with a different fallback prescription. The NuGrid post-processing code mppnp is used to perform all nucleosynthesis calculations for AGB stars and for massive stars including their SN explosions.
Core collapse SN models are performed in a 1D semi-analytic way. The shock velocity profiles and fallback prescriptions used are motivated by multi-dimensional hydrodynamic simulations. Due to their simplified nature they are foremost meant to indicate species that will be affected by explosive nucleosynthesis in any significant way. The explosive yields therefore provide important insights on the main features of explosive nucleosynthesis. Furthermore, the Set 1 SN models represent an example of explosive nucleosynthesis at high shock velocity (high-temperature or high-energy), and with a fallback signature.
For the first time we present a grid of full yields for s-process and p-process species for SN models with strong shocks. In particular, models with a large fallback have reduced s-process yields, which are modified significantly in models with higher explosion energies. For most cases, the s-process distribution is affected by local abundance redistribution. In particular, in the He shell the n process from explosive He burning may have a relevant impact. The weight of the n-process component on the final yields increases with increasing fallback. The 15  models show the activation of the α process in the deeper ejecta up to
  . Therefore, for these stars the final yields between Fe and Mo are carrying this nucleosynthesis signature. We showed that by reducing the initial shock velocity by only a factor of 2 the α process is suppressed; indeed, the α process does not appear in our models with even lower initial shock velocities. Progenitors with larger masses and/or in general models with larger fallback mass will not eject this component, even assuming the same initial shock velocities. Finally, the impact of nuclear uncertainties on the α-process yields still need to be explored.
For the p-process, the main effect of a higher energy SN explosion is to move the p-process-rich region outwards, without dramatic modification of the p-process efficiency. On the other hand, the O production tends to decrease with increasing explosion temperatures (and fallback), which is used as a reference for p-process efficiency. Furthermore, different models show local differences in the p-process distribution, but in no case do we obtain a significant p-process production of the p-rich isotopes of Mo and Ru. In general, the present yields could potentially relieve the p-process underproduction relative to O.
Low- and intermediate-mass stars are evolved to the tip of the AGB, with the exception of the 4 and 5  AGB models for which 1D modeling assumptions are violated before all mass is lost (e.g., Lau et al. 2012). The remaining envelope mass is assumed to be ejected without any further processing. All AGB models include CBM (overshooting) prescriptions. In agreement with previous work, this causes a larger amount of carbon and oxygen in the He intershell compared to AGB models without overshooting. The s-process carries the known signature of overshooting applied at the bottom of the envelope, with large neutron exposures in the 13C-pocket. On average, the low-mass AGB models of Set 1 have 13C-pockets producing an s-process enrichment in the envelope about three to four times weaker than the highest abundances observed in AGB stars with metallicity close to solar. Despite this, the most efficient producers of the first peak elements (Y, Sr, Rb, Zr) are the 3–5
  AGB star models. We are in the process of updating this area of our model parameterization for the next data release.
The present work comprises for the first time stellar yields from low-mass stars, intermediate-mass stars, and massive stars calculated using the same nuclear reaction network. We estimate the contribution from different stars to the nuclides, but note that a more quantitative study would require the use of a GCE model. For instance, we show that although massive stars are generally the dominant source of α-elements beyond carbon, AGB stars do show a strong production of oxygen. In particular, the impact on these results on the GCE of oxygen needs to be explored in the future. Some preliminary discussion has been presented by Delgado-Inglada et al. (2015).
We finally would like to reiterate that our yields have at this point no contribution for the r process or from SN type Ia, which again is something we would like to improve upon in the future.
Stellar yields of Set 1 provide stellar abundance data covering both low-mass and massive star models. This data release, however, is based on simplifications, such as the use of rather basic semi-analytic explosion assumptions as well as a rather simplistic treatment of mixing related to convective boundaries, which in fact we assume to be present in low- and intermediate-mass stars at all times at some level, while no overshooting is assumed during post-He core burning in the massive star models. We also use two different stellar codes for high-mass and low-mass stars, which introduces a small amount of inconsistency, although efforts have been made to minimize these. Our predictions presently exclude super-AGB stars. Our goal is to remove such limitations in future data release. In addition, we will provide data sets for lower initial metal content, and such simulations are well underway.
We thank the anonymous referee for many useful comments and suggestions. We would also like to thank Sergio Cristallo and Amanda Karakas for the fruitful discussion and for sharing information about their stellar models. NuGrid acknowledges significant support from NSF grants PHY 02-16783 and PHY 09-22648 (Joint Institute for Nuclear Astrophysics, JINA), NSF grant PHY-1430152 (JINA Center for the Evolution of the Elements), and EU MIRG-CT-2006-046520. NuGrid computations are performed at the Arizona State University's Fulton High-performance Computing Center (USA) and the high-performance computer KHAOS at the EPSAM Institute at Keele University (UK). M.P. acknowledges an Ambizione grant of the SNSF, SNF (Switzerland), and support from the "Lendulet-2014" Programme of the Hungarian Academy of Sciences. M.P., S.J., and R.H. thank the Eurocore project Eurogenesis for support. F.H. acknowledges NSERC Discovery Grant funding. R.H. and S.J. acknowledge support from the World Premier International Research Center Initiative (WPI Initiative), MEXT, Japan. M.G.B.'s research was carried out under the auspices of the National Nuclear Security Administration of the U.S. Department of Energy at the Los Alamos National Laboratory under Contract No. DEAC52-06NA25396. A.D. acknowledges support from the Australian Research Council under grant FL110100012. The research leading to these results has received funding from the European Research Council under the European Union's Seventh Framework Programme (FP/2007-2013)/ERC grant agreement No. 306901. This work used the SE library (LA-CC-08-057) developed at the Los Alamos National Laboratory as part of the NuGrid collaboration; S.E. makes use of the HDF5 library, which was developed by The HDF Group and by the National Center for Supercomputing Applications at the University of Illinois at Urbana-Champaign. M.P. acknowledges the support to the Milne Astrophysics Center granted by PRACE, through its Distributed Extreme Computing Initiative, for resource allocations on Sisu (CSC, Finland), Archer (EPCC, UK), and Beskow (KTH, Sweden), and by the STFC DiRAC High Performance Computing Facilities. Ongoing resource allocations on the University of Hulls High Performance Computing Facility—viper—are gratefully acknowledged.
APPENDIX A: NuGRID CODES
The NuGrid nucleosynthesis codes provide a framework for performing both single-zone (sppn) and multizone parallel (mppnp) simulations for given thermodynamic conditions (Herwig et al. 2008; Pignatari & Herwig 2012). Both the sppn and mppnp drivers use the same solver (Appendix A.3) and physics (Appendix A.2) packages. The single-zone driver is used, for example, for simplified simulations of trajectories for reaction rate sensitivity studies. The yields presented in this paper have been obtained with the multizone driver mppnp.
The stellar structure evolution is calculated with a small network, just large enough to accurately account for the nuclear energy generation. For the MESA AGB simulations the network (MESA agb.net) contains 14 isotopes, while the GENEC network contains 8 to 15 isotopes. The stellar structure evolution data for all zones at all time steps are written to disk using the NuGrid se format, a data structure based on HDF5.16 All zones at all timesteps are then processed with the mppnp code using a dynamic network that includes all relevant reactions automatically.
In order for this post-processing approach to work, the stellar evolution code has to include a large enough network to reproduce the energy generation in the same way the post-processing network would, which implies that for important reactions like  and
and  the same nuclear physics has to be adopted in both cases. The quality of the stellar evolution and post-processing network consistency is checked by comparing abundance profiles for key species from both cases, and shows in general good agreement (Figure 31). The
  abundance agrees well both in the He-intershell and the H-burning ashes, indicating that both He burning and H-burning are treated consistently between the stellar evolution and post-processing approaches. The
  abundance agrees for the two cases in the H-burning ashes. This reflects the consistent treatment of CNO burning in the stellar evolution and the post-processing, where
  is the most important isotope due to its small p-capture cross section.
  does not contribute in significant ways to the energy generation in He burning, and therefore the difference between
  in MESA and mppnp in this isotope in the He-burning layers (in the mass region
  ) reflects the more complete nuclear network (including n-capture reactions) in the post-processing simulation. The latter is the more realistic solution in that case.
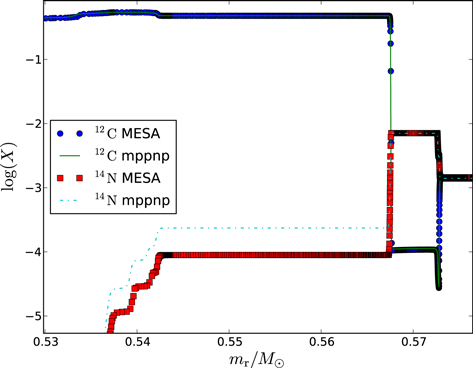
Figure 31. Comparison of MESA and mppnp abundance profiles for the 14th thermal pulse convection zone of the Set 1.1 2  AGB sequence. The mass range shown includes the top of the C/O core, the He-shell flash convection zone, the (now extinct) H-burning shell, and the bottom of the convective envelope. The H-free core mass is 0.572
  for that model.
Download figure:
Standard image High-resolution imageThe advantages of the post-processing approach over a complete inline network include larger flexibility and shorter computing time. In particular, the higher scale of flexibility is due to the ability to adopt different nuclear reaction rates with no relevance for the energy economy of the stellar structure, without having to calculate again new stellar structures. This means that a large number of different sets of stellar yields can be made for different sets of nuclear reaction rates, but using the same stellar models. One of the reasons for the superior numerical behavior of the MESA code during the advanced phases of stellar evolution is the simultaneous solution of the structure, network, and mixing operators. It would be numerically too time consuming to perform such a joint operator solve for a full s-process network with up to 1000 isotopes.
However, the implementation of a fully coupled solver in MESA is a source of inconsistency with the post-processing approach, since mppnp solves the mixing and nucleosynthesis in separate steps. There is little that can be done about this, except monitor the difference (Figure 31) and, in case they get unacceptably large, force sub-time stepping in mppnp. So far this was not necessary.
Further, the post-process approach allows easy and rapid post-processing of the same stellar evolution track with modified input nuclear physics, provided the reactions are not important for energy generation. Realistic sensitivity studies can be performed in this way for many application. Finally, it was straightforward to adopt a distributed parallelized computing model for the post-processing simulations (Appendix A.1).
A.1. Parallel-programming Implementation—mppnp
The implementation of parallelism in mppnp frame is a simple master-worker (or Workqueue) routine that assigns a single process (normally a single processor) to be the "master" with the rest as "workers," which is coded using the Message-Passing Interface (MPI). The main advantage gained by using MPI is the ability to use mppnp over distributed memory resources, such as cluster networks. The master performs all the serial computations, such as initialization, input/output, and simple tasks, and coordinates the assignment of work to the workers using a first-in first-out (FIFO) scheduler. The worker calculates the work and then returns the result to the master. For mppnp, the unit of work is the network calculation for a single spherical shell (or "zone") at a single timestep, which is assigned by passing a message containing the temperature, density and chemical composition in the shell to the worker. We choose this definition of "work" because network calculations for individual zones do not depend on each other and therefore no communication is required between workers. This allows for an embarrassingly parallel implementation, which simplifies the parallel implementation and significantly reduces the communication overhead. Load balancing in mppnp is simple in that zones are allocated spatially, in order, from the center of the star, through the interior toward the surface. The reason for this is that the dynamic network typically assigns larger networks to regions of higher temperature, so the zones with the most work are allocated first.
The general operation of mppnp can be described as follows. First, the initialization is performed by the master, which includes the loading into memory of reaction rates, input parameters, and initial stellar model data. The reaction rate data are then passed to all workers using broadcasts, which provide each processor with a private copy of the data required to calculate the nuclear reaction network. Following the broadcasts, the master invokes the scheduler for the first timestep. It assigns work to all available workers and then waits for a reply. Upon completion of a network calculation, the worker returns the modified abundances to the master, which it stores in an array. If there is more work to be assigned, the master assigns further work to the worker and waits for further messages. If no more work is to be assigned, the worker returns a message indicating that it is to be terminated. Once all workers respond with a termination message, all work has been completed for a single timestep and the master performs some additional serial tasks, such as a mixing step (in case a specific zone of the star has mixing coefficient larger than zero, according to the stellar structure input) and output. When the next timestep is calculated, the master invokes the scheduler again and the process is repeated.
The parallel performance of the scheduler can be estimated using a scaling curve, which is a plot of the speed-up factor as a function of the number of processors. The scaling of mppnp for a test run with 2500 timesteps of a 15  massive star model with approximately 250 zones per timestep is shown in Figure 32. Figure 32 also shows the curves for Amdahl's law and Gustafson's law with a serial fraction of 1%. Since the amount of work was fixed during the test run, it is unsurprising that the curve in the strong-scaling test follows that of Amdahl's law, but it otherwise indicates that the communication overhead is negligible and that load balancing is reasonably close to optimal.
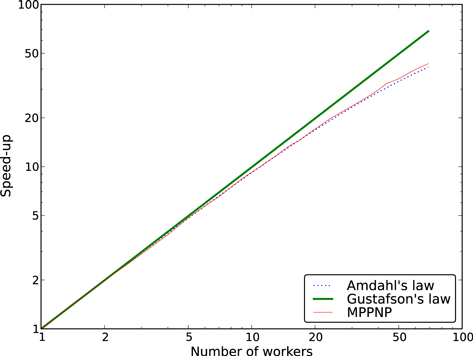
Figure 32. Speed-up factor for mppnp with respect to those of Gustafson's law and Amdahl's law with a serial fraction of 1%.
Download figure:
Standard image High-resolution imageA.2. Physics Package
The physics package provide to the post-processing code the list of isotopes and the nuclear reaction network to use in the calculations, and for every stellar evolution timestep and stellar zone the new set of reaction rates given at the correct temperature, density and electron fraction  .
.
The species included in the network are defined by a list in a database file and by two parameters, giving the maximum allowed number of species (NNN) and the lower limit of half-life of unstable species by β-decay (tbetamin). The parameter tbetamin regulates the width of the network departing from the valley of stability. In other words, all the unstable isotopes with an half-life shorter than tbetamin are not included in the network. For Set 1, the non-explosive calculations the isotopic list contains 1095 species (NNN = 1095 and tbetamin = 0.5 s). For explosive simulations, the network is increased up to 5200 species (NNN = 5200 and tbetamin = 10−5 s).
The nuclear reaction network is designed as a compilation of different compilations, with the possibility to select single specific rates from sandbox. Therefore, for the same reaction is possible to choose different reaction rates. Available reaction rate libraries are REACLIB (available interface for JINA REACLIB, the last tested revision V1.0, and Basel REACLIB, revision 20090121 Rauscher & Thielemann 2000; Cyburt et al. 2011, respectively), KADoNIS (Dillmann et al. 2006), NACRE (Angulo et al. 1999), CF88 (Caughlan & Fowler 1988), and Iliadis et al. (2001). The available compilations for weak rates are Fuller et al. (1985) Oda et al. (1994) Goriely (1999) Langanke & Martínez-Pinedo (2000).
For temperatures above 6 × 10⁹ K, network calculations are switched to NSE. Temperature-dependent partition function and mass excess are given by the REACLIB revision used for the simulations. Coulomb screening correction is applied according to Calder et al. (2007). The NSE module is included into a loop where feedback to the  from weak interactions is checked, and considered for following NSE steps.
The isomers considered are  m,
m,  m,
m,  m,
m,  m, and
  m. Long-lived, non-thermalized isomers and ground states are considered as separated species. For temperatures lower than a given thermalization temperature, both the ground state and the isomeric state are produced. In case they are unstable, we use terrestrial β-decay rates (e.g., Ward & Fowler 1980). For temperatures higher than the thermalization temperature, the production channels to the considered isomer are neglected, and only the thermalized specie is fed. In case the isotope is unstable, above thermalization temperature the stellar β-decay rate is used. Such a simple implementation is going to be upgraded in the near future, to properly take into account the transition phase to thermalization.
A.3. Solver Package
The solver package used to perform nucleosynthesis post-processing calculations relies on a Newton–Raphson implicit implementation, which is controlled on full precision, mass conservation, and maximum size of negative yields. In case convergence criteria are not satisfied, adaptive sub-time stepping is allowed. A recursive, dynamic network generation has been integrated into the solver, i.e., the size of the network automatically adapts to the conditions given. If, for example, a neutron source is activated, the network will be automatically enlarged to include all heavy and unstable isotopes as needed according to the network fluxes. This dynamic network feature ensures that the network calculation never misses any production/depletion of different species or reaction chains.
Different numerical solvers based on the fully implicit method are included, and may be selected according to the architecture of the machine where the calculations are performed. At present, the available solvers are ludcmp/lubksb (Press et al. 1992), leqs (solves a linear system of equations a x = b via Gauss Jordan elimination), and standard LAPACK dgesv (double-precision general solver). The LAPACK solvers are provided from ACML or MKL libraries, which are optimized, respectively, for AMD Opteron and Intel processors. These LAPACK solvers can invert even rather large matrices (650 elements) rapidly (∼0.01 s).
APPENDIX B: NUGRID DATA PRODUCTS
Although we have provided the most commonly requested derived data sets, such as yield tables, the calculations hold much more information than we can report in this paper. We are therefore making the entire computed raw data sets available via CADC17
or the NuGrid website.18
The data consists of two libraries. The SEE library contains, for each timestep, profile data needed for nucleosynthesis post-processing as well as a few abundance profiles (to check the accuracy of the post-processing) for each grid point and some scalar data (like  , L, etc.). The PPD library contains the post-processing nucleosynthesis data of the SEE library data. Data is provided in the se-flavor of HDF5. These files are normal HDF5 files but follow a certain structure suitable for the purpose. Software libraries for writing and reading se files with Fortran, C, and Python, as well as detailed instructions on how to access the data, are available at the NuGrid project website.
The provided data is structured in the following way. NuGrid data comes in sets. Each set corresponds to a model generation, which is defined by a common (or similar enough) set of modeling assumptions. The data provided in this paper belong to Set 1, which are meant to be standard models and which will serve as a baseline for future, improved sets. In this paper we provide two subsets, containing models with Z = 0.01, which are Set 1.1, and Z = 0.02, which are Set 1.2. This (and the following) structure is reflected in the directory tree on the CADC data server. In each of the subset directories (set1.1 and set1.2) are four directories. For both, the SEE and the PPD libraries there are pre-SN data (i.e., the stellar evolution output, ∗_wind) and the explosion data for the massive stars (∗_exp) directories. Each of these four directories is populated with one directory for each of the relevant masses. In the stellar evolution directories see_wind output files with the ending .se.h5 can be found. The directories for low- and intermediate-mass star directories in see_wind are the actual MESA run directories, and the se.h5 are found in a subdirectory. The time evolution of the approximated one-dimensional explosion profiles (Section 2.3) are provided in .se.h5 files in the see_exp directories.
Likewise, the ppd_∗ directories contain the mppnp run directories for each mass with three types of output directories in each of them. H5_out contains se-type hdf files with the ending .out.h5. These contain complete profiles for all stable and a number of longer-lived unstable (like  ) species for every 20th timestep. The H5_restart directory contains restart files with all species that are considered in these calculations, every 500 time steps. The H5_surf directory contains surface elemental and isotopic, decayed and undecayed abundance evolutions at each timestep in the .surf.h5 files.
se files are ordinary HDF5 files, and any tool that reads HDF5 files (e.g., HDFview) may be used. We are providing the python module nugridse.py at the project website, which allows access to se data via Python. nugridse.py also provides plotting methods for the standard plot types, such as abundance distribution, table of nuclides, Kippenhahn diagram, as well as generic plot routines. The Python environment allows an easy and fast access of the data. Examples with easy steps to plot more advanced diagrams are summarized in Figure 33.
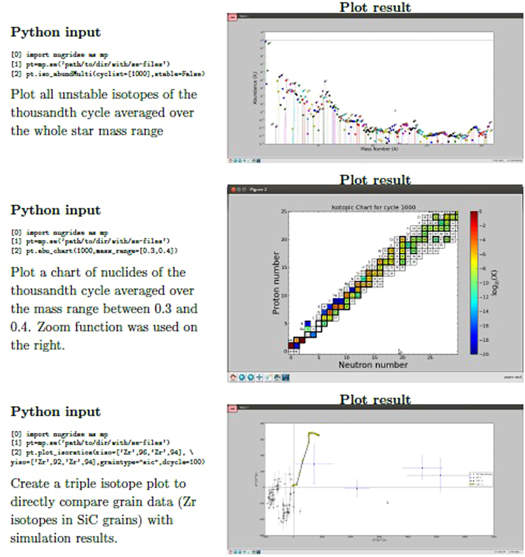
Figure 33. Examples of possible plots on the right, with easy steps to make them and some basic explanation on the left. Plotting tools and documentation are available now on github (https://github.com/nugrid).
Download figure:
Standard image High-resolution imageFootnotes
- 14
Available via CADC (http://www.canfar.phys.uvic.ca/vosui/#/nugrid/data/set1) or the NuGrid website (http://data.nugridstars.org).
- 15, , , , , , , , , , , , , , , , , , , , , , , , and .
- 16
HDF stands for Hierarchical Data Format; http://www.hdfgroup.org/HDF5/.
- 17
The Canadian Astronomical Data Center, http://www.cadc-ccda.hia-iha.nrc-cnrc.gc.ca/vosui/#nugrid.
- 18


